

Abstract
Background
Treatment with thiazolidinediones (TZDs) produces weight gain.
Objective
To test whether a portion control diet could prevent weight gain during treatment with pioglitazone in patients with type 2 diabetes mellitus (T2DM).
Design
This 16-week randomized, open-label, parallel arm study compared three groups: (i) pioglitazone plus the American Diabetes Association diet (Pio + ADA); (ii) pioglitazone plus a portion control weight loss diet (Pio + PC); (iii) metformin plus the American Diabetes Association diet (Met + ADA). All participants received the same advice about calorie reduction, lifestyle change and exercise.
Methods
Fifty-one men and women with T2DM, naive to TZDs, were randomized to a 16-week study. Pioglitazone (Pio) was titrated to a dose of 45 mg/day and metformin (Met) to a dose of 2 g/day. Fasting blood was collected for lipids, insulin and glycosylated haemoglobin A1c (HbA1c) at baseline and 16 weeks.
Results
Forty-eight of fifty-one randomized subjects completed the study. Patients treated with Pio + ADA gained 2.15 ± 1.09 kg (mean ± SD) compared with a weight loss of 2.59 ± 1.25 kg (p < 0.05) in the Pio + PC group, and aweight loss of 3.21 ± 0.7 kg (p < 0.05) in the Met + ADA group. Waist circumference and visceral adipose tissue decreased significantly more in the Pio + PC group than in the Pio + ADA group. High-density lipoprotein cholesterol levels were significantly increased in the Pio + PC group compared with the Met + ADA group. Pioglitazone reduced insulin resistance (homeostasis model assessment of insulin resistance (HOMA-IR)) more than metformin. No significant differences between groups were seen for glucose, insulin, HbA1c or low-density lipoprotein cholesterol levels.
Conclusions
Pio + PC, prevented weight gain, reduced waist circumference and visceral fat compared with Pio + ADA diet.
Keywords: body fat, glucose, HOMA-IR, lipids, metformin, visceral fat
Introduction
Thiazolidinediones (TZDs) are potent agonists of the peroxisome proliferator-activated receptor-γ (PPAR-γ), and these receptors are highly expressed in the adipose tissue but have a low expression in the liver and a very low expression in muscle. PPAR-γ receptor activation increases glucose and lipid uptake, increases glucose oxidation, decreases free fatty acid concentration and decreases insulin resistance [1]. PPAR-γ receptor activation also stimulates adipocyte differentiation resulting in more and smaller fat cells [2]. Visceral fat either does not change significantly [3] or decreases [4,5]. Hepatic fat is significantly decreased with improvements in glycaemic control and correction of dyslipidaemia [5]. Intramyocellular lipids significantly decrease, along with an improvement in the glycaemic control [5]. Insulin action is improved by various mechanisms: increasing expression, synthesis and release of adiponectin from fat cells; increasing expression of genes that increase glucose oxidation and lowering plasma free-fatty acid levels [6].
Treatment with TZDs increases body weight [3,7]. In a prior study from this laboratory, pioglitazone produced a net increase in body weight of 1.68 kg after 3 months and 3.88 kg after 6 months of treatment [3]. Most of this weight (3.5 kg) was fat, as determined by dual energy x-ray absorptiometry (DEXA). Subcutaneous adipose tissue (SAT) and visceral fat (VAT) were determined by multi-slice abdominal computerized tomography (CT). Subcutaneous fat was significantly increased by +0.82 kg at 3 months and +1.37 kg at 6 months by treatment with pioglitazone compared with placebo. In contrast, visceral fat did not change during treatment (difference between placebo and pioglitazone at 3 months was -0.09 kg and at 6 months was +0.02 kg). Because there was no change in energy expenditure measured by resting metabolic rate, we concluded that the weight gain of 3.9 kg (3.5 kg of fat) over 24 weeks was attributable to a small increase in energy intake of about 175 kcal/day. While both VAT and SAT are significantly associated with blood pressure, fasting plasma glucose, triglycerides, high-density lipoprotein cholesterol (HDL-C) and with increased odds of hypertension (HTN), impaired fasting glucose, diabetes mellitus and metabolic syndrome (MetS) (p < 0.01), VAT is more strongly correlated with metabolic risk factors than SAT [8].
Preventing or ameliorating the weight gain associated with pioglitazone would improve its acceptance by patients and physicians. A number of strategies are available to reduce food intake that might be combined with pioglitazone for this purpose. The cornerstones of such treatments are lifestyle changes, diet and exercise. The use of pharmacological agents might also be entertained. For this study, we tested the hypothesis that combining pioglitazone with a portion control diet would prevent weight gain by preventing the increase in food intake normally associated with pioglitazone use. A portion control diet can involve use of preprepared diet drinks, meal bars or frozen entrees. For this trial, we used a preprepared liquid diet. As a positive control, we included a group treated with metformin, but without the portion control diet because metformin is weight neutral or produces a small weight loss [9]. Finally, we have measured changes in subcutaneous and visceral fat.
Materials and Methods
Study Participants
Men and women aged 35-75 years who had type 2 diabetes mellitus (T2DM) but who had not been treated with TZDs were recruited. They were each provided with an informed consent approved by the Institutional Review Board that they signed after reading it and having their questions answered. T2DM was diagnosed in one of three ways: (i) a confirmed fasting plasma glucose of ≥126 mg/dl on two occasions, (ii) a glucose >200 mg/dl 2 h after a 75-g glucose load or (iii) on current treatment with a single oral antidiabetic drug other than a TZD. Patients could be treated with diet, metformin or sulphonylureas and had to be willing to be randomized to one of the three arms of the trial. Fasting plasma glucose at entry had to be ≤200 mg/dl. Use of adequate contraceptive control was required for women. This could include oral contraceptives, tubal ligation, hysterectomy or postmenopausal status, as defined by more than 6 months without a menstrual cycle and follicle stimulating hormone level of ≥40 mIU/ml. Patients on a stable dosage of medication for chronic medical conditions were included. Patients were excluded if they had significant renal, cardiac, liver, lung or neurological disease, although controlled hypertension was acceptable, if baseline blood pressure was less than 140/90 mmHg on medications. Patients with prior use of one of the two available TZDs (rosiglitazone or pioglitazone), patients receiving β-blockers, patients currently pregnant, smokers, subjects who abused alcohol or drugs were also excluded. If liver function tests at baseline (alanine transaminase or alkaline phosphatase) were greater than 2.5 times the upper limit of normal, the subjects were not enrolled. Metal objects that would interfere with the measurement of visceral fat by CT, such as implanted rods or surgical clips, prevented patients from participating. In addition, patients taking drugs known to affect energy metabolism or body weight, such as orlistat, sibutramine, ephedrine or corticosteroids, were excluded.
Clinical Protocol
This 16-week-long clinical trial was registered with http://www.ClinicalTrials.gov/ NCT00219440. A flow chart for participants in this trial is shown in figure 1. A total of 247 individuals responded to recruitment materials of which 143 were excluded on telephone interview for not meeting the inclusion criteria. The remaining 104 individuals were screened in the clinic. Of these, 53 were rejected (7 subjects changed their mind, 13 did not meet the inclusion and exclusion criteria, 7 had low glucose, 2 had high glucose, 6 had high blood pressure, 5 had other laboratory abnormalities, 3 did not meet the criteria for recent weight change, 3 were taking excluded medications, 1 did not meet the BMI criteria, 1 had a scheduling conflict, 3 failed to return to the clinic, 1 was non-compliant and 1 had to be turned away as the study was full).
Fig. 1.

Disposition of subjects from screening through completion.
A total of 51 subjects meeting all criteria were randomized into one of the three treatment groups: (i) A group treated with pioglitazone plus standard dietary advice from the American Diabetes Association (Pio + ADA); (ii) A group treated with pioglitazone who received the portion-controlled diet (Pio + PC); and (iii) A group treated with metformin and the same dietary advice that was given to the first group (Met + ADA). Patients were started on pioglitazone at a dose 30 mg/day or metformin at a dose of 500 mg/day. The haemoglobin A1c (HbA1c) target was ≤7.0%. If, after 8 weeks, the HbA1c level was >7.0% or the fasting plasma glucose level was ≥100 mg/dl, the dosage of pioglitazone was increased to 45 mg/day. This occurred in only one participant. The dose of metformin was increased by 500 mg/day every week, based on subject tolerance. A maximum dose of 2 g/day was taken as 1000 mg twice a day. As a safety criterion, individuals with an increase in HbA1c > 11% or an increase in the fasting plasma glucose >240 mg/dl were to be treated with sulphonylurea and/or insulin. No participant met this criterion.
Diet
Energy requirements for each individual were determined using the WHO/FAO calculation and multiplying this value by an activity factor of 1.3 [10]. A diet that was 500 kcal/day less than this figure was developed for each participant. In the portion-controlled group one can of Glucerna®, which provided 290 kcal, was used for breakfast and one for lunch along with black coffee or tea. No formal compliance assessment was made during the study, thus mirroring routine clinical practice where follow-up visits are usually 12-16 weeks apart. The remainder of the calories needed to meet each individual’s calculated energy needs was provided in the evening meal that was based on foods preferred by the participant in consultation with the dietitian. For the other two groups, dietary advice was based on the recommendations of the American Diabetes Association at the same calorie level.
Glucerna
Glucerna Weight Loss Shakes (11 oz) are a 290-calorie meal replacement that provides complete, balanced nutrition for use in a reduced-calorie meal plan. It contains a high-quality protein and is high in calcium and fibre. It provides 100% of the daily value for vitamins C and E and meets the American Heart Association recommendations for fatty acid profile.
Evening Meal
The evening meal was designed by a dietitian but would not be difficult to duplicate in clinical practice. It provided a balanced deficit in each macronutrient group based on the subject’s preferences and kcal level. A typical recommendation was 4-6 oz of lean meat, one to two servings of starchy vegetables and two to four servings (1/2 cup each) of other vegetables, one to two servings of fruit along with one serving of milk.
Lifestyle Instruction
All subjects were instructed to perform physical exercise of their choice for 30 min a day, five times a week. American Heart Association Step 1 instructions were provided to all participants. Lifestyle (physical exercise) and diet (ADA diet) instructions were provided to the participants at the beginning of the study. They then progressed through the trial without a formal assessment, mirroring routine clinical care, where follow-up visits are usually 12-16 weeks apart.
End-points
The primary end-point for this trial was the change in body weight from baseline to 16 weeks. Secondary endpoints were the change in body fat, change in visceral fat, HbA1c, fasting glucose, lipids and blood pressure.
Statistical Analyses
Participants were randomized using a random number generator. The data were analysed by analysis of variance with baseline data as co-variates. A Tukey’s post hoc analysis was performed to evaluate differences between groups. Sample size was based on the variance of response to pioglitazone and placebo in our previous study [3].
Results
Forty-eight of the 51 randomized subjects, 95%, completed the 16-week trial (figure 1). Table 1 shows the baseline demographic, body composition and clinical laboratory characteristics of the subjects in the three randomized groups separated by gender where appropriate. The adequacy of our randomization is shown by the fact that the three groups were not statistically different at the beginning of the study. They were obese as indicated by an average BMI of 35.5 kg/m2. They were, on average, 57.3 years of age. Their average waist circumference was 111 cm, and their body fat was 39%. VAT weighed 5.9 kg. DSAT and SSAT, as measured by CT, were similar in all three groups. The diabetes in these patients was well controlled at baseline, as indicated by an average HbA1c of 6.2%. Their blood pressure (125/77 mmHg) and lipids (total-C 185 mg/dl, low-density lipoprotein cholesterol (LDL-C) 100 mg/dl, HDL-C 46 mg/dl and triglycerides (TG) 239 mg/dl) were also well controlled.
Table 1.
Baseline characteristics of the participants
| Pioglitazone group | Metformin group | ||
|---|---|---|---|
| Variable | ADA diet | PC diet | ADA diet |
| Number | 14 | 18 | 16 |
| Gender (M/F) | 4/10 | 6/12 | 6/10 |
| Race (% white) | 78.5 | 50 | 62.5 |
| Age (years) | 59.2 ± 2.5 | 55.7 ± 2.4 | 56.9 ± 2.0 |
| Weight (kg) | 98.5 ± 3.4 | 95.3 ± 4.5 | 97.8 ± 3.8 |
| BMI (kg/m2) | 35.7 ± 1.7 | 34.3 ± 1.4 | 36.4 ± 1.7 |
| Waist circumference (cm) | |||
| Men | 109 ± 6 | 110 ± 7 | 103 ± 5 |
| Women | 113 ± 3 | 102 ± 4 | 114 ± 5 |
| Visceral fat (kg) | |||
| Men | 6.7 ± 1.6 | 8.0 ± 1.3 | 5.2 ± 0.5 |
| Women | 5.6 ± 0.5 | 4.4 ± 0.4 | 5.1 ± 0.5 |
| Body fat (%) | |||
| Men | 32 ± 3 | 32 ± 4 | 28 ± 3 |
| Women | 45 ± 1 | 42 ± 1 | 45 ± 2 |
| Computed tomography | |||
| VAT (kg) | 6.1 ± 0.5 | 6.3 ± 0.5 | 5.4 ± 0.8 |
| DSAT (kg) | 5.9 ± 0.6 | 5.2 ± 0.5 | 5.1 ± 0.6 |
| SAT (kg) | 10.1 ± 2.2 | 8.9 ± 1.7 | 8.2 ± 1.8 |
| HbA1c (%) | 6.2 ± 0.2 | 6.4 ± 0.2 | 6.0 ± 0.2 |
| Glucose (mg/dl) | 140 ± 8 | 135 ± 5 | 129 ± 6 |
| Insulin (uU/ml) | 19.4 ± 1.8 | 18.8 ± 2.2 | 18.8 ± 2.0 |
| HOMA-IR | 2.66 ± 0.22 | 2.72 ± 0.48 | 2.73 ± 0.29 |
| Cholesterol (mm Hg) | 188 ± 9 | 183 ± 6 | 185 ± 10 |
| LDL-C (mg/dl) | 98 ± 8 | 102 ± 6 | 102 ± 8 |
| HDL-C (mg/dl) | 46 ± 3 | 44 ± 2 | 48 ± 2 |
| TG (mg/dl) | 301 ± 105 | 243 ± 59 | 173 ± 23 |
| Blood pressure (SBP/DBP) | 123 ± 4/74 ± 2 | 127 ± 3/80 ± 2 | 124 ± 4/78 ± 2 |
DBP, diastolic blood pressure; HbA1c, haemoglobin A1c; HDL-C, high-density lipoprotein cholesterol; HOMA-IR, homeostasis model assessment of insulin resistance; LDL-C, low-density lipoprotein cholesterol; SBP, systolic blood pressure.
Data are mean ± s.e.m.
There is no significant treatment effect in post hoc test (with Tukey’s adjustment).
Weight loss in the three treatment groups over time is shown in figure 2. The group that received pioglitazone plus the ADA diet gained weight steadily increasing by 2.15 ± 1.09 kg (mean ± SD) at the end of the study (figure 2). The metformin-treated group receiving a similar ADA diet lost the greatest amount of weight -3.21 ± 0.7 kg. Subjects in the group receiving the portion-controlled diet in addition to pioglitazone showed a steady weight loss that averaged -2.59 ± 1.25 kg during the 16-week trial.
Fig. 2.
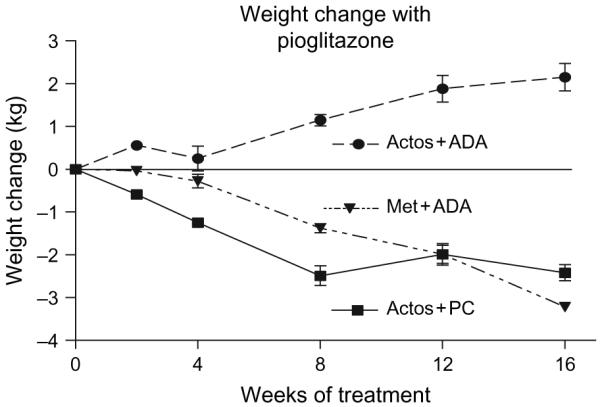
Changes in body weight during treatment for 4 months with pioglitazone and a standard diabetic diet, pioglitazone and a portion control diet or metformin and a standard diabetic diet.
Table 2 shows the change from baseline in the body composition, clinical and laboratory parameters. Pioglitazone plus the portion control diet group lost significantly more weight and decreased waist circumference and visceral fat significantly more than the pioglitazone plus ADA group. Total body fat by DXA and deep subcutaneous fat by CT decreased significantly more in the metformin plus ADA diet group than in the pioglitazone plus ADA group. HDL-C increased in both pioglitazone-treated groups, and this was significantly more in the portion-control group than in the metformin plus ADA group. Insulin resistance as measured by homeostasis model assessment of insulin resistance (HOMA-IR) decreased significantly from baseline. The two groups treated with pioglitazone had a significantly (p < 0.05) greater decline in HOMA-IR than the metformin group. Several parameters, including glucose, insulin, haemoglobin A1c, triglycerides and subcutaneous fat, did not show differential changes between treatment groups, while the blood pressure did.
Table 2.
Changes from baseline to 16 weeks
| Pioglitazone group | Metformin group | ||
|---|---|---|---|
| Variable | ADA diet | PC diet | ADA diet |
| Number | 14 | 18 | 16 |
| Body weight (kg) | 2.15 ± 1.09* | -2.59 ± 1.25† | -3.21 ± 0.7† |
| Waist circumference (cm) | -0.06 ± 1.08* | -4.72 ± 1.63† | -1.45 ± 1.01*,† |
| Total body fat (DXA, kg) | 1.11 ± 0.47* | -0.04 ± 0.44*,† | -0.54 ± 0.35† |
| Computed tomography | |||
| VAT (kg) | -0.15 ± 0.10* | -0.69 ± 0.14† | -0.23 ± 0.09*,† |
| DSAT (kg) | 1.06 ± 0.36* | 0.23 ± 0.38*,† | -0.14 ± .15† |
| SAT (kg) | -0.18 ± 0.92 | -0.25 ± 0.25 | 0.49 ± 0.84 |
| Glucose (mg/dl) | -17.92 ± 4.71 | -17.16 ± 4.96 | -12.11 ± 4.80 |
| Insulin (uU/ml) | -6.19 ± 1.31 | -4.90 ± 1.70 | -0.04 ± 2.70 |
| HOMA-IR | -0.85 ± 1.01* | -0.84 ± 0.91*,† | -0.19 ± 0.91† |
| HbA1c (%) | -0.09 ± 0.13 | -0.42 ± 0.17 | -0.24 ± 0.14 |
| LDL-C (mg/dl) | 14.30 ± 4.43 | 8.85 ± 6.45 | -2.54 ± 5.36 |
| HDL-C (mg/dl) | 6.20 ± 1.94*,† | 8.11 ± 1.70* | 1.67 ± 0.91† |
| Triglycerides (mg/dl) | -155.6 ± 95.6 | -72.8 ± 38.8 | -23.7 ± 14.7 |
| SBP (mmHg) | 8. ± 0.9* | -7.8 ± 0.7† | -2.5 ± 0.3† |
| DBP (mmHg) | 1 ± 0.2* | -6.4 ± 0.6† | -2.4 ± 0.2† |
DBP, diastolic blood pressure; DXA, dual energy x-ray absorptiometry; HbA1c, haemoglobin A1c; HDL-C, high-density lipoprotein cholesterol; HOMA-IR, homeostasis model assessment of insulin resistance; LDL-C, low-density lipoprotein cholesterol; SBP, systolic blood pressure.
Data are mean ± s.e.m.
Different symbols (e.g. * vs. †): significant difference with p value <0.05 (Tukey’s adjustment) among treatments.
Discussion
The present study has shown that a portion control diet can prevent weight gain in diabetic patients treated with pioglitazone over 16 weeks. Previous studies have shown that the weight gain during treatment with pioglitazone increases with dosage (from 15 to 45 mg/day), ranging from 0.3 to 3.6 kg in monotherapy trials and from 0.9 to 5.5 kg in combination with other antidiabetic drugs [11]. Thus, the weight gain in our pioglitazone + ADA diet group was comparable to other data and highlights the clinical finding that a portion control diet can prevent this weight gain, offering a potential way to prevent or reduce the weight gain associated with TZDs. A 2.7% (of the initial body weight) weight loss over 16 weeks in the Pio + PC group compares favourably with a 5.24% weight loss over 24 weeks, a 4.35% weight loss over 52 weeks in T2DM [12] and a 7.8% weight loss in the obese at 12 weeks [13]. Longer term weight loss studies [14] have used matched controls gaining weight over time to calculate the weight loss in overweight subjects using a portion control strategy to obtain weight loss.
Although the current trial only lasted 16 weeks, published data would suggest that portion control diets can be effective for a year or more [12,15]. In a 4-year study of portion control diets in obese patients in an out-patient setting, weight loss was maintained for 4 years [13]. In the Look AHEAD trial, diabetic patients lost an average of 8% of their body weight in 1 year using a strategy that included a portion control diet [14,16]. Thus, in both diabetic and non-diabetic subjects, this dietary approach may be useful in helping produce and maintain weight loss. This study with pioglitazone suggests a further avenue for use of this strategy to prevent weight gain.
Weight loss is an important component in preventing and treating DM and the MetS [17,18]. The Diabetes Prevention Program (DPP) showed that a 7% weight loss along with 150 min of exercise a week reduces the incidence of diabetes by 58% in subjects with impaired glucose tolerance [9]. Although maintaining increased physical activity is an important measure to help sustain weight loss [19], the DPP data indicate that almost all the benefit was because of weight loss, not exercise. In the DPP, a kilogram of weight loss resulted in a 16% reduction in risk, after adjustment for changes in diet and activity [9]. The Look AHEAD trial [16] also demonstrates that weight loss in diabetic subjects (in the intensive lifestyle intervention group) significantly improves glycaemic control and lipoprotein metabolism along with a reduction of blood pressure, despite a decrease in medications use.
Calorie restriction with or without exercise improves insulin sensitivity and beta-cell function, reduces fat cell size and ectopic lipid deposition in overweight subjects [20]. Weight loss by calorie restriction, with or without exercise, also results in reduction in fat cell size. Treatment with pioglitazone increased new small fat cells in the subcutaneous compartment [2]. We would suggest that subjects in the pioglitazone plus portion control group improved insulin sensitivity by decreasing fat cell size and reducing the total quantity of body weight and visceral fat through activation of PPAR-γ receptor.
Metformin is widely used in the treatment of diabetes and is weight neutral or produces weight loss [9,21]. In the Diabetes Prevention Program [9], a double-blind randomized trial of metformin in patients with impaired glucose tolerance showed that it could significantly reduce body weight and reduce the incidence of diabetes over 2.8 years by 31%. Other data also suggest that metformin can reduce body weight [22]. Metformin was thus selected as the comparator for the pioglitazone-portion control diet group. Although the weight loss with metformin plus the ADA diet and pioglitazone plus the portion control diet were almost identical, there were a number of differences between pioglitazone and metformin, including change in deep subcutaneous fat and a borderline difference in visceral fat. Total body fat measured by DXA and deep subcutaneous fat measured by CT were both significantly higher in the pioglitazone plus ADA group than the metformin + ADA diet group reflecting the weight gain with pioglitazone unless a weight loss therapy similar in effect to the portion control diet is implemented during pioglitazone therapy.
Both pioglitazone and metformin improved insulin resistance, as measured by HOMA-IR [23]. This was the result of the significant reductions from baseline in both glucose and insulin concentrations in all three groups. However, the subjects treated with pioglitazone had a greater decrease in HOMA-IR than the metformin group, indicating that the weight gain usually associated with pioglitazone does not impair its effect in improving diabetic control.
Pioglitazone also improved HDL-C. In the pio + ADA group HDL-C increased by 13% and in the Pio + PC group it increased 18% when compared with a 4% increase in the metformin group, again indicating that the effect of pioglitazone was independent of weight change. Increase in HDL-C, the driver of the reverse cholesterol transport pathway [24,25] has recently been shown to reverse atherosclerosis in the CHICAGO trial [26]. In this trial of diabetic subjects, there was a significant increase in HDL-C after 24 weeks in the pioglitazone-treated group compared with the glimepiride-treated group. This increase was maintained throughout the follow-up at 72 weeks and was accompanied by a significant slowing in progression of carotid artery intima-media thickness. The Quebec Heart Study has shown that for every 10% reduction in HDL-C, the risk for coronary artery disease (CAD) increased by 13% [27]. Conversely, a 10% increase in HDL-C should result in 13% reduction in CAD risk. The 13 and 18% increase in HDL-C in the Pio + ADA and the Pio + PC groups, in our study, might thus translate into a reduction of 17 and 23%, respectively, in CVD risk. The GALI study has demonstrated a significant decline in triglycerides, a significant increase in HDL-C and no change in non-HDL-C lipoproteins during treatment with pioglitazone when compared with treatment with rosiglitazone [28]. A decrease in LDL-C particle number with an increase in particle size (smaller number of large buoyant less atherogenic particles) was also demonstrated in the pioglitazone group. Pioglitazone lowers triglycerides by increasing lipoprotein lipase mass and inhibiting plasma apoC-III production rates [29]. PPAR-γ stimulation with pioglitazone produces beneficial changes in lipoprotein particle composition with reduction of triglyceride content, in very low-density lipoprotein, intermediate density lipoprotein and high-density lipoprotein (HDL) [30].
Although the LDL-C increased in both pioglitazone-treated groups and decreased in the metformin group, cardaic risk ratios (Total-C/HDL-C, LDL-C/HDL-C and TG/HDL-C) declined in all groups. Pio + ADA (from 4.1 to 3.6, from 2.14 to 2.09 and from 3.8 to 2.8), Pio + PC (from 4.2 to 3.9, from 2.3 to 2.2 and 3.7 to 2.9) and Met + ADA (from 3.8 to 3.6, from 2.1 to1.9 and 3.6 to 3.1, respectively) indicating an improved CVD risk profile.
Waist circumference decreased implying a reduction in visceral fat and an improved cardiometabolic risk profile [31,32]. Subjects between 40 and 70 years of age, with blood pressures between 115/75 to 185/115, double their cardiovascular disease risk with a rise of 20 mmHg systolic blood pressure (SBP) or a rise of 10 mmHg diastolic blood pressure (DBP) [33]. There was a significant decrease in blood pressure in the Pio + PC group when compared with the Pio + ADA diet group, the benefit of weight loss. A drop of 8 mmHg in SBP and a 6 mm in DBP in the Pio + PC group could account for a substantial cardiovascular disease risk reduction. The obese T2DM subject in the pioglitazone plus portion group positively modified all the parameters of the MetS, including a reduction in systolic and diastolic blood pressure, triglycerides, glucose, waist circumference and an increase HDL-C.
The strengths of the present study include the fact that participants were randomized to treatment groups and that more than 90% completed the study. In addition, there was a clear separation in weight changes with a loss of weight occurring in the group receiving metformin plus ADA diet and the group receiving pioglitazone plus portion control diet and a gain of weight in the pioglitazone plus ADA diet group. Although the study was only 16 weeks in duration, other data would suggest that the portion control effect can remain effective for more than a year. The Pio + PC group also had a significant decline in visceral adipose tissue (vs. Pio + ADA).
In summary, we found that pioglitazone plus a portion control diet significantly reduced weight gain, visceral fat and waist circumference when compared with pioglitazone used with the ADA diet. Pioglitazone treatment in well-controlled obese T2DM, when compared with metformin treatment, significantly modified the parameters of the MetS and reduced cardiovascular risk.
Acknowledgements
This study was supported by Takeda Pharmaceuticals, Inc. Lincolnshire, IL, USA. The study was designed by Drs Bray, Greenway, Smith and Gupta. Drs Gupta and Greenway carried out the clinical trial. Dr Gupta drafted the manuscript, and all authors contributed to its editing.
The authors thank the participants for their contribution to this study, the Pennington Clinical Trials for their help, Brandi Armand who coordinated the study and Susan Thomas who provided dietary counselling to the participants. Mr. Hui Xie provided invaluable statistical help.
Footnotes
Presented at the Annual Scientific meetings for the American Diabetes Association 2005, the North American Association for the Study of Obesity 2005 and 2007.
Declaration of Competing Interests:
Drs Smith and Bray have received research support for investigator initiated research from Takeda Pharmaceuticals North America. Dr Smith has also been a consultant, received honoraria for speaking and served on Advisory Boards for Takeda Pharmaceutical North America.
References
- 1.Dumasia R, Eagle KA, Kline-Rogers E, et al. Role of PPAR-gamma agonist thiazolidinediones in treatment of pre-diabetic and diabetic individuals: a cardiovascular perspective. Curr Drug Targets Cardiovasc Haematol Disord. 2005;5:377–386. doi: 10.2174/156800605774370362. [DOI] [PubMed] [Google Scholar]
- 2.Smith SR, Xie H, Bagnian S, Needham A, McNeil M, Bray GA. Pioglitazone changes the distribution of adipocyte size in type 2 diabetes. Adipocyte. 2006;2:11–22. [Google Scholar]
- 3.Smith SR, De Jonge L, Volaufova J, Li Y, Xie H, Bray GA. Effect of pioglitazone on body composition and energy expenditure: a randomized controlled trial. Metabolism. 2005;54:24–32. doi: 10.1016/j.metabol.2004.07.008. [DOI] [PubMed] [Google Scholar]
- 4.Miyazaki Y, Mahankali A, Matsuda M, et al. Effect of pioglitazone on abdominal fat distribution and insulin sensitivity in type 2 diabetic patients. J Clin Endocrinol Metab. 2002;87:2784–2791. doi: 10.1210/jcem.87.6.8567. [DOI] [PubMed] [Google Scholar]
- 5.Rasouli N, Raue U, Miles LM, et al. Pioglitazone improves insulin sensitivity through reduction in muscle lipid and redistribution of lipid into adipose tissue. Am J Physiol Endocrinol Metab. 2005;288:E930–E934. doi: 10.1152/ajpendo.00522.2004. Epub 4 Jan 2005. [DOI] [PubMed] [Google Scholar]
- 6.Boden G, Zhang M. Recent findings concerning thiazo-lidinediones in the treatment of diabetes. Expert Opin Investig Drugs. 2006;5:243–250. doi: 10.1517/13543784.15.3.243. [DOI] [PubMed] [Google Scholar]
- 7.Fonseca V. Effect of thiazolidinediones on body weight in patients with diabetes mellitus. Am J Med. 2003;115(Suppl 8A):42S–48S. doi: 10.1016/j.amjmed.2003.09.005. Review. [DOI] [PubMed] [Google Scholar]
- 8.Fox CS, Massaro JM, Hoffmann U, et al. Abdominal visceral and subcutaneous adipose tissue compartments: association with metabolic risk factors in the Framing-ham Heart Study. Circulation. 2007;116:39–48. doi: 10.1161/CIRCULATIONAHA.106.675355. [DOI] [PubMed] [Google Scholar]
- 9.Knowler WC, Barrett-Connor E, Fowler SE, et al. Reduction in the incidence of type 2 diabetes with life-style intervention or metformin. N Engl J Med. 2002;346:393–403. doi: 10.1056/NEJMoa012512. [DOI] [PMC free article] [PubMed] [Google Scholar]
- 10.Lin PH, Proschan MA, Bray GA, et al. Estimation of energy requirements in a controlled feeding trial. Am J Clin Nutr. 2003;77:639–645. doi: 10.1093/ajcn/77.3.639. [DOI] [PubMed] [Google Scholar]
- 11.Waugh J, Keating GM, Plosker GL, et al. Pioglitazone: a review of its use in type 2 diabetes mellitus. Drugs. 2006;66:85–109. doi: 10.2165/00003495-200666010-00005. [DOI] [PubMed] [Google Scholar]
- 12.Ditschuneit HH. Do meal replacement drinks have a role in diabetes management? Nestle Nutr Workshop Ser Clin Perform Programme. 2006;11:171–179. doi: 10.1159/000094450. [DOI] [PubMed] [Google Scholar]
- 13.Flechtner-Mors M, Ditschuneit HH, et al. Metabolic and weight loss effects of long-term dietary intervention in obese patients: four-year results. Obes Res. 2000;8:399–402. doi: 10.1038/oby.2000.48. [DOI] [PubMed] [Google Scholar]
- 14.Ryan DH, Espeland MA, Foster GD, et al. Look AHEAD (Action for Health in Diabetes): design and methods for a clinical trial of weight loss for the prevention of cardiovascular disease in type 2 diabetes (Look AHEAD Study Design paper) Control Clin Trials. 2003;24:610–628. doi: 10.1016/s0197-2456(03)00064-3. [DOI] [PubMed] [Google Scholar]
- 15.Quinn Rothacker D. Five-year self-management of weight using meal replacements: comparison with matched controls in rural Wisconsin. Nutrition. 2000;16:344–348. doi: 10.1016/s0899-9007(99)00280-4. [DOI] [PubMed] [Google Scholar]
- 16.Look AHEAD Research Group. Pi-Sunyer X, Blackburn G, et al. Reduction in weight and cardiovascular disease risk factors in individuals with type 2 diabetes: one-year results of the look AHEAD trial. Diabetes Care. 2007;30:1374–1383. doi: 10.2337/dc07-0048. [DOI] [PMC free article] [PubMed] [Google Scholar]
- 17.Lee M, Aronne LJ. Weight management for type 2 diabetes mellitus: global cardiovascular risk reduction. Am J Cardiol. 2007;99:68B–79B. doi: 10.1016/j.amjcard.2006.11.007. Review. [DOI] [PubMed] [Google Scholar]
- 18.Phelan S, Wadden TA, Berkowitz RI, et al. Impact of weight loss on the metabolic syndrome. Int J Obes (Lond) 2007;31:1442–1448. doi: 10.1038/sj.ijo.0803606. [DOI] [PubMed] [Google Scholar]
- 19.Hamman RF, Wing RR, Edelstein SL, et al. Effect of weight loss with lifestyle intervention on risk of diabetes. Diabetes Care. 2006;29:2102–2107. doi: 10.2337/dc06-0560. [DOI] [PMC free article] [PubMed] [Google Scholar]
- 20.Larson-Meyer DE, Heilbronn LK, Redman LM, et al. Effect of calorie restriction with or without exercise on insulin sensitivity, beta-cell function, fat cell size, and ectopic lipid in overweight subjects. Diabetes Care. 2006;29:1337–1344. doi: 10.2337/dc05-2565. [DOI] [PMC free article] [PubMed] [Google Scholar]
- 21.Krentz AJ, Bailey CJ. Oral antidiabetic agents: current role in type 2 diabetes mellitus. Drugs. 2005;65:385–411. doi: 10.2165/00003495-200565030-00005. Review. [DOI] [PubMed] [Google Scholar]
- 22.Bray GA, Greenway FL. Pharmacological treatment of the overweight patient. Pharmacol Rev. 2007;59:151–184. doi: 10.1124/pr.59.2.2. [DOI] [PubMed] [Google Scholar]
- 23.Bailey CJ. Treating insulin resistance in type 2 diabetes with metformin and thiazolidinediones. Diabetes Obes Metab. 2005;7:675–691. doi: 10.1111/j.1463-1326.2005.00497.x. Review. [DOI] [PubMed] [Google Scholar]
- 24.Toth PP. Reverse cholesterol transport: high-density lipoprotein’s magnificent mile. Curr Atheroscler Rep. 2003;5:386–393. doi: 10.1007/s11883-003-0010-5. Review. [DOI] [PubMed] [Google Scholar]
- 25.Gupta AK, Ross EA, Myers JN, Kashyap ML. Increased reverse cholesterol transport in athletes. Metabolism. 1993:684–690. doi: 10.1016/0026-0495(93)90233-e. [DOI] [PubMed] [Google Scholar]
- 26.Mazzone T, Meyer PM, Feinstein SB, et al. Effect of pioglitazone compared with glimepiride on carotid intimamedia thickness in type 2 diabetes: a randomized trial. JAMA. 2006;296:2572–2581. doi: 10.1001/jama.296.21.joc60158. [DOI] [PubMed] [Google Scholar]
- 27.Despres JP, Lemieux I, Dagenais GR, et al. HDL-cholesterol as a marker of coronary heart disease risk: the Quebec cardiovascular study. Atherosclerosis. 2000;153:263–272. doi: 10.1016/s0021-9150(00)00603-1. Review. [DOI] [PubMed] [Google Scholar]
- 28.Goldberg RB, Kendall DM, Deeg MA, et al. A comparison of lipid and glycemic effects of pioglitazone and rosiglitazone in patients with type 2 diabetes and dyslipidemia. Diabetes Care. 2005;28:1547–1554. doi: 10.2337/diacare.28.7.1547. [DOI] [PubMed] [Google Scholar]
- 29.Nagashima K, Lopez C, Donovan D, et al. Effects of the PPARgamma agonist pioglitazone on lipoprotein metabolism in patients with type 2 diabetes mellitus. J Clin Invest. 2005;115:1323–1332. doi: 10.1172/JCI23219. [DOI] [PMC free article] [PubMed] [Google Scholar]
- 30.Hughes TA, Stentz F, Gettys T, Smith SR. Combining beta-adrenergic and peroxisome proliferator-activated receptor gamma stimulation improves lipoprotein composition in healthy moderately obese subjects. Metabolism. 2006;55:26–34. doi: 10.1016/j.metabol.2005.06.022. [DOI] [PMC free article] [PubMed] [Google Scholar]
- 31.St-Pierre J, Lemieux I, Perron P, et al. Hypertrigly-ceridemic waist is associated with higher levels of cardiometabolic risk factors. Am J Cardiol. 2007:369–373. [Google Scholar]
- 32.Chiquette E, Ramirez G, Defronzo R. A meta-analysis comparing the effect of thiazolidinediones on cardiovascular risk factors. Arch Intern Med. 2004;164:2097–2104. doi: 10.1001/archinte.164.19.2097. [DOI] [PubMed] [Google Scholar]
- 33.Lewington S, Clarke R, Qizilbash N, et al. Age-specific relevance of usual blood pressure to vascular mortality: a meta-analysis of individual data for one million adults in 61 prospective studies. Lancet. 2002;360:1903–1913. doi: 10.1016/s0140-6736(02)11911-8. [DOI] [PubMed] [Google Scholar]