

Abstract
We have implemented a hybrid cellular automata (HCA) model based upon the structure of human prostate that recapitulates key interactions in nascent tumor foci between tumor cells and adjacent stroma. Model simulations demonstrate how stochastic interactions between tumor cells and stroma may lead to; a structural suppression of tumor growth, modest proliferation, or, unopposed tumor growth. The model incorporates key aspects of prostate tumor progression including TGF-β and matrix degrading enzyme (MDE) activity, and stromal activation. It also examines the importance of TGF-β during tumor progression and the role of stromal cell density in regulating tumour growth. The validity of one of the model’s key predictions concerning the effect of epithelial TGF-β production on glandular stability was tested in vivo. These experimental results confirmed the ability of the model to generate testable biological predictions in addition to providing new avenues of experimental interest. This work underscores the need for more pathologically representative models to cooperatively drive computational and biological modelling, which together could eventually lead to more accurate diagnoses and treatments of prostate cancer.
Introduction
Cellular automata (CA) models have been used to examine 3-dimensional growth as well as the response to radiation treatment of brain tumors such as glioblastoma multiforme (1, 2) with results that agreed well with clinical imaging data. Increasingly, CA models have been applied to more complex tumor growth and treatment problems (3, 4). For example, computational models have been shown to be capable of both selecting effective treatments and screening out ineffective treatments for lethal melanomas and GBM (5).
Computational models of avascular and vascular tumors have been extensively reported and reviewed previously (6, 7). Such models have been used to demonstrate how harsh growth conditions such as hypoxia can promote evolution of invasive tumors and the results have been related in a preliminary manner to in vitro and in vivo tumor growth experiments (8). Tumor growth models reported in the literature also consider the role of nutrients, oxygen, necrosis at low pH, aggregation kinetics in the growth, genetic and phenotypical evolution, and morphology of the growing tumor (7, 9). Discrete cell simulations are typically validated by carefully controlled in vitro experiments (10) because they can be designed to effectively collect the vast amount of information associated with computational models.
CA models are based on discrete representation of space and time on a lattice where only neighbouring lattice elements interact. One variant of the CA method is the Hybrid discrete continuous CA (HCA), where continuous equations and discrete elements are solved together on the same grid. A number of other tumor types have been accurately modeled using such methods. HCA models have been extensively described in the literature (8, 11–14). Although most of the previously described models neglect intracellular features, they are well-suited to study biological phenomena at the cellular level due to the simplicity of the logic, flexibility of the technique, and the ability to integrate multiple interacting variables across a range of spatial scales.
The prostate is a glandular sexual accessory organ composed of acinar ducts lined with luminal secretory epithelium surrounded by a layer of basal epithelial cells. These epithelial acini are encompassed by a stromal compartment composed predominantly of layers of smooth muscle (see figure 1A). The principal cellular component of the prostate are illustrated in Figure 1B.
Figure 1.

(a) H&E stained cross-sections of human prostate at medium magnification showing, from left to right, normal prosate tissue, prostatic intraepithelial neoplasia (PIN), and high grade prostatic adenocarcinoma. In the center panel, prostatic intraepithelial neoplasia (PIN) are premalignant consisting of atypical luminal epithelial cells that may develop into the invasive cancer shown in the right panel. Prostate cancer is characterized by small disorganized glands without basal cells invading into the surrounding stroma. (b) Model domain with its key cell types. The basal cells produce TGF-β and help maintain homeostasis. Luminal cells consume TGF-β and can become tumorigenic. The stromal cells occupy locations outside the acini and produce TGF-β in response to the TGF-β once it reaches a certain concentration. (c) Image with the initial configuration. The simulation domain is made of three glands, equally spaced, and surrounded by stromal cells.
Prostatic adenocarcinoma is the second mos common cause of male cancer deaths in the Western world(15). Early discrimination between relatively benign lesions and highly aggressive prostate adenocarcinomas is critical for identifying those patients that require aggressive treatment while avoiding over-treating patients who would otherwise suffer no ill effects from their tumor.
In the adult prostate, paracine crosstalk between the epithelial and surrounding stromal tissues maintain homeostasis (16, 17). The smooth muscle and all other stromal cell types are separated from the glandular acini by a collagen- and laminin-rich basement membrane that provides positional information contributing to the maintenance of tissue architecture and differentiation through cellular signaling and structural constraint (18).
The loss of homeostatic interactions between organ tissues in disease has been partially attributed to a breakdown of the positional information established during development, which includes the loss of the basement membrane (19, 20) and an alteration of the density and type of extracellular matrix (21). This matrix is produced by an ever-expanding population of myofibroblasts (22). While there is evidence that strongly implicates the role of the basement membrane and the stromal microenvironment on glandular integrity in tumor progression, the conflicting data and the vast number of factors involved in the regulation of these components limit our understanding of the multiple steps by which prostate tumors grow and invade surrounding tissues.
The effect of transforming growth factor-beta (TGF-β) on cancer progression has been the target of much research and debate (23). TGF-β normally inhibits the proliferation of epithelia through induction of the cell cycle inhibitors p15 and p21 (24). The determination of whether TGF-β will induce cytostasis or apoptosis in normal epithelia depends on the intensity of their proliferative activity in addition to poorly understood microenvironmental determinants (23, 25). Stromal production of TGF-β by prostate carcinoma-associated fibroblasts has been demonstrated to increase the growth and invasiveness of initiated prostate epithelia (26); however, the effect of epithelial TGF-β production from organized prostate glands is still unclear. Moreover, systemic inhibitors of TGF-β have yielded conflicting data in therapeutic trials (27) underscoring the need for further analysis of TGF-β’s complex roles at different stages of neoplastic progression.
The TGF-β family of cytokines are highly pleiotropic. Some of their functions, have been accurately modeled computationally, including roles in vascular remodeling, hyperplasia and wound repair (28). Continuum ODE tissue growth models of TGF-β-mediated stromal-epithelial interactions were shown to have good qualitative agreement with experimental biological results (29).
Prostate tumors have previously been investigated mathematically (30–34), (30–34) mainly focusing on the role of PSA and androgen levels in progression. Whilst insightful these models were purely continuous, non-spatial and did not consider the role of stroma. In this paper, we model prostate tumorigenesis using a HCA model that integrates five different cell species (discrete, individuals) with three different microenvironmental chemical species (continuous, concentrations), all of which are thought to play key roles in prostate cancer. Using this model, we have investigated the importance of TGF-β in driving prostate cancer progression. In particular, we examined how TGF-β regulates tumor-stroma interactions in tissues with tumor cells possessing different degrees of organization (as measured in terms of glandular morphology). In addition, following a prediction generated by the model regarding the role of TGF-β in organized glandular epithelia, we have provided previously unexamined pathological and experimental support for the ability of the model to appropriately reflect TGF-β’s physiological role at a specific stage of tumorigenesis.
Methods and materials
HCA models are mathematical tools in which discrete entities interact with continuous ones. In the model, cells are the discrete entities represented as points on a 2D grid (2mm × 2mm slice of a 3D prostate). This grid structure has been used in other cancer-related CA models (7, 35, 36) and has proved to be very efficient. This grid hosts three microenvironmental variables, which are treated as continuous concentrations, TGF-β, Matrix Degrading Enzyme (MDE) expression and Membrane/ECM. The discrete cells are designated as basal epithelial, luminal epithelial, motile stroma (representing bone marrow derived cells such as macrophages), static stroma (fibromuscular stroma) and tumor cells. Figures 1b and 2 show how cells are initially arranged: the simulated section of prostate contains three glands (Figure 2 and supplementary figure 1), each following the structure shown in 1b and arranged along an axis going from the upper left to the lower right corner of the domain (as shown in Figure 2). The space outside the glands is either empty or occupied by static and motile stromal cells. Static cells can represent muscle or fibroblastic lineages, while motile cells are predominantly modeled on bone marrow-derived monocyte/macrophage lineages.
Figure 2.

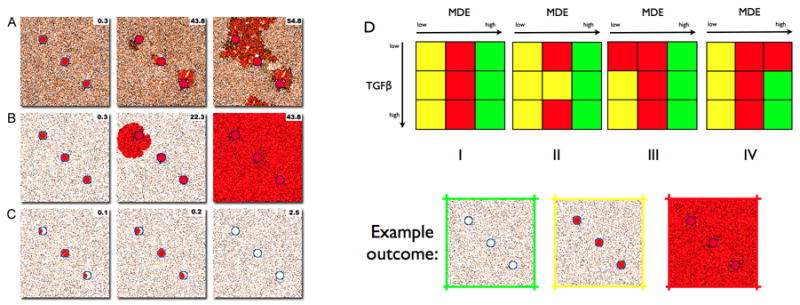
(A) Example of simulation in which the tumours break out from the glands and start growing in the messenchyme. The domain contained 40% of motile and 40% of non motilestroma. Figures show three snapshots of the simulation. After about 3 months each of the glands is entirely occupied by a tumour and MDE production is clearly visible. After 43 years two of the tumours have managed to break out from the gland. At the end of the simulation (after about 54 years) the three tumours have merged into a single one that seems posed to take over the entire domain though its pattern of growth seems to be channelled by the stroma. (B) Example of a simulation in which the tumour takes over the entire prostate. In this simulation the production of TGF-β is relatively low compared to other simulations and the proportion of motile stroma is the same than that of non motile stroma: 10%. After about 3 months each one of the glands is occupied by a tumour and MDE production is already visible. After about 22 years, the tumour in the upper gland breaks out and expands in the messenchyme. After about 43 years the tumour has taken over the entire prostate, degraded almost entirely all the membrane and TGF-β and MDEs can be found everywhere in high quantities. (C) Example of simulation in which the three tumours are initiated grow and die out before they manage to break out from the glands. In this simulation the proportion of stroma is the same than non motilestroma: 10%. The tumour cells produce MDEs at a significant higher rate than in most of the other simulations. After 60 days the central gland has almost being taken over by the tumour. After 1 month the central tumour has produced enough MDEs to degrade the basal membrane although the local concentration of TGF-β is remarkably lower than that in comparable simulations. Both tumour cells and TGF-β can be seen spilling out of the membrane and into the surrounding stroma. After 900 timesteps the simulation shows a situation similar to that at the beginning. (D) Graphical representation of the results of several simulations using different stromal configurations. Each colour represents a different outcome. Green represents simulations in which all the tumour cells die, yellow those in which the tumour does not break out from the gland and red, those in which the tumour does.(I) Simulations in which 80% of the domain is stroma. (II) Simulations with 40% of motile stroma and 10% of non motilestroma. (III) Simulations with 10% of motile stroma and 40% of non motilestroma. (IV) Simulations with 20% of stroma.
Figure 3 shows flowcharts that describe the behavior of the different cell types. A detailed explanation of these flowcharts can be found in the supplemental appendix. The microenvironmental variables of the model are, TGF-β, MDE expression and Membrane/ECM concentrations (representing both the extra cellular matrix (ECM), which is present in the messenchyme and is made of elements such as collagen, fibronectin, laminin and vitronectin, and the epithelial basement membrane). The dynamics of these microenvironmental variables are defined by three partial differential equations that describe how each of them evolves in space and time. The dynamics of TGF-β (Tβ):
which shows that TGF-β is produced by basal and cancer cells as well as by motile stromal cells in proportion to the local TGF-β concentration. It also shows that TGF-β is consumed by luminal and motile stroma cells. TGF-β also binds to the ECM at a rate that depends on the local concentration of TGF-β and also that there is some natural decay of the ligand.
Figure 3.
Flowcharts with the life cycle of the different cell phenotypes. (a) Tumour cells produce TGF-β (which they need for proliferation) and MDEs. They proliferate when there is enough TGF-β and have reached maturity. An insufficient local concentration of TGF-β triggers cell death. (b) Basal cells replace missing luminal cells and produce TGF-β to suppress proliferation. (c) Normal luminal cells consume TGF-β and die when they are surrounded by tumour cells. (d) Non motile stroma cells consume TGF-β but will produce more when the local concentration exceeds threshold. (e) Motile stromal cells are constantly moving chemotactically towards the direction of the TGF-β gradient. (f) Key interactions between the cell types and biologically active substances. Solid lines denote reduction in concentration by consumption, killing, or inhibition of production at the end with the small red cross bar. Dashed lines denote increases in concentration by promotion of production or proliferation at the end(s) with the arrow and (+) symbol. The double arrow between tumour cells and TGF-β represents TGF-β production by the tumour cells that in turn results in tumour cell proliferation by TGF-β.
MDEs (E) are produced by tumor cells (37) (at rate λ), diffuse (at rate DE) and are depleted as they degrade the ECM and the basement membrane (μ).
Basement membrane/ECM (M) is produced by basal cells (depending on the current local concentration of ECM ensuring the density never exceeds the maximum m0) and motile stroma (depending on rate αF, scaled by the local concentration of TGF-β (38)). Finally, the ECM gets degraded by the MDEs at a rate μ:
These microenvironmental factors (equations above) coupled with the discrete cells (defined by the cellular life cycle flowcharts), represent an evolving dynamic hybrid model of the prostate in which tumor progression emerges from the interactions of all the key elements. Cell behavior results from the interactions with other cells in competition for space and via the microenvironmental factors as shown in Figure 3f. It can be seen that TGF-β is a key factor that determines the survival and growth of both tumor and normal epithelial cells, as well as the behavior of stromal cells. The balance of TGF-β, MDEs and membrane production modulates the competition of the different cellular species.
Time is discrete and is measured in timesteps of 24h. At each timestep cells follow their life cycle (figure 3). The timescale affecting the microenvironmental variables is assumed to be much faster (×100) than that of the cells in order to accommodate the different timescales affecting processes at the cellular and molecular levels.
The parameters used to characterize the model are assigned the values shown in table 1. Many of the values used are estimates, denoted by an asterisk (39–41), that are biologically plausible but not in every case experimentally measured. As the values need to be non-dimensionalized, the results of the non-dimensionalization (with respect to time, which is taken to have cell cycles of 24h, and space of 2mm × 2 mm) are also given. These parameters have the property of making the system homeostatic before cancer initiation. Therefore under normal circumstances (in the absence of tumor cells), there is a natural homeostatic state for all the variables with equilibrium concentrations of TGF-β, ECM and MDE.
Table 1. Model parameters.
Parameters with (*) denote estimated values. Parameters with (**) denote a series of parameters for which the model was tested.
| Parameter | Value | Normalized value |
|---|---|---|
| DTβ | 2 × 10⁻⁹ cm2/s (*) | 0.02 |
| m0 | 1.050 g/cm3 | 0.1 |
| αT,B | 230 × 10−12 g/day/cells (*) | 0.01 |
| αT,C | 1.8 × 10⁻⁹ cm3/day/cell (*) | 1 (0.1, 10)** |
| αE,C | 1 × 10⁻⁹ | 0.0001 (0.01, 1×10 −6)** |
| γT,S | 2.7 × cm3/day/cells (*) | 0.1 |
| Tβ,S,0 | 2.6 × 10⁻⁸ cm3/day/cells (*) | 1 |
| γT,M | 9.5 × 10⁻² cm3/g/day (*) | 1×10⁻⁶ |
| γ′T,S | 1.35 × 10⁻² cm3/g/day (*) | 0.01 |
| τ | 24h | 1 |
| DE | 10−9 cm2/s | 0.00054 |
| DT | 2 × 10⁻⁹ cm2/s | 0.000108 |
| DN | 10−9 cm2/s | 0.00054 |
| Stroma | (10%-10%)**,(40%-10%)**, (10%–40%)**,(40%-40%)** |
Results
Because the composition of the stromal compartment has been shown to be statistically correlated with prostate disease recurrence (42), the role of stroma on tumors at different stages of malignancy (determined by TGF-β and MDE production) was studied. Each of the simulations was allowed to run for 20000 time steps, corresponding to almost 55 years in real time. After 10 time steps, 6 basal epithelial cells (4 in the central acinus and one on each of the two remaining acini) become abnormal cells initiating tumorigenesis. The simulations test different stromal configurations in which the proportion of stroma in the domain range from 20 to 40% of the total space. The stromal configurations considered are (motile, non-motile):
1- High proportion of motile and non-motile stroma (40%, 40%).
2- High proportion of motile stroma (40%, 10%).
3- High proportion of non-motile stroma (10%, 40%).
4- Low proportion of motile and non-motile stroma (10%, 10%).
Sample simulations
Figure 2 (and supplementary movies) shows the three main outcomes resulting from the simulations. Figure 2a shows an example of a simulation in which the tumor breaks out from the acini and grows into the surrounding stroma. Initially (a) the tumor cells fill the lumen inside the gland. Eventually (b), the basement membrane starts to degrade and TGF-β begins to leak from the gland and attract motile stroma. At the end of the simulation (c), the tumor has taken a significant portion of the domain but its growth is constrained by the motile stroma responding to the TGF-β gradient. As a result of periodic boundary conditions, tumor cells growing on the upper boundary appear on the bottom however, this has no effect on the simulation outcome. Figure 2b shows a simulation in which tumor cells quickly break from the gland and grow unopposed. Finally, Figure 2c shows tumor cells producing excessive quantities of MDE, which leads to early breakdown of the basement membrane and resulting leakage of the TGF-β, without which the tumor cells die.
Varying the microenvironment
To further investigate the three distinct outcomes the model can produce we examined the effect of varying each of the three microenvironmental parameters. Due to the limitations of our parameter estimates, varying them over two orders of magnitude also allows us to test the robustness of the model outcomes as well as the sensitivity (see figure 2d). Subfigures d(i)–d(iv) show the type of outcome.
MDE production has a dominant effect on the outcome of the simulations and results show that too little MDE production leaves the tumor confined to the gland whereas too much means that the basement membrane breaks down (and consequently, TGF-β spills out of the gland) too early, depriving the tumor cells of the required minimum of TGF-β level to survive (see fig. 2). This hints that there is an optimal range of MDE production that would allow the tumor to escape from the gland and invade the surrounding tissue. This particular range is parameter dependent, modulated by the rate at which the basal membrane is degraded by tumor cells and repaired by basal and stromal cells as well as the susceptibility of the tumour cells to TGF-β concentration.
Contrary to our expectations, tumour TGF-β production does not modify significantly the simulation outcomes. Stromal configuration on the other hand, has a more significant effect on tumor progression. Prostates with a high proportion of stromal cells are less likely to be taken over by a tumor than those with less density of stromal cells. The role of stroma in tumor promotion becomes critical after the tumor has escaped from the gland and it is also at this point when TGF-β, which mediates the interactions between stroma and tumor, plays a more dominant role. In fact, tumor cell TGF-β production from within contained glands seems to inhibit tumor progression due to the recruitment of matrix-producing motile stroma. This often leads to an increased deposition of stromal produced ECM (See figure 2A and compare supplemental figures 2 and 3 with different amounts of stromal cells). In order to ground this in pathologic reality, human PIN biopsies were immunostained for TGF-β and counterstained with Masson’s trichrome to determine whether an adjacent stromal matrix deposition could be observed. Figure 4 shows very little to no TGF-β immunoreactivity in normal human prostate glandular epithelium (a) compared to high immunoreactivity in some glandular PIN foci (b). Furthermore, trichrome staining of these sections revealed that the stroma adjacent TGF-β expressing PIN foci had increased collagen production, confirming the HCA model outcome.
Figure 4.
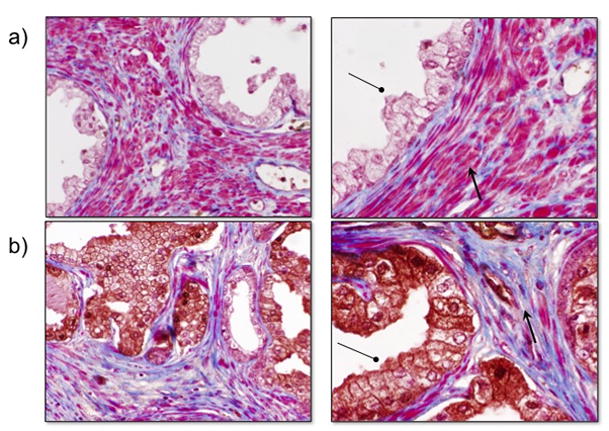
Human PIN foci expressing TGF-β show altered adjacent stroma. Compared to normal prostates (a), PIN foci that express TGF-β (b) show decreased periacinar smooth muscle with increased collagen deposition as shown by TGF-β (circle) and trichrome (arrow) staining.
Given the potential implications, it was important to determine whether the prediction that tumor cell TGF-β production does not significantly alter the simulation outcome was biologically realistic. To test this, constitutively active TGF-β1 was overexpressed in a human prostate epithelial cell line previously demonstrated to be capable of malignant transformation (BPH1) (43, 44). Importantly, this cell line is able to form acini when recombined with inductive rat urogenital mesenchyme (rUGM) (44) allowing us to determine whether the expression of TGF-β might result in enhanced tumorigenicity.
A HA-tagged, constitutively active TGF-β1 previously generated and characterized (45) was expressed in BPH1 cells (see materials and methods) (Figure 5a). To confirm its functionality, conditioned media collected from parental BPH1 and BPH1TGFβ1 cells were placed on serum-starved human prostate fibroblasts expressing a red fluorescent protein TGF-β reporter. Results show an activation of TGF-β signalling by BPH1TGFβ1 cell conditioned media, but not the parental control (Figure 5b). To test our simulation prediction, we recombined each epithelial cell line with rUGM for 6 weeks under the kidney capsule of SCID mice, a technique previously applied to the study of prostate development and tumor formation (44). Kidney capsule grafting of tissue recombination with inductive rUGM results shows that TGF-β1 production decreased the overall size of the tissue recombination graft by 3–4 fold (Figure 5c). Histologically, trichrome (Figure 5d) and smooth muscle (Figure 5e) staining of these grafts revealed that BPH1TGFβ1 grafts show a decrease in smooth muscle and an increase in periacinar collagen production over controls, consistent with changes seen around pre-malignant human lesions (figure 4). Moreover, histochemical identification of basement membrane by PAS staining demonstrates that TGF-β1 production by initiated prostate epithelia does not affect glandular containment (Figure 6).
Figure 5.
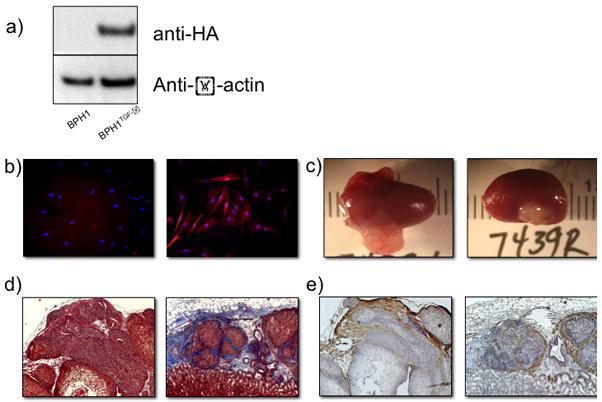
Functional TGF-β overexpression by contained prostate epithelial glands. (a) HA-tagged, constitutively active TGF-β1 was constitutively expressed in BPH1 human prostate epithelia. (b) Conditioned media from BPH1-TGFb1 (right), but not BPH1 (left) cells in culture activated a RFP TGFbeta reporter in serum-starved human prostate fibroblasts. (c) Kidney capsule tissue recombination grafting shows a decrease in graft size when rUGM is recombined with BPH1-TGFb1 (right) versus parental control (left). Trichrome (d) and smooth muscle alpha actin (e) staining reveals predominantly smooth muscle surrounding BPH1 acini (left) verses increased periacinar collagen deposition in BPH1-TGFbeta grafts (right).
Figure 6.
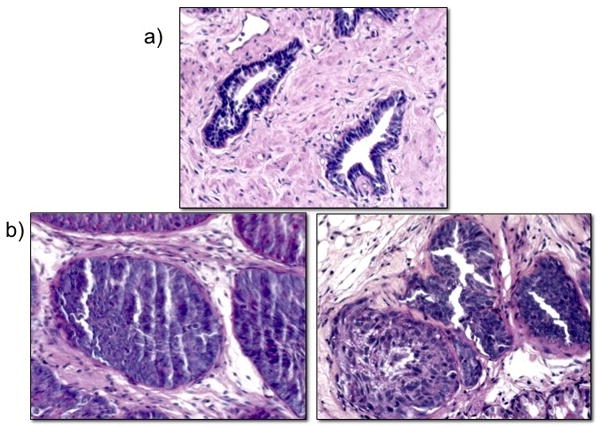
BPH1- TGF-β glands are contained by basement membranes. PAS staining in normal human prostate (a) and tissue recombination grafts (b) of BPH1 (left) and BPH1-TGFbeta (right) demonstrate glandular containment by basement membranes.
Discussion
This paper introduces a mathematical model that recapitulates some key elements of tumor progression, such as epithelial invasion and stromal reorganization. The aim of the model is to provide a basic platform from which to study the role of TGF-β and stroma in prostate tumor progression from non-tumorigenic homeostasis to preneoplasia to malignancy. To be useful mathematical models must generate hypotheses which can be tested in biological systems and compared to clinical observations, and further must be amenable to testing and generating a deeper understading of biological phenomena.
Prostatic intraepithelial neoplasia, (PIN) was first defined 20 years ago and is considered to be the most common premalignant lesion in prostate cancer (46). PIN can be made to regress in humans (47) and this process can also be documented in experimental animal models (48); however, it is unclear if such regression happens spontaneously in patients. Thus, while PIN can progress to cancer, this is not an inevitable progression and the conditions that promote or suppress such a progression are presently unknown.
Under basal conditions, the model presented here is homeostatic. The disruption of homeostasis as a result of the appearance of tumor cells, can result in one of four different scenarios, depending on the phenotype of the tumor cells as well as the stromal microenvironment. These scenarios (fig. 2) are: (i) nascent tumors that develop slowly and remain at a stage that recapitulates aspects of the pre-malignant lesion PIN; (ii) tumors that break out of their acinar containment and invade locally but do not outgrow the other cell types; and (iii) tumors that develop rapidly and take over the prostate (fig 4b). (iv) tumors that develop quickly but are self-limiting, dying out before progression beyond PIN (fig 4c). These results show both the potential of the model to capture distinct outcomes and the reproduction of the diversity of timescales at which different prostate tumors are known to develop.
This mathematical model generated a number of hypotheses. In our simulated prostate environment, before tumor break out, TGF-β production by tumor cells appears to have little effect on the outcome of the progression (see fig. 2), which was corroborated experimentally (see fig. 5). TGF-β in this model does recruit motile stromal cells, which structurally inhibit glandular breakdown through matrix production, which was also corroborated by examination of clinical samples of human PIN foci expressing TGF-β (see fig. 4). This ineffectiveness persists regardless of either the proportion of stromal subtypes or the rates of production of MDEs by the tumor cells. Similar to biological assumptions (23, 49), the effects of TGF-β in this model are more likely to be tumorigenic once tumor cells emerge from a contained PIN-like state as determined by the effects of the TGF-β gradient on tumor cell growth and stromal recruitment (see fig. 2a). This is consistent with previously described biological observations (26).
A second hypothesis generated by the model concerns the role of tumor cell MDE production. The results show that there is a critical range of values of MDE production that are optimal for tumor progression. If tumor cells produce MDEs at a suboptimal rate, the time to break out and even the chances of the tumor progressing from PIN are affected negatively (see fig. 2). Alternatively, excessive production of MDEs might work against the tumor and simulation results suggest that too much MDE production could, under certain conditions, lead to tumor cell death. Degrading the basement membrane too quickly may result in TGF-β diffusing out of the glandular acinus, leaving the tumor cells in the gland with insufficient growth factors to survive (supplementary figure 4). Therefore, it is a prediction of this model that the appropriate resources (e.g. TGF-β) essential for invasion and survival of tumor cells outside of the gland are available once the basement membrane is breached. The specific values that characterize this critical range of MDE production will depend on the rest of the parameters of the model such as TGF-β production and diffusion or the rate at which MDE is used to degrade the basal membrane.
There are a number of implications coming from these hypotheses. The first suggests that, despite the central role that TGF-β played in the conception of the model (see fig. 3f), the level of production by tumor cells does not affect the initial premalignant stages of tumorigenesis. This hypothesis does not address the role of TGF-β once the tumor progresses beyond containment, where TGF-β’s role appears to be more pro-tumorigenic. A different hypothesis, which could have far-reaching implications, is the role of excessive MDE production by tumor cells in halting tumor progression, which, at present, is untested.
Finally, an interesting insight provided by the model is the dual role of structural constraints in tumor progression. The glandular structure of the prostate both delays and protects tumor growth. While this arrangement limits the growth in the early stages, it provides a haven in which tumor cells can grow until they reach a critical mass. The role of the stromal configuration has also been shown to be important before and after the tumor breaks out from the gland. In those cases in which the proportion of stroma is high, degradation of the basement membrane is hindered by the presence of motile stroma. Furthermore, when the membrane is breached, the stroma helps to constrain tumor expansion. Thus, the model hints that the abundance of stromal cells, both motile (that block tumor growth and produce ECM) and static (that amplify the TGF-β signal and provide a clearer gradient for motile stroma), hinder tumor growth.
A key value of designing biologically relevant mathematical models is the clarification of deficiencies in biological modeling. At present, there is no valid biological model of the effect of stromal heterogeneity on human prostate glandular stability or tumor progression. As such, adequate experimental validation and model parameterization of the effects of variable stromal compositions under different MDE conditions remains unexamined. However, attempts at developing such a model are ongoing, which will provide a biological tool for examining both mathematical and pathological predictions concerning the effects of stromal heterogeneity on tumor progression.
In order to obtain a tractable model, simplifications were unavoidable. For example, all tumor cells share the same phenotype. Nonetheless, tumors are microcosms of evolution in which several tumor phenotypes coexist as a result of microenvironmental heterogeneity and a complex evolutionary process. Furthermore, it is known that some types of stromal cells, such as fibroblasts, can alter their phenotype in response to microenvironmental changes produced by a tumor. It is likely that these evolutionary dynamics would impact tumor progression. Therefore, it is our goal to explore the effect of the stromal-tumor co-evolution in prostate tumor progression.
Supplementary Material
Acknowledgments
We are grateful to the VICBC workshop, in particular to Lourdes Estrada, for facilitating and motivating this integrative cancer research project. This work has benefited from the financial support of the NIH/NCI grants of the Microenvironmental Influences in Cancer (2T32 CA009592-21A1), TMEN (1U54 CA126505, and 1U54 CA 126568) and ICBP (5U54 CA113007) programs.
References
- 1.Kansal AR, Torquato V, Harsh GR, Chiocca EA, Deisboeck TS. Cellular automaton of idealized brain tumor growth dynamics. Biosystems. 2000;55:119–27. doi: 10.1016/s0303-2647(99)00089-1. [DOI] [PubMed] [Google Scholar]
- 2.Zacharaki EI, Stamatakos GS, Nikita KS, Uzunoglu NK. Simulating growth dynamics and radiation response of avascular tumour spheroids-model validation in the case of an EMT6/Ro multicellular spheroid. Comput Methods Programs Biomed. 2004;76:193–206. doi: 10.1016/j.cmpb.2004.07.003. [DOI] [PubMed] [Google Scholar]
- 3.Anderson ARA, Chaplain MA. Continuous and discrete mathematical models of tumor-induced angiogenesis. Bull Math Biol. 1998;60:857–99. doi: 10.1006/bulm.1998.0042. [DOI] [PubMed] [Google Scholar]
- 4.Chaplain MA, McDougall SR, Anderson AR. Mathematical modeling of tumor-induced angiogenesis. Annu Rev Biomed Eng. 2006;8:233–57. doi: 10.1146/annurev.bioeng.8.061505.095807. [DOI] [PubMed] [Google Scholar]
- 5.Cappuccio A, Elishmereni M, Agur Z. Cancer Immunotherapy by Interleukin-21: Potential Treatment Strategies Evaluated in a Mathematical Model. Cancer Research. 2006;66:7293–300. doi: 10.1158/0008-5472.CAN-06-0241. [DOI] [PubMed] [Google Scholar]
- 6.Roose T, Chapman S, Maini P. Mathematical Models of Avascular Tumour Growth. SIAM Review. 2007;49:179–208. [Google Scholar]
- 7.Gerlee P, Anderson ARA. An evolutionary hybrid cellular automaton model of solid tumour growth. JTB. 2007;246:583–603. doi: 10.1016/j.jtbi.2007.01.027. [DOI] [PMC free article] [PubMed] [Google Scholar]
- 8.Anderson ARA, Weaver A, Cummings P, Quaranta V. Tumor Morphology and Phenotypic Evolution Driven by Selective Pressure from the Microenvironment. Cell. 2006;127:905–15. doi: 10.1016/j.cell.2006.09.042. [DOI] [PubMed] [Google Scholar]
- 9.Gatenby R, Smallbone K, Maini P, et al. Cellular adaptations to hypoxia and acidosis during somatic evolution of breast cancer. British Journal of Cancer. 2007:97. doi: 10.1038/sj.bjc.6603922. [DOI] [PMC free article] [PubMed] [Google Scholar]
- 10.Song H, Lacks D, Enmon R, Jain S. Monte Carlo Simulation of LNCaP Human Prostate Cancer Cell Aggregation in Liquid Overlay Culture. Biotechnology progress. 2003:19. doi: 10.1021/bp034061n. [DOI] [PubMed] [Google Scholar]
- 11.Chaplain M, Anderson ARA. Mathematical Modelling. Simulation and prediction of tumour induced angiogenesis. Invasion and Metastasis. 1997;16:222–34. [PubMed] [Google Scholar]
- 12.Patel A, Gawlinski E, Lemieux S, Gatenby R. a cellular automaton model of early tumor growth and invasion. J Theor Biol. 2001;213:315 – 31. doi: 10.1006/jtbi.2001.2385. [DOI] [PubMed] [Google Scholar]
- 13.Anderson ARA, Pitcairn A. Application of the Hybrid Discrete-continuum Technique. In: Alt W, editor. Polymer and Cell Dynamics. Boston: Birkhäuser; 2003. [Google Scholar]
- 14.Dormann S, Deutsch A. Modeling of self-organized avascular tumor growth with a hybrid cellular automaton. In Silico Biol. 2002;2:393–406. [PubMed] [Google Scholar]
- 15.Harnden P, Naylor B, Shelley MD, Clements H, Coles B, Mason MD. The clinical management of patients with a small volume of prostatic cancer on biopsy: what are the risks of progression? A systematic review and meta-analysis. Cancer. 2008;112:971–81. doi: 10.1002/cncr.23277. [DOI] [PubMed] [Google Scholar]
- 16.Hayward SW, Rosen MA, Cunha GR. Stromal-epithelial interactions in the normal and neoplastic prostate. Br J Urol. 1997;79 Suppl 2:18–26. doi: 10.1111/j.1464-410x.1997.tb16917.x. [DOI] [PubMed] [Google Scholar]
- 17.Cunha GR, Hayward SW, Wang YZ. Role of stroma in carcinogenesis of the prostate. Differentiation. 2002;70:473–85. doi: 10.1046/j.1432-0436.2002.700902.x. [DOI] [PubMed] [Google Scholar]
- 18.Bissell MJ, Hall HG, Parry G. How does the extracellular matrix direct gene expression? J Theor Biol. 1982;99:31–68. doi: 10.1016/0022-5193(82)90388-5. [DOI] [PubMed] [Google Scholar]
- 19.Boudreau N, Werb Z, Bissell MJ. Suppression of apoptosis by basement membrane requires three-dimensional tissue organization and withdrawal from the cell cycle. Proc Natl Acad Sci U S A. 1996;93:3509–13. doi: 10.1073/pnas.93.8.3509. [DOI] [PMC free article] [PubMed] [Google Scholar]
- 20.Liotta L, Rao C, Wewer U. Biochemical interactions of tumor cells with the basement membrane. Annual Review of Biochemistry. 1988;55:1037–57. doi: 10.1146/annurev.bi.55.070186.005133. [DOI] [PubMed] [Google Scholar]
- 21.Paszek MJ, Zahir N, Johnson KR, et al. Tensional homeostasis and the malignant phenotype. Cancer Cell. 2005;8:241–54. doi: 10.1016/j.ccr.2005.08.010. [DOI] [PubMed] [Google Scholar]
- 22.Tuxhorn JA, Ayala GE, Smith MJ, Smith VC, Dang TD, Rowley DR. Reactive stroma in human prostate cancer: induction of myofibroblast phenotype and extracellular matrix remodeling. Clin Cancer Res. 2002;8:2912–23. [PubMed] [Google Scholar]
- 23.Massague J. TGFbeta in Cancer. Cell. 2008;134:215–30. doi: 10.1016/j.cell.2008.07.001. [DOI] [PMC free article] [PubMed] [Google Scholar]
- 24.Massague J, Blain SW, Lo RS. TGFbeta signaling in growth control, cancer, and heritable disorders. Cell. 2000;103:295–309. doi: 10.1016/s0092-8674(00)00121-5. [DOI] [PubMed] [Google Scholar]
- 25.Derynck R, Akhurst RJ, Balmain A. TGF-beta signaling in tumor suppression and cancer progression. Nat Genet. 2001;29:117–29. doi: 10.1038/ng1001-117. [DOI] [PubMed] [Google Scholar]
- 26.Ao M, Franco OE, Park D, Raman D, Williams K, Hayward SW. Cross-talk between paracrine-acting cytokine and chemokine pathways promotes malignancy in benign human prostatic epithelium. Cancer Res. 2007;67:4244–53. doi: 10.1158/0008-5472.CAN-06-3946. [DOI] [PubMed] [Google Scholar]
- 27.Dumont N, Arteaga CL. A kinase-inactive type II TGFbeta receptor impairs BMP signaling in human breast cancer cells. Biochem Biophys Res Commun. 2003;301:108–12. doi: 10.1016/s0006-291x(02)02977-7. [DOI] [PubMed] [Google Scholar]
- 28.Budu-Grajdeanu P, Schugart RC, Friedman A, Valentine C, Agarwal AK, Rovin BH. A mathematical model of venous neointimal hyperplasia formation. Theor Biol Med Model. 2008:5. doi: 10.1186/1742-4682-5-2. [DOI] [PMC free article] [PubMed] [Google Scholar]
- 29.Michelson S, Leith J. Autocrine and paracrine growth factors in tumor growth: A mathematical model. Bulletin of Mathematical Biology. 1991;53:639–56. doi: 10.1007/BF02458633. [DOI] [PubMed] [Google Scholar]
- 30.Vollmer RT, Humphrey PA. Tumor volume in prostate cancer and serum prostate-specific antigen. Analysis from a kinetic viewpoint. Am J Clin Pathol. 2003:80–9. doi: 10.1309/UNAQ-JTFP-B1RQ-BQD4. [DOI] [PubMed] [Google Scholar]
- 31.Jackson TL. A mathematical investigation of the multiple pathways to recurrent prostate cancer: comparison with experimental data. Neoplasia. 2004;6:697–704. doi: 10.1593/neo.04259. [DOI] [PMC free article] [PubMed] [Google Scholar]
- 32.Jackson TL. A Mathematical Model of Prostate Tumor Growth and Androgen-Independent Relapse. Discrete Contin Dynam Sys. 2004;4:187–202. [Google Scholar]
- 33.Swanson KR, Harpold HL, True LD. Prostate-specific antigen: a clinical and mathematical conundrum. Am J Clin Pathol. 2006;125:331–3. doi: 10.1309/g9jehlw3afdy7rnp. [DOI] [PubMed] [Google Scholar]
- 34.Swanson KR, True LD, Murray JD. On the use of quantitative modeling to help understand prostate-specific antigen dynamics and other medical problems. Am J Clin Pathol. 2003;119:14–7. doi: 10.1309/AR06-82JH-8B1B-G058. [DOI] [PubMed] [Google Scholar]
- 35.Anderson ARA. A hybrid mathematical model of solid tumour invasion: the importance of cell adhesion. Math Med Biol. 2005:22. doi: 10.1093/imammb/dqi005. [DOI] [PubMed] [Google Scholar]
- 36.Deutsch A, Dormann S. Cellular Automaton modelling of biological pattern formation: characterization, applications and Analysis. Birkhaeuser; Boston: 2005. [Google Scholar]
- 37.Phillips JL, Hayward SW, Wang Y, et al. The consequences of chromosomal aneuploidy on gene expression profiles in a cell line model for prostate carcinogenesis. Cancer Res. 2001;61:8143–9. [PubMed] [Google Scholar]
- 38.Wynn TA. Cellular and molecular mechanisms of fibrosis. J Pathol. 2008;214:199–210. doi: 10.1002/path.2277. [DOI] [PMC free article] [PubMed] [Google Scholar]
- 39.Thorne RG, Lakkaraju A, Rodriguez-Boulan E, Nicholson C. In vivo diffusion of lactoferrin in brain extracellular space is regulated by interactions with heparan sulfate. Proc Natl Acad Sci USA. 2008;105:8416–21. doi: 10.1073/pnas.0711345105. [DOI] [PMC free article] [PubMed] [Google Scholar]
- 40.Wier ML, Edidin M. Effects of cell density and extracellular matrix on the lateral diffusion of major histocompatibility antigens in cultured fibroblasts. J Cell Biol. 1986;103:215–22. doi: 10.1083/jcb.103.1.215. [DOI] [PMC free article] [PubMed] [Google Scholar]
- 41.Gall WE, Edelman GM. Lateral diffusion of surface molecules in animal cells and tissues. Science. 1981;213:903–5. doi: 10.1126/science.7196087. [DOI] [PubMed] [Google Scholar]
- 42.Ayala G, Tuxhorn JA, Wheeler TM, et al. Reactive stroma as a predictor of biochemical-free recurrence in prostate cancer. Clin Cancer Res. 2003;9:4792–801. [PubMed] [Google Scholar]
- 43.Hayward SW, Wang Y, Cao M, et al. Malignant transformation in a nontumorigenic human prostatic epithelial cell line. Cancer Res. 2001;61:8135–42. [PubMed] [Google Scholar]
- 44.Hayward SW, Haughney PC, Rosen MA, et al. Interactions between adult human prostatic epithelium and rat urogenital sinus mesenchyme in a tissue recombination model. Differentiation. 1998;63:131–40. doi: 10.1046/j.1432-0436.1998.6330131.x. [DOI] [PubMed] [Google Scholar]
- 45.Wolfraim LA, Alkemade GM, Alex B, Sharpe S, Parks WT, Letterio JJ. Development and application of fully functional epitope-tagged forms of transforming growth factor-beta. J Immunol Methods. 2002;266:7–18. doi: 10.1016/s0022-1759(02)00090-x. [DOI] [PubMed] [Google Scholar]
- 46.DeMarzo AM, Nelson WG, Isaacs WB, Epstein JI. Pathological and molecular aspects of prostate cancer. Lancet. 2003;361:955–64. doi: 10.1016/S0140-6736(03)12779-1. [DOI] [PubMed] [Google Scholar]
- 47.Kang TY, Nichols P, Skinner E, et al. Functional heterogeneity of prostatic intraepithelial neoplasia: the duration of hormonal therapy influences the response. BJU Int. 2007;99:1024–7. doi: 10.1111/j.1464-410X.2006.06738.x. [DOI] [PubMed] [Google Scholar]
- 48.Narayanan BA, Narayanan NK, Pittman B, Reddy BS. Regression of mouse prostatic intraepithelial neoplasia by nonsteroidal anti-inflammatory drugs in the transgenic adenocarcinoma mouse prostate model. Clin Cancer Res. 2004;10:7727–37. doi: 10.1158/1078-0432.CCR-04-0732. [DOI] [PubMed] [Google Scholar]
- 49.Bierie B, Moses HL. TGF-beta and cancer. Cytokine Growth Factor Rev. 2006;17:29–40. doi: 10.1016/j.cytogfr.2005.09.006. [DOI] [PubMed] [Google Scholar]
Associated Data
This section collects any data citations, data availability statements, or supplementary materials included in this article.