Abstract
Aim
Because dyslipidemia, such as hypercholesterolemia, is a characteristic of primary biliary cirrhosis (PBC), hepatic lipid metabolism may be disturbed in PBC patients. We examined the expression of lipid metabolism-associated genes in PBC liver.
Methods
All of the patients examined were in stage I or II PBC and without medication. RNA was isolated from liver specimens by needle biopsies of PBC patients and controls. The expression levels of various genes were measured by real-time RT-PCR. Multidrug resistance 3 (MDR3) expression was examined immunohistochemically. Statistical correlations between the gene expression levels and indices of blood testing were calculated.
Results
The expression levels of sterol regulatory element-binding protein (SREBP) 2 and LDL receptor were significantly lower, and those of apolipoprotein B, microsomal triglyceride transfer protein, ATP-binding cassette G5, and liver X receptor α (LXRα) were significantly higher in the PBC liver than in the normal control liver. The expression levels of bile acid synthesis- and excretion-associated genes did not change, and those of farnesoid X receptor, peroxisome proliferator-activated receptor α, and SREBP-1c were similar between the PBC and normal liver. MDR3 gene expression levels in the PBC liver were more than 4-fold higher than those in the control liver. Immunohistochemically, strong canalicular staining for MDR3 was observed in the PBC liver. LXRα expression was positively correlated with MDR3 levels. Serum levels of γ-glutamyl transpeptidase (GGT) and IgM were negatively correlated with MDR3 levels.
Conclusions
Hepatocellular cholesterol metabolism was at least partially disturbed, even in the early stage of PBC. The most characteristic finding was a distinct elevation of MDR3 expression, and the MDR3 levels were negatively correlated with GGT and IgM levels.
Keywords: Primary biliary cirrhosis, MDR3, LXRα, Phospholipids, Cholesterol
Introduction
Primary biliary cirrhosis (PBC) is a chronic autoimmune disease in which the intrahepatic small bile ducts are the main target of the disease. PBC is serologically characterized by the presence of antimitochondrial antibodies, and numerous studies have used an immunological approach for the investigation of the disease. However, the nature of the disease is still unclear. In terms of clinical blood testing, hypercholesterolemia is one of the characteristic findings of PBC, in addition to enhanced biliary enzyme activity and elevated IgM levels. Therefore, hepatic lipid metabolism may be disturbed in PBC patients. However, detailed analyses of lipid metabolism in PBC liver have not been reported.
Many hepatocytic factors are associated with cholesterol uptake, synthesis, and secretion, bile acid synthesis and secretion, and phospholipid synthesis and secretion. Sterol regulatory element-binding protein (SREBP) 2, which is a key enzyme in cholesterol metabolism, promotes the expression of the LDL receptor (LDLR), HMG-CoA reductase (HMGR), which is the rate-controlling enzyme in de novo cholesterol synthesis, and Niemann-Pick C1 like 1 (NPC1L1), which is involved in sterol uptake from the bile [1–3]. Apolipoprotein B (ApoB) and microsomal triglyceride transfer protein (MTP) function in very low-density lipoprotein cholesterol secretion [4]. ATP-binding cassette (ABC) G5 and ABCG8 function as a heterodimer and are responsible for sterol efflux from hepatocytes [3]. ABCG5/G8 and NPC1L1 proteins are localized to the canalicular membrane of the liver. mRNA levels of ABCG5 and ABCG8 are increased with a high cholesterol diet probably via liver X receptor α (LXRα)-mediated pathway, whereas SREBP-2 mRNA levels are suppressed by LXRα and cholesterol overload [1, 2].
Cholesterol 7α-hydroxylase (CYP7A1), the rate-limiting enzyme in bile acid synthesis from cholesterol, is downregulated by a nuclear hormone receptor, farnesoid X receptor (FXR), via the small heterodimeric partner protein-mediated pathway [2, 5, 6]. Chenodeoxycholic acid and other bile acids are endogenous ligands for the FXR [2, 5]. Bile salt export pump (BSEP/ABCB11) mediates the elimination of bile acids from hepatocytes and plays a critical role in the generation of bile flow [6]. FXR, which is upregulated by LXRα, activates BSEP expression [2, 5, 6]. Phospholipids, comprising mainly of phosphatidylcholine, are supplied via fatty acid synthesis, which is mediated by the LXRα–SREBP-1c pathway [1, 2]. LXRα, the agonist of which include some oxysterols, activates peroxisome proliferator-activated receptor α (PPARα) expression, and the expression of multidrug resistance 3 (MDR3/ABCB4) is upregulated by PPARα and FXR [5–8].
In this study, we examined the mRNA levels of these cholesterol metabolism-associated genes in the liver of patients with early-stage PBC (Scheuer’s classification I or II) and in the normal liver. The associations between the gene expression levels and clinical data of the patients were also analyzed. We found that the expression of genes associated with cholesterol uptake and synthesis was suppressed and that of genes associated with cholesterol secretion/excretion was upregulated in the PBC liver, perhaps as a response to the intracellular cholesterol accumulation. There were no changes in the expression levels of genes associated with bile salt synthesis or secretion. The most characteristic finding was enhanced MDR3 expression in the PBC liver, which may reflect disease activity.
Methods
Patients and samples for real-time RT-PCR
The study population included 18 patients with PBC (males/females = 1/17) that was diagnosed histologically at Kyushu Medical Center Hospital between October 2006 and October 2007. The patients had not been treated with any medicines for PBC, such as ursodeoxycholic acid (UDCA), fibrates, and statins, before the liver biopsy was performed. All patients provided written informed consent before entering the study. Blood biochemistry, including IgM, was examined 1 or 2 days before the biopsy. For real-time RT-PCR, tissue samples were obtained by liver biopsy. As a control, normal liver tissue was obtained from 10 living donors of liver transplantation whose liver function and histological findings were completely normal. Written consent was obtained from these donors for this investigation. We performed real-time RT-PCR and compared gene expression between the PBC liver and normal liver.
Total RNA was prepared with TRIzol reagent (Invitrogen, Carlsbad, CA), and cDNA was synthesized from 1.0 μg of RNA with GeneAmpTM RNA PCR (Applied Biosystems, Branchburg, NJ) using random hexamers. Real-time RT-PCR was performed using LightCycler-FastStart DNA Master SYBR Green 1 (Roche, Basel, Switzerland) according to the manufacturer’s instructions. The reaction mixture (20 μl) contained LightCycler-FastStart DNA Master SYBR Green 1, 4 mM of MgCl2, 0.5 μM of the upstream and downstream PCR primers, and 2 μl of first-strand cDNA as a template. To control for variation in the reactions, all PCR data were normalized against β-actin expression. The primer sets for real-time RT-PCR in this study are listed in Table 1.
Table 1.
Primer sets of real-time PCR
| Genes | Forward (5′ → 3′) | Reverse (5′ → 3′) |
|---|---|---|
| LXRα | GCCGAGTTTGCCTTGCTCA | TCCGGAGGCTCACCAGTTTC |
| SREBP-1c | GGCTCCTGCCTACAGCTTCT | CAGCCAGTGGATCACCACA |
| SREBP-2 | ACAACCCATAATATCATTGAGAAACG | TTGTGCATCTTGGCGTCTGT |
| MDR3 | GCCGAGTTTGCCTTGCTCA | TCCGGAGGCTCACCAGTTTC |
| LDLR | CAACGGCTCAGACGAGCAAG | AGTCACAGACGAACTGCCGAGA |
| BSEP | CTTCATCATGGACCTGCCACA | GGATGAGGGCTCTGGCGATA |
| FXR | ACCTCGACAACAAAGTCATGCAG | ATTGGTTGCCATTTCCGTCA |
| CYP7A1 | AGCATTTGTGAATACATGGCTGGA | TTCACAAGCAAGCACTGGTGAAC |
| ABCG5 | ATTGTGGTTCTCACCATTCACCAG | GGTTTGAATGTTCAGGACAAGGGTA |
| ApoB | TCAAGAGTTACAGCAGATCCATCAA | TCAGAATGGAAGTCCTTAAGAGCAA |
| MTP | AGCACCTCAGGACTGCGAAGA | CAGAGGTGACAGCATCCACCA |
| HMGR | GCCTGGCTCGAAACATCTGAA | CTGACCTGGACTGGAAACGGATA |
| NPC1L1 | TCTGTGGAGTTTGTGTCCCACATTA | GTTGGTCATGGCCACACCTG |
| PPARα | CAGCCTGTGGCCTCTGTAGTT | CCCTTTACACAACCGAAGTTCCT |
| β-actin | TGGCACCCAGCACAATGAA | CTAAGTCATAGTCCGCCTAGAAGCA |
LXR liver X receptor, SREBP sterol regulatory element-binding protein, MDR multidrug resistance, BSEP bile salt export pump, FXR farnesoid X receptor, CYP7A1 cholesterol 7α-hydroxylase, ABCG5 ATP-binding cassette G5, ApoB apolipoprotein B, MTP microsomal triglyceride transfer protein, HMGR HMG-CoA reductase, NPC1L1 Niemann-Pick C1 like 1, PPAR peroxisome proliferator-activated receptor
Immunohistochemical examination
Biopsy samples of PBC (n = 8) and normal liver (n = 5) were provided for immunohistochemical analysis. Each specimen was fixed in formaldehyde, paraffin-embedded, cut into 5 μm thick sections, and dewaxed in xylene. Monoclonal anti-MDR3 P-glycoprotein (Sigma, St. Louis, MO) was used for the primary antibody. Histofine Simple Stain PO (Nichirei, Tokyo, Japan) was used in our assay. For antigen retrieval, tissue slides were incubated with L.A.B. solution (Polysciences, Warrington, PA) for 15 min at room temperature. After blocking endogenous peroxidase activity with 3% hydrogen peroxide in methanol for 15 min, the slides were incubated with 10% normal goat serum for 30 min. Staining with Simple Stain PO was performed in accordance with the manufacturer’s protocol.
Statistical analysis
The results are expressed as means ± SD. Continuous variables were compared using the Mann–Whitney U test. Correlation between two variables was assessed using Spearman’s rank correlation coefficient. The value of P < 0.05 was considered statistically significant.
Results
Gene expression levels in PBC liver
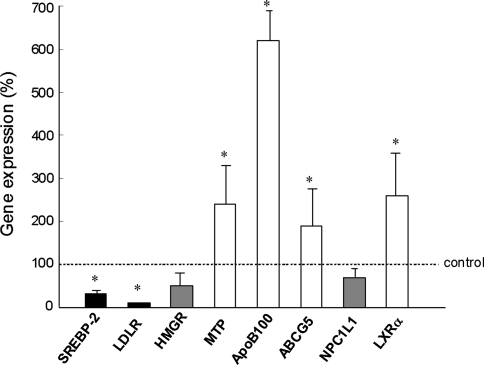
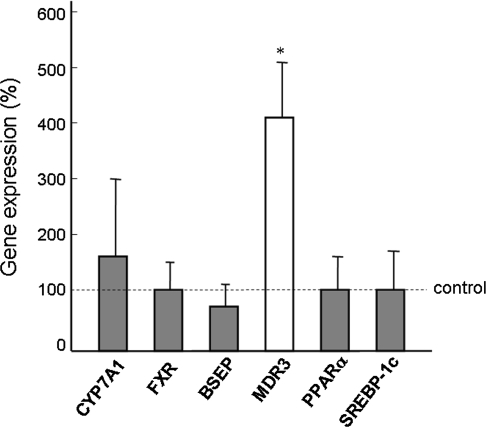
RNA samples were prepared from the liver biopsy samples from PBC patients (n = 18) and living donors for liver transplantation (n = 10). The background characteristic of the PBC patients is shown in Table 2. The histological features of all patients indicated stage I or II PBC according to Scheuer’s classification. Blood levels of biliary enzymes, such as alkaline phosphatase (ALP) and γ-glutamyl transpeptidase (GGT), were elevated, but mean lipid levels were within the normal range. The gene expression of hepatocytic factors associated with cholesterol uptake, synthesis, and secretion was measured by real-time RT-PCR. As shown in Fig. 1, SREBP-2 and LDLR were significantly lower and ApoB, MTP, ABCG5, and LXRα were significantly higher in the liver of PBC patients than in the normal controls. The levels of HMGR and NPC1L1 were lower in the PBC patients than in the controls, but the difference was not significant. The expression of bile acid synthesis- and excretion-associated genes and phospholipid synthesis- and excretion-associated genes is shown in Fig. 2. CYP7A1, which is involved in the synthesis of bile acid from cholesterol, was upregulated, although this was not significant. The expression of FXR, BSEP, PPARα, and SREBP-1c in the PBC liver was similar to that in the controls. The most characteristic finding was the marked increase in MDR3 gene expression in the PBC liver, which was more than 4-fold higher than for the controls.
Table 2.
Laboratory and histologic characteristics of the patients
| Number of patients | 18 |
| Age (years) | 64.4 ± 10.4 |
| Male/Female | 1/17 |
| AST (IU/l) | 77.7 ± 123.8 |
| ALT (IU/l) | 98.4 ± 205.9 |
| GGT (IU/l) | 189.5 ± 170.1 |
| ALP (IU/l) | 468.1 ± 194.3 |
| T-Cho (mg/dl) | 200.8 ± 28.0 |
| HDL-C (mg/dl) | 61.9 ± 14.6 |
| LDL-C (mg/dl) | 120.4 ± 20.8 |
| Triglyceride (mg/dl) | 102.6 ± 44.6 |
| Platelets (×1000/μl) | 233.9 ± 67.9 |
| Histology (I/II/III/IV) | 11/7/0/0 |
AST aspartate aminotransferase, ALT alanine aminotransferase, GGT γ-glutamyl transpeptidase, ALP alkaline phosphatase, T-Cho total cholesterol, HDL-C HDL-cholesterol, LDL-C LDL-cholesterol
Fig. 1.
Expression levels of cholesterol uptake-, synthesis-, and secretion-associated genes. SREBP-2 sterol regulatory element-binding protein 2, LDLR LDL receptor, HMGR HMG-CoA reductase, MTP microsomal triglyceride protein, ApoB apolipoprotein B, ABCG5 ATP-binding cassette G5, NPC1L1 Niemann-Pick C1 like 1, LXRα liver X receptor α. * Significant difference between PBC patients and normal control
Fig. 2.
Expression levels of bile acid synthesis- and secretion-associated genes and phospholipid synthesis- and secretion-associated genes. CYP7A1 cholesterol 7α-hydroxylase, FXR farnesoid X receptor, BSEP bile salt export pump, MDR3 multidrug resistance 3, PPARα peroxisome proliferator-activated receptor α, SREBP-1c sterol regulatory element-binding protein-1c. * Significant difference between PBC patients and normal control
Immunohistological MDR3 expression
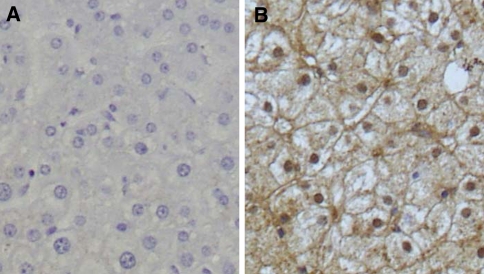
Next, MDR3 expression was examined immunohistochemically. Because no antibodies suitable for paraffin-embedded tissues could be obtained, we used an antibody that worked well on frozen sections. The normal liver showed scarce staining for MDR3 in hepatocytes (Fig. 3a). In contrast, the PBC liver showed strong staining for MDR3 and the staining was predominantly localized to the canaliculi (Fig. 3b). Although precise quantification was not possible in this study, the histological findings suggest overproduction of MDR3 in the PBC liver.
Fig. 3.
Immunohistochemical staining for MDR3 in the normal liver (a) and PBC liver (b). MDR3 multidrug resistance 3. Original magnification: ×100
Correlation between MDR3 and other indices
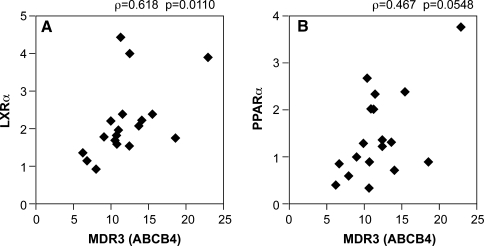
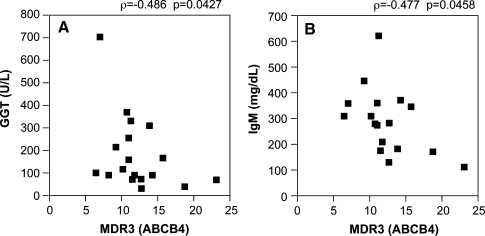
We examined the correlations between MDR3 gene expression and the expression of its associated genes. Of the factors that are known to positively regulate the expression of MDR3, LXRα was strongly correlated with MDR3 (ρ = 0.618, P = 0.0110, Fig. 4a). There was a tendency for the correlation between PPARα and MDR3, although it was not statistically significant (ρ = 0.467, P = 0.0548, Fig. 4b). However, there was no correlation between FXR and MDR3 (data not shown). MDR3 expression was significantly and negatively correlated with blood markers, including GGT (ρ = −0.486, P = 0.0427) and IgM (ρ = 0.477, P = 0.0458, Fig. 5), but not with ALP (data not shown).
Fig. 4.
Correlations between the expression levels of MDR3 and LXRα (a) or PPARα (b). MDR3 multidrug resistance 3, PPARα peroxisome proliferator-activated receptor α, LXRα liver X receptor α
Fig. 5.
Correlations between the expression levels of MDR3 and the serum levels of GGT (a) or IgM (b). MDR3 multidrug resistance 3, GGT γ-glutamyl transpeptidase
Discussion
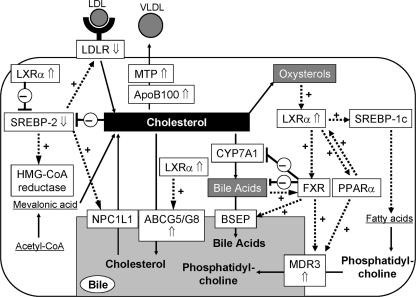
Some previous reports have analyzed the expression of factors associated with lipid metabolism in PBC patients. However, the number of factors examined was limited and the patients were often in advanced stages of disease, nearly cirrhotic (stage III or IV) and/or under medication for PBC, for example, with UDCA and fibrates [8–11]. In our study, we selected only newly diagnosed patients in the early stage of PBC (i.e., at stage I or II) according to Scheuer’s classification and were without medication for PBC. Therefore, effects of liver insufficiency or other medical effects on lipid metabolism can be excluded. If the state of cholesterol metabolism is associated with disease progression, our patients may present reliable data for the relationship between disease activity and metabolic disorders. Moreover, we examined the expression levels of most of the genes associated with cholesterol metabolism. The expression pattern of lipid metabolism-associated genes in the PBC liver compared with the control liver is summarized in Fig. 6.
Fig. 6.
Schema showing the interactions between cholesterol metabolism-associated factors. Arrows (⇑ and ⇓) represent significant difference in expression levels between PBC patients and normal controls. LDLR LDL receptor, SREBP sterol regulatory element-binding protein, NPC1L1 Niemann-Pick C1 like 1, ApoB apolipoprotein B, MTP microsomal triglyceride protein, ABCG5/G8 ATP-binding cassette G5/G8, LXRα liver X receptor α, CYP7A1 cholesterol 7α-hydroxylase, FXR farnesoid X receptor, BSEP bile salt export pump, PPARα peroxisome proliferator-activated receptor α, MDR3 multidrug resistance 3
In the PBC liver, the expression of genes associated with cholesterol uptake and synthesis (i.e., SREBP-2, LDLR, HMGR, and NPC1L1) was downregulated, whereas that of cholesterol secretion-associated genes (i.e., ApoB, MTP, ABCG5, and LXRα) was upregulated compared with the levels of normal controls (Fig. 1). These results seem to represent a physiological response against intracellular cholesterol accumulation in PBC patients, namely, cholesterol uptake and synthesis are suppressed, whereas secretion/excretion is accelerated. On the basis of the gene expression pattern shown in Fig. 6, bile acid synthesis and excretion do not appear to be affected by the early stage of PBC. Of the genes associated with phospholipid synthesis and excretion, a marked increase in MDR3 expression, by more than 4-fold than in the control, was observed in the PBC liver (Fig. 2). MDR3 regulates the efflux of phospholipids into bile. Excreted phospholipids form micelles with bile acids to protect the biliary epithelium from the toxicity of hydrophobic bile acids [12]. Zollner et al. [9, 10] previously reported upregulation of hepatic MDR3 at the mRNA level in advanced cases of PBC (stage III/IV in Ludwig’s classification), but not in the early cases (stage I/II). Their results in the early stage of PBC are inconsistent with our results. This discrepancy may be due to the different methods; Zollner et al. determined mRNA copy numbers by competitive PCR. Our method, real-time RT-PCR, may be more reliable. This smaller number of patients in the report of Zollner et al. may be another reason. Although the antibody we used against MDR3 was not recommended for paraffin-embedded tissues, our immunohistochemical examination showed enhanced canalicular expression of MDR3 in the PBC liver (Fig. 3). We consider that the result is probably reliable because similar MDR3 expression and distribution were reported by Ros et al. [11], who used frozen sections of PBC liver. MDR3 upregulation may not be a feature specific for PBC liver. We have also determined hepatic gene expression in patients with nonalcoholic fatty liver disease or drug-induced liver disease. The expression of MDR3 was also upregulated in both diseases; however, the levels of PPARα were significantly lower than those in PBC and normal liver, and there was no correlation between MDR3 and PPARα (data not shown). In the future, we must examine the expression of these genes in patients with other chronic and progressive diseases of bile ducts, such as primary sclerosing cholangitis.
The efficacy of fibrates for the treatment of PBC has been recently demonstrated [13–15]. Fibrates induce MDR3 gene expression, canalicular redistribution of MDR3, and biliary phospholipid secretion by a PPARα-mediated pathway [16–18]. The relationship between MDR3 and PPARα expression in our study (Fig. 4b) may indirectly indicate that fibrates, agonists of PPARα, can contribute to the induction of MDR3 expression and phospholipid secretion to suppress the cytotoxicity of hydrophobic bile acids. Moreover, the MDR3 expression levels were negatively correlated with serum levels of GGT and IgM (Fig. 5). It is known that an increase in the serum GGT level reflects excessive release of the enzyme caused by biliary cell damage and upregulation of enzyme induction by alcohol intake [15]. The increased production of IgM in PBC patients is generally considered to be due to immune activation [16, 19]. Therefore, GGT and IgM are recognized in PBC as markers for biliary damage and B-lymphocyte activity, respectively [20]. In other words, GGT and IgM levels appear to represent PBC disease activity. Our results support recent reports using single-nucleotide polymorphism analysis, which showed that MDR3 haplotypes and diplotypes are associated with the progression of PBC [21, 22]. In this study, the patients, in whom GGT and IgM levels were already elevated (Table 2), were in the early stages and without any medication for PBC. Moreover, the MDR3 levels were upregulated in the PBC patients before treatment, whereas PPARα expression was not enhanced (Figs. 2, 6). This means that PPARα possesses the capacity for further upregulation and that fibrates efficiently activate PPARα and MDR3.
This study is the first to report a detailed analysis of the expression of cholesterol metabolism-associated genes in the liver of early-stage PBC patients without any medication. In conclusion, hepatocellular cholesterol metabolism is at least partially disordered, even in the early stage of PBC. The most characteristic change was a marked increase in MDR3 expression and that the MDR3 levels were negatively correlated with serum levels of GGT and IgM. Therefore, upregulation of MDR3 levels may be associated with disease activity and progression of PBC. In clinical studies, the quantification of protein levels and localization of the proteins are difficult because sufficient sampling or repeated biopsies cannot be performed. In the future, these analyses should be repeated in patients under medication and/or in advanced stages for comparison with the present data.
References
- 1.Goldstein JL, Debose-Boyd RA, Brown MS. Protein sensors for membrane sterols. Cell. 2006;124:35–46. doi: 10.1016/j.cell.2005.12.022. [DOI] [PubMed] [Google Scholar]
- 2.Wójcicka G, Jamroz-Wiśniewska A, Horoszewicz K, Bełtowski J. Liver X receptors (LXRs); part I: structure, function, regulation of activity, and role in lipid metabolism. Postepy Hig Med Dosw. 2007;61:736–759. [PubMed] [Google Scholar]
- 3.Kidambi S, Patel SB. Cholesterol and non-cholesterol sterol transporters: ABCG5, ABCG8 and NPC1L1: a review. Xenobiotica. 2008;38:1119–1139. doi: 10.1080/00498250802007930. [DOI] [PubMed] [Google Scholar]
- 4.Kato M, Higuchi N, Enjoji M. Reduced expression of ATGL and CGI-58 in the liver may attribute to develop NAFLD in patients with insulin resistant background. Scand J Gastroenterol. 2008;43:1018–1019. doi: 10.1080/00365520802008140. [DOI] [PubMed] [Google Scholar]
- 5.Erpecum KJ. Biliary lipids, water and cholesterol gallstones. Biol Cell. 2005;97:815–822. doi: 10.1042/BC20040088. [DOI] [PubMed] [Google Scholar]
- 6.Jansen PLM, Sturm E. Genetic cholestasis, causes and consequences for hepatobiliary transport. Liver Int. 2003;23:315–322. doi: 10.1034/j.1478-3231.2003.00856.x. [DOI] [PubMed] [Google Scholar]
- 7.Oude Elfrrink RPJ, Paulusma CC. Function and pathophysiological importance of ABCB4 (MDR3 P-glycoprotein) Eur J Physiol. 2007;453:601–610. doi: 10.1007/s00424-006-0062-9. [DOI] [PubMed] [Google Scholar]
- 8.Matsumoto T, Miyazaki H, Nakahashi Y, Hirohara J, Seli T, Inoue K, et al. Multidrug resistance3 is in situ detected in the liver of patients with primary biliary cirrhosis, and induced in human hepatoma cells by bezafibrate. Hepatol Res. 2004;30:125–136. doi: 10.1016/j.hepres.2004.08.015. [DOI] [PubMed] [Google Scholar]
- 9.Zollner G, Fickert P, Zenz R, Fuchsbichler A, Stumptner C, Kenner L, et al. Hepatobiliary transporter expression in percutaneous liver biopsies of patients with cholestatic liver diseases. Hepatology. 2001;33:633–646. doi: 10.1053/jhep.2001.22646. [DOI] [PubMed] [Google Scholar]
- 10.Zollner G, Fickert P, Silbert D, Fuchsbichler A, Marschall HU, Zatloukal K, et al. Adaptive changes in hepatobiliary transporter expression in primary biliary cirrhosis. J Hepatol. 2003;38:717–727. doi: 10.1016/S0168-8278(03)00096-5. [DOI] [PubMed] [Google Scholar]
- 11.Ros JE, Libbrecht L, Geuken M, Jansen PLM, Roskams TAD. High expression of MDR1, MRP1, and MRP3 in the hepatic progenitor cell compartment and hepatocytes in severe human liver disease. J Pathol. 2003;200:553–560. doi: 10.1002/path.1379. [DOI] [PubMed] [Google Scholar]
- 12.Borst P, Evers R, Kool M, Wijnholds J. The multidrug resistance protein family. Biochim Biophys Acta. 1999;1461:347–357. doi: 10.1016/S0005-2736(99)00167-4. [DOI] [PubMed] [Google Scholar]
- 13.Kanda T, Yokosuka O, Imazeki F, Saisho H. Bezafibrate treatment: a new medical approach for PBC patients? J Gastroenterol. 2003;38:573–578. doi: 10.1007/s00535-002-1102-7. [DOI] [PubMed] [Google Scholar]
- 14.Dohmen K, Mizuta T, Nakamuta M, Shimohashi N, Ishibashi H, Yamamoto K. Fenofibrate for patients with asymptomatic primary biliary cirrhosis. World J Gastroenterol. 2004;10:894–898. doi: 10.3748/wjg.v10.i6.894. [DOI] [PMC free article] [PubMed] [Google Scholar]
- 15.Kita R, Takamatsu S, Kimura T, Kokuryu H, Osaki Y, Tomono N. Bezafibrate may attenuate biliary damage associated with chronic liver diseases accompanied by high serum biliary enzyme levels. J Gastroenterol. 2006;41:686–692. doi: 10.1007/s00535-006-1831-0. [DOI] [PubMed] [Google Scholar]
- 16.Chinale J, Vollrath V, Wielandt AM, Amigo L, Rigotti A, Nervi F, et al. Fibrate induce mdr2 gene expression and biliary phospholipids secretion in the mouse. Biochem J. 1996;314:781–786. doi: 10.1042/bj3140781. [DOI] [PMC free article] [PubMed] [Google Scholar]
- 17.Shoda J, Inada Y, Tsuji A, Kusama H, Ueda T, Ikegami T, et al. Bezafibrate stimulates canalicular localization of NBD-labeled PC in HepG2 cells by PPARα-mediated redistribution of ABCB4. J Lipid Res. 2004;45:1813–1825. doi: 10.1194/jlr.M400132-JLR200. [DOI] [PubMed] [Google Scholar]
- 18.Shoda J, Okada K, Inada Y, Kusama H, Utsunomiya H, Oda K, et al. Bezafibrate induces multidrug-resistance P-glycoprotein 3 expression in cultured human hepatocytes and humanized livers of chimeric mice. Hepatol Res. 2007;37:548–556. doi: 10.1111/j.1872-034X.2007.00069.x. [DOI] [PubMed] [Google Scholar]
- 19.Iwasaki S, Tsuda K, Ueta H, Aono R, Ono M, Saibara T, et al. Bezafibrate may have a beneficial effect in pre-cirrhotic primary biliary cirrhosis. Hepatol Res. 1999;16:12–18. doi: 10.1016/S1386-6346(99)00033-9. [DOI] [Google Scholar]
- 20.Kuntz E, Kuntz HD. Hepatology: Principles and Practice. Berlin: Springer; 2001. pp. 580–590. [Google Scholar]
- 21.Pauli-Magnus C, Kerb R, Fattinger K, Lang T, Anwald B, Kullak-Ublick GA, et al. BSEP and MDR3 haplotype structure in healthy Caucasians, primary biliary cirrhosis and primary sclerosing cholangitis. Hepatology. 2004;39:779–791. doi: 10.1002/hep.20159. [DOI] [PubMed] [Google Scholar]
- 22.Ohishi Y, Nakamura M, Iio N, Higa S, Inayoshi M, Aiba Y, et al. Single-nucleotide polymorphism analysis of the multidrug resistance protein 3 gene for the detection of clinical progression in Japanese patients with primary biliary cirrhosis. Hepatology. 2008;48:853–862. doi: 10.1002/hep.22382. [DOI] [PubMed] [Google Scholar]


