Abstract
We study the nature of fluorescence scattering by a radiating fluorophore placed near a metal nanoparticle with the finite-difference time-domain method. Angle-resolved light-scattering distributions are contrasted with those that result when ordinary plane waves are scattered by the nanoparticle. For certain sized nanoparticles and fluorophore dipoles oriented parallel to the metal surface, we find that the highest scattered fluorescence emission is directed back toward the fluorophore, which is very different from plane-wave scattering. The largest enhancements of far-field radiation are found when the dipole is oriented normal to the surface. We also examined the effect of the fluorophore on the near field around the particle. The fields can be enhanced or quenched compared to the isolated fluorophore and exhibit strong dependence on fluorophore orientation, as well as interesting spatial variations around the nanoparticle.
1. INTRODUCTION
Fluorescence is one of the dominant detection methodologies in the biosciences. During the past decade, there have been continual advances in probe chemistry. For modern fluorophores such as the cyanine dyes, the optical absorption cross-sections are comparable to their geometric cross-sections, and their quantum yields are often 0.5 or higher. Hence it seems unlikely that future small organic fluorophores will be substantially brighter than currently available fluorophores. In part, this limitation is one of the reasons behind the current interest in quantum dots and polymeric probes containing multiple fluorophores [1-4].
During the past several years we have reported that certain kinds of fluorophore-metal interactions can lead to an increase in fluorophore brightness. By metal we mean a conducting metallic structure, typically wavelength- or subwavelength-sized silver particles. We found that proximity of fluorophores to metallic particles resulted in increased intensity, decreased lifetime, and sometimes increased photostability [5-9]. These effects appear to be due to several reasons, namely, the increased fields near the particles induced by the incident light and coupling of excited-state fluorophores to surface plasmons in the metal particle, which in turn radiates to the far-field [10]. (Of course the surface plasmons in question are electromagnetic surface modes of a metallic sphere that can exhibit charge densities consistent with dipolar, quadrupolar, and higher excitations). The increased fields near the metal particle are a result of the optical cross-section of particles being larger than their physical cross-section. This effect does not occur for organic fluorophores, which limits the magnitude of their optical cross-sections.
In this paper, we use the finite-difference time-domain (FDTD) method [11-20] to model how a radiating fluorophore interacts with an isolated, spherical silver nanoparticle. The fluorophore is taken to be a point dipole source in the near field of the nanoparticle. A realistic model for silver is used that allows for plasmon excitations. The resulting angular distributions of the emission for the fluorophore in various orientations relative to the nanoparticle are examined. We consider several different nanoparticle sizes and distances of the fluorophore from the nanoparticle. Parallel and normal orientations of the fluorophore’s radiating dipole moment relative to the nanoparticle surface are also examined. Where appropriate, we compare the fluorescence emission scattering with the scattering that results from plane waves of identical wavelength. The plane-wave case corresponds to the well-known Mie scattering by a sphere [21,22], and we also validate our FDTD calculations by finding good agreement with Mie theory predictions. In the case of the fluorophore dipole being parallel to the metal surface, for small (20 nm) and large (320 nm) diameter nanoparticles, we find that the spatial distribution of the scattered fluorescence emission is comparable to that of scattered plane waves of the identical wavelength and polarization. For an 80 nm diameter nanoparticle, however, we find the fluorescence scattering to occur predominantly back in the direction of the fluorophore. This is in stark contrast to Mie scattering. We find that the degree of backscattering of the fluorescence by the nanoparticle is dependent on the distance of the fluorophore from its surface. The largest far-field scattered intensity, however, is found to occur when the fluorophore’s dipole is oriented normal to the surface.
It should be noted that both exact [23,24] and quasistatic limit [25,26] analytical solutions have also been developed for the light scattering dipole/spherical metal nanoparticle problem that we treat numerically here. Impressive manipulations with these solutions have been successfully used to predict, for example, how fluorophore radiative lifetimes are altered by the presence of the metal. However, the actual expressions for the electromagnetic fields are highly complex and unwieldy. For example, we are unaware of any explicit evaluations of the near-field intensity patterns around the nanoparticles using any of these solutions. A rigorous computational electrodynamics method, such as the FDTD method used here, has the advantage that it is very straightforward to determine the complete electromagnetic field and to construct any desired near-field or far-field quantity. It is also possible to consider, with no significant increase in effort, alternative shapes and configurations that are not as amenable to analytical treatment. Surprisingly, to the best of our knowledge, our study appears to be the first FDTD simulation of a fluorophore interacting with a metal nanoparticle.
Finally it is important to note that our main goal is to elucidate the nature of scattering of near-field fluorescence from the surface of a metal nanoparticle. To this end we deliberately performed separate calculations for various fixed orientations of the fluorophore relative to the nanoparticle and considered a variety of different system parameters. Of course in some actual experiments, e.g., experiments involving colloidal solutions, orientational averaging effects can arise that would prevent observation of some of the features seen here. Section 2 gives further details of the calculations, and Section 3 presents our results. Section 4 summarizes our conclusions.
2. COMPUTATIONAL DETAILS
Figure 1 is a schematic of the system studied. A spherical, silver nanoparticle is placed at the origin, and the fluorophore is placed some distance along the negative x axis. It is assumed the excitation stage of fluorescence has occurred and the fluorophore is now emitting radiation. We model this radiating fluorophore as an oscillating, point dipole. We consider z, y, and x dipole polarizations and examine the resulting angle-resolved scattered light intensity in the x-y plane. This particular choice of planes for measuring the scattering is motivated by typical fluorescence polarization experiments. The z- and y-polarized dipoles are parallel to the metal surface, and the x-polarized dipole is normal to the metal surface. In fluorescence polarization experiments involving such parallel dipoles, one can associate the z-polarized case with what is termed vertical polarization and the y-polarized case with what is termed horizontal polarization. (While the x-y plane angular intensities are different for z and y polarizations, by symmetry they can of course be thought of as different cuts of the scattered intensity from one specific parallel-oriented dipole.)
Fig. 1.
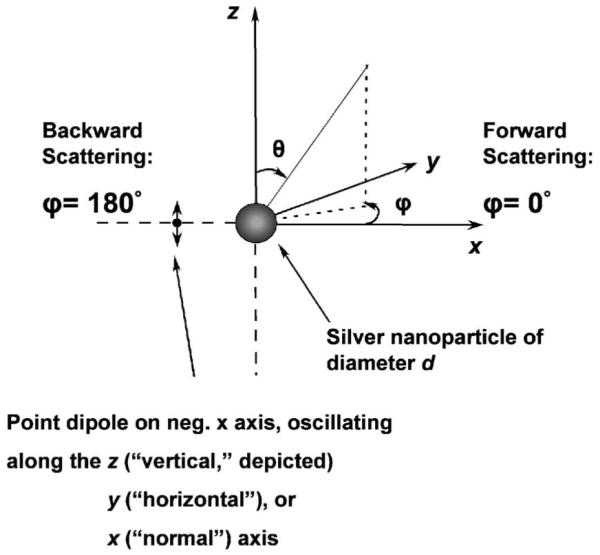
Schematic of the model radiating fluorophore/metal nanoparticle system studied.
Three-dimensional FDTD simulations [11-20] were performed using the program fdtd solutions (version 5.0) from Lumerical Solutions, Inc. (Vancouver, Canada). A time-windowed dipole source, radiating at a fixed wavelength of 420 nm, was used to mimic the emission of a commercially available fluorophore, Alexa Fluor 405 (AF 405), from Invitrogen (Carlsbad, California). This is a soft source, to allow backscattered radiation to pass through it [13]. We also carried out analogous FDTD calculations but with a time-windowed plane-wave source to generate angular distributions and optical cross-sections for comparison with Mie theory [21,22] predictions. Mie theory results were obtained with the program miecalc from Simuloptics (Schwabach, Germany).
Typically the durations of our simulations were 200 fs, corresponding to an excess of 20,000 time propagation steps for each calculation. The FDTD package employed has frequency domain monitors that perform discrete Fourier transforms of the time domain fields while the simulation is running. In this manner, continuous wave (cw) information is obtained at any prespecified wavelengths for the various electric and magnetic field components. These fields can then be projected onto the far field to obtain the angular distributions.
All of the calculations were done assuming a background relative dielectric constant of 1.0. The auxiliary differential equations method [11] was used to implement a realistic, frequency-dependent, and lossy dielectric model for the silver nanoparticle. At 420 nm, the main wavelength of interest, it is equivalent to a metallic dielectric constant of approximately -5.5+0.22i, in good agreement with an interpolation of the empirical results of Johnson and Christy [27].
The simulations were performed on a PC with the following components: AMD Athlon 64 FX Dual Core processor, 2.78 GHz, 1.15 MB cache, 2 MHz bus speed, and 4 GB RAM. All postprocessing of FDTD data was performed using matlab (version 7.0) from Mathworks (Natick, Massachusetts), and sigmaplot (version 9.0) from Systat Software Inc. (San Jose, California).
3. RESULTS AND DISCUSSION
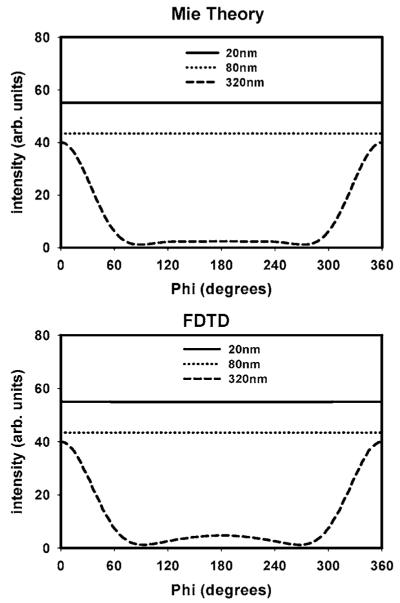
To verify the accuracy of our FDTD simulations, as well as for comparison with our dipole/nanoparticle results, we first consider plane-wave scattering by silver nanoparticles with diameters d=20, 80, and 320 nm. Figure 2 shows results for vertically (z)-polarized incident light with λ0=420 nm. For a small d=20 nm nanoparticle Mie theory predicts essentially symmetrical scattering around the z axis (top). This is understandable because the particle size is much smaller than the incident wavelength, and the particle acts as a simple dipole. The FDTD simulation gave the same symmetrical distribution of the scattered light. The d=80 nm particle also gave a similar result for both Mie theory and FDTD.
Fig. 2.
Angular distribution of light scattered around the z axis (along the x-y plane) by silver nanoparticles calculated by both FDTD and Mie theory. Incident polarization is vertical (along the z axis). The incident wavelength throughout is 420 nm. Note: The intensity of the scattered radiation for 20 and 80 nm nanoparticles is 6 and 2 orders of magnitude lower, respectively, than that of the 320 nm particle, and has been offset for clarity of presentation.
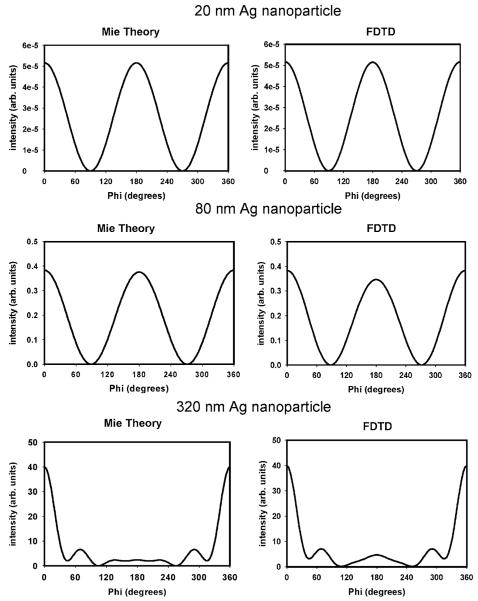
Next we considered scattering by a d=320 nm nanoparticle. In this case the light is preferentially scattered in the forward direction, which corresponds to angles near 0° or 360° in our system (Fig. 2, top). The FDTD simulations gave essentially the same spatial distributions (bottom). The light is not scattered symmetrically about the z axis because this larger nanoparticle is not in the electrostatic limit and the field distributions in and around the particle are more complex than a simple dipole. It should be noted that the magnitude of the scattered radiation for the d=20 nm particle is 6 orders of magnitude lower than that of the 320 nm particle, and the magnitude of the scattered radiation for the d=80 nm particle is 2 orders of magnitude lower than that of the 320 nm particle. Hence the 20 and 80 nm particle data have been deliberately offset for clarity of presentation of all the data in one graph. We also calculated the scattering spatial distribution with horizontally (y)-polarized illumination (Fig. 3). For a small 20 nm nanoparticle, the scattered light follows a cos2 ϕ distribution about the z axis (top). The zero intensities at 90° and 270° reflect the fact that a dipole does not radiate along its optical axis. A similar result also occurs for the 80 nm nanoparticle (middle). For the larger 320 nm nanoparticle, the light is again preferentially forward scattered in all cases (bottom).
Fig. 3.
Angular distribution of light scattered around the z axis (in the x-y plane) by silver nanoparticles calculated using the FDTD method and Mie theory. Incident polarization is horizontal (along the y axis). The incident wavelength throughout is 420 nm.
We should note that the level of agreement between the analytical (Mie theory) and FDTD results in Figs. 2 and 3 is good, but not perfect. In principle, FDTD calculations will converge to the exact analytical result as the grid resolution is refined. However, refining the grid resolution by a factor of 2, say, corresponds to an overall factor of 16 increase in computational time when both the increased number of spatial grid points and time grid points are considered. There is also an eightfold increase in computer memory. For our calculations, we employed a grid spacing of 2 nm for the d=20 nm sphere and a grid spacing of 4 nm for the d=80 and 320 nm sphere, which generally resulted in 10%-20% agreement with the analytical theory. We should note that metal nanoparticle problems are particularly difficult to converge owing to the abrupt and large field changes that occur across the boundaries of the particles and associated staircasing errors. (The spherical particle is approximated as a conglomeration of cubes, resulting in a jagged, staircaselike metal surface/air boundary.) It is likely, particularly for the smallest particle considered, that grid spacings of 1 or 0.5 nm or smaller are required to achieve convergence to within 5% or better (see, e.g., an FDTD study of metal nanowires [28]), which is a level of convergence and numerical effort that is unnecessary for our purposes. This agreement between Mie theory and our FDTD simulations for scattered light validates our results.
We determined extinction cross-sections over a range of wavelengths using the FDTD method and found them to agree well with the corresponding Mie theory predictions (results not shown). For reference, we comment briefly on the corresponding spectral structures, which are correlated with surface plasmon resonances. For d=20 nm, there is a simple plasmon resonance at 370 nm with FWHM of ∼40 nm. In this small particle limit, absorption dominates the extinction. For d=80 nm, the plasmon resonance is redshifted to 400 nm and is broader, with FWHM=70 nm. In this case the scattering and absorption components equally contribute to the extinction. Finally, for d=320 nm, scattering dominates and a more complex, broad spectral structure exists with peaks at 420, 520, and 900 nm.
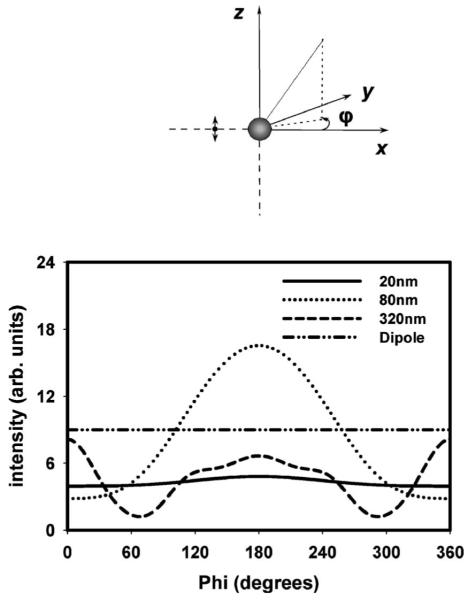
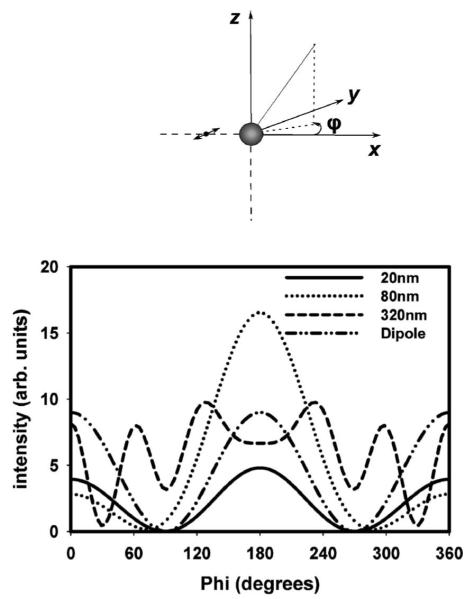
We now turn to the case of a fluorophore, treated as an oscillating dipole, interacting with a silver nanoparticle in the near field. We consider the fluorophore to be positioned on the negative x axis and 10 nm away from the metal surface (see Fig. 1). In Figs. 4 and 5 the dipole is oriented along the z and y axes, respectively, i.e., the dipole is oriented parallel to the metal surface, and in Fig. 6 the dipole is oriented along the x axis, i.e., the dipole is oriented perpendicular to the metal surface. We depict in these figures the angular distributions associated with the oscillating dipole in both the presence and absence of the different sized nanoparticles. While the scattering intensity is given in arbitrary units, note that all the FDTD calculations were done in a similar manner so that the magnitudes of the intensities both within a given FDTD figure and across different FDTD figures can be compared. However, these intensities may not reflect the quantum yield of the system.
Fig. 4.
Intensity distribution for a vertical fluorophore (oriented along the z axis) alone and near different sized silver nanoparticles calculated using the FDTD method. A value of φ=180° is the direction from the nanoparticle back to the fluorophore.
Fig. 5.
Intensity distribution for a horizontal fluorophore (oriented along the y axis) alone and near different sized silver nanoparticles calculated using the FDTD method. A value of φ=180° is the direction from the nanoparticle back to the fluorophore.
Fig. 6.
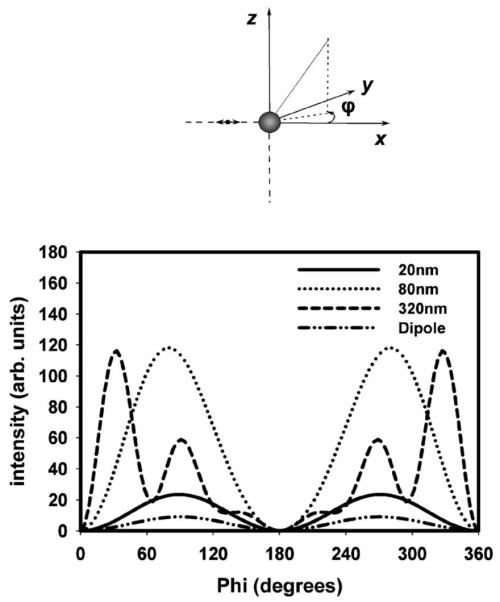
Intensity distribution for a normal fluorophore (oriented along the x axis) alone and near different sized silver nanoparticles calculated using the FDTD method. A value of φ=180° is the direction from the nanoparticle back to the fluorophore.
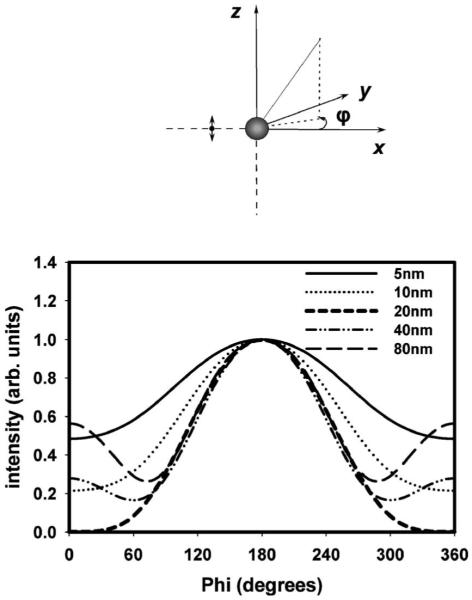
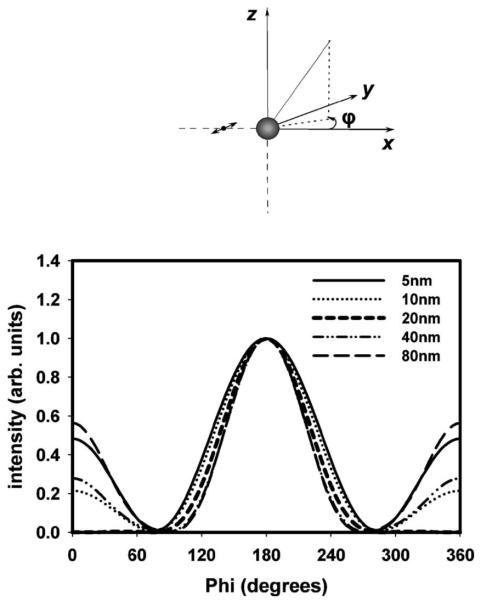
For horizontal orientations and the 20 nm nanoparticle (Fig. 5), the spatial distribution of the scattered emission is comparable to that of scattered plane waves. For this small nanoparticle and vertical fluorophore orientation (Fig. 4), the emission was mostly symmetrical around the z axis, but there was a small increase in emission back in the direction of the fluorophore, which is 180°. For the horizontal orientation (Fig. 5), the emission closely approximates the cos2 ϕ distribution, but again with a slight excess intensity back toward the fluorophore. For the normal fluorophore orientation (x axis) (Fig. 6), the scattered emission from the 20 nm particle shows almost identical spatial distribution to that of the isolated dipole with a peak at 90° and 270°, which is expected, and zero emission at 0°, 180°, and 360°, which is also expected as the dipole does not radiate along its optical axis. It is interesting to note that for most scattering angles the 20 nm silver particle shows suppression of fluorescence (quenching) for both the vertical and the horizontal polarizations of the fluorophore. This can be expected for the 20 nm particle as it is highly absorbing, thus leading to quenching of fluorescence. The 320 nm particle, on the other hand, shows fluorescence suppression (quenching) primarily for the vertical oriented fluorophore. More interesting results are found for a fluorophore near a d=80 nm silver nanoparticle. We have calculated the surface plasmon resonance for the d=80 nanoparticle to be close to 400 nm (data not shown). Of the three particle sizes considered, the 80 nm particle plasmon resonance wavelength is the closest to the fluorophore’s emission wavelength (420 nm), and so one might expect to observe some scattering enhancements and altered directionality. In this case, for both the vertical and horizontal polarizations, the emission is strongly directed back toward the fluorophore and enhanced in many of the scattering angles (Figs. 4 and 5). The extent of directionality is quite strong with a major fraction of the emission in the direction of the fluorophore.
Although the normally oriented fluorophore (x-axis polarization) does not show the preferential backscattering due to the symmetry of this configuration, it is very interesting for a separate reason (Fig. 6). It is clear from these calculations that we consistently observe a much stronger enhancement in the intensity of the scattered emission compared to the parallel dipole orientations of Figs. 4 and 5. For the case of the scattered emission from the 20 nm nanoparticle, we see an approximately 2.5-fold enhancement (when compared to the normally oriented isolated dipole). For the 80 nm nanoparticle the enhancement increases to approximately 13-fold, and its total scattered intensity is the greatest of all the particle sizes considered, consistent with the approximate matching of its plasmon wavelength with the dipole emission wavelength. The greatly enhanced intensity of the normal dipole orientation is easily understood from the perspective of the addition of the fluorophore’s dipole, and the induced dipole in the nanoparticle: this configuration allows the dipoles to align along the x axis head to tail, leading to a much larger effective radiating dipole than in the parallel orientation cases.
Another interesting phenomenon is observed when the distance of the fluorophore from the surface of the silver nanoparticle is varied. Figure 7 shows the normalized scattered emission intensity distribution around a d=80 nm silver nanoparticle from a vertically oriented fluorophore located at distances of s=5, 10, 20, 40, and 80 nm, respectively, where s is the distance along the x axis between the fluorophore and the metal surface. It is interesting to see that the degree of backscattered emission increases from s=5-10 nm and peaks at s=20 nm before decreasing at higher distances. By highest degree of backscattered emission we mean that the angular scattered intensity profile at s=20 nm is centered only around one peak (i.e., 180°), which has the lowest FWHM value, i.e., the majority of the scattered radiation is centered at ∼φ=180°.
Fig. 7.
Normalized scattered emission distribution for a vertical fluorophore (oriented along the z axis) at different distances, s, from the surface of a d=80 nm silver nanoparticle calculated using FDTD. A distance of s=20 nm (bold) shows the highest degree of backscattering.
A similar result for varying the fluorophore position is obtained for calculations involving a horizontally polarized fluorophore at different distances from the surface of the 80 nm particle (Fig. 8). We again observed that the degree of backscattered fluorescence increases from s=5-10 nm and peaks at s=20 nm before decreasing at higher distances. The regions between s=5-20 nm from the metal surface are of particular importance because it is the region where most biological assays will be implemented. These results suggest that the presence of metal nanoparticles in contact or in close proximity to fluorophores creates scattering conditions that can fundamentally alter the characteristic emission pattern of a free space fluorophore (isotropic emission around its dipole axis). Although the cases studied here are simplistic, they were the logical starting point for performing calculations that can provide insight into the nature of fluorescence emission scattered from the surface of metallic nanoparticles. Additional calculations are currently underway involving more complex nanostructures including arbitrary shaped nanoparticles such as triangles and squares, nanoparticle clusters (aggregates), patterned nanostructures such as gratings, and arrays of nanoparticles. The results of these calculations will be reported in due course.
Fig. 8.
Normalized scattered emission distribution for a horizontal fluorophore (oriented along the y axis) at different distances, s, from the surface of an 80 nm silver nanoparticle calculated using FDTD. A distance of s=20 nm (bold) shows the highest degree of backscattering.
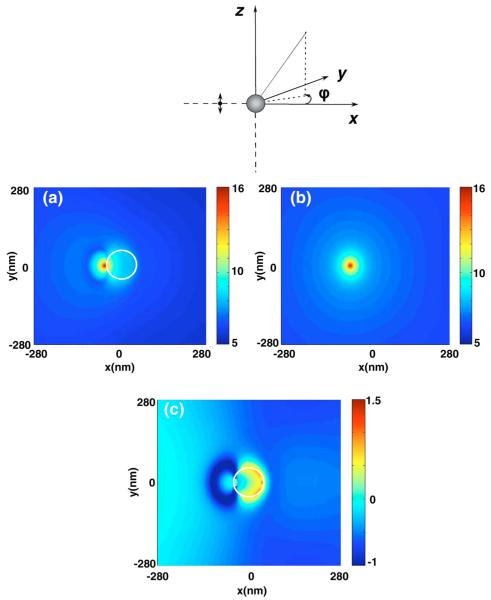
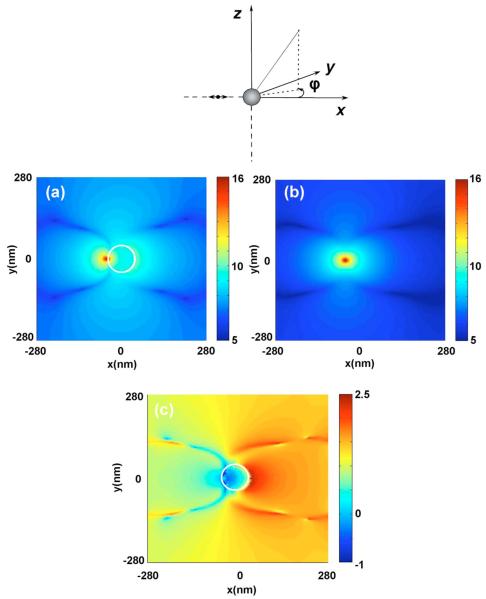
All of the results shown thus far have been for far-field scattering of the fluorescence from the nanoparticles. It is also instructive to examine the electromagnetic near-field distributions. Figure 9(a) shows the electric field intensity in the x-y plane around an 80 nm silver nanoparticle separated 10 nm from a vertically (z axis) oriented fluorophore or emitting dipole. For comparison, Fig. 9(b) shows the intensity around an isolated fluorophore (or oscillating dipole). We have verified, as might be expected, that this latter intensity is very similar to the near field of a hertz dipole [29]. Figure 9(c) is an image of the near-field enhancement and quenching that is generated by dividing the intensity with the nanoparticle by the intensity of the isolated fluorophore. The images are displayed in the logarithmic scale (base 10) for clarity of presentation. The areas in Fig. 9(c) that correspond in the color map to negative values are areas where we see quenching of the fluorophore’s near field, and areas that correspond to positive values are areas where we see enhancements in the near field. It is interesting to observe that the near field is not enhanced between the particle and the dipole, but the intensity has a crescentlike distribution on the opposite side [Fig. 9(c)]. This indicates that there is near-field enhancement only around one side on the nanoparticle. On the side of the nanoparticle facing the fluorophore, there is quenching of the field. We also examined the near fields for a fluorophore oriented normal to the surface of the d=80 nm particle (along the x axis), Figs. 10(a)-10(c). The near-field enhancements in Fig. 10(c) are much higher than the vertical dipole orientation case [note Fig. 10(c) is on a scale that is an order of magnitude larger than that of Fig. 9(c)] and, while somewhat more complex, still show the largest enhancement for the far or distal side of the particle relative to the dipole. Such spatial variations in the near-field enhancements are not easily inferred from the far-field information such as the scattered light angular distributions and thus provide additional insight into the nature of metal enhanced fluorescence.
Fig. 9.
(Color online) Near-field intensity distribution around (a) a d=80 nm silver nanoparticle separated s=10 nm from the surface of a vertical fluorophore (oriented along the z axis) calculated using the FDTD method, (b) near-field intensity distribution around the isolated fluorophore, and (c) near-field enhancement and quenching. The white circle denotes the boundary of the nanoparticle. Note all images are displayed on a log scale.
Fig. 10.
(Color online) Near-field intensity distribution around (a) a d=80 nm silver nanoparticle separated s=10 nm from the surface of a normal fluorophore (oriented along the x axis) calculated using the FDTD method, (b) near-field intensity distribution around the isolated fluorophore, and (c) near-field enhancement and quenching. The white circle denotes the boundary of the nanoparticle. Note all images are displayed in the log scale.
4. CONCLUDING REMARKS
We presented a detailed computational study of light scattering using a radiating fluorophore as the light source, when the fluorophore is in the vicinity of a metal nanoparticle. The FDTD method was used and a realistic model for silver, allowing for surface plasmon excitations, was studied.
Several interesting results emerged from our work. First, the far-field resulting angular distributions of the scattered fluorescence emission, viewed in a plane relevant to fluorescence polarization experiments, can be quite different from what results from plane-wave (Mie) scattering. In particular for metal nanoparticles with surface plasmon wavelength close to the emitting fluorophore’s wavelength (the d=80 nm diameter case in our study), enhanced emission can occur at some angles. For parallel fluorophore orientations relative to the metal surface a strong preferential backscattering effect is seen. The strongest fluorescence, however, results when the fluorophore’s dipole is oriented normal to the metal surface. Finally, inspection of intensity patterns reveals how, in the near field, very specific regions of the nanoparticle can experience field enhancements. This type of result is not easily inferred from far-field observations and is relevant to potential applications that would involve spatially resolved molecular spectroscopy or detection using fluorescence.
In the future we plan to study the interaction of more complex metallic nanostructures with fluorophores using the computational modeling approach presented here. This should enable the rational design of nanostructures and devices that can make use of the metal enhanced fluorescence and related phenomena.
ACKNOWLEDGMENTS
This work was supported by the National Center for Research Resources (grant RR008119), National Human Genome Research Institute (NHGRI) (grant HG002655), National Institutes of Health (NIH) (grant GM070929), and National Institute of Biomedical Imaging and Bioengineering (NIBIB) (grants EB000682 and EB0065211). Partial salary support to C. D. Geddes, K. Aslan, and J. R. Lakowicz from University of Maryland Biotechnology Institute (UMBI) is also acknowledged. S. K. Gray was supported by the Office of Basic Energy Sciences, Division of Chemical Sciences, Geosciences, and Biosciences, U.S. Department of Energy, under contract DE-AC02-06CH11357. The authors also thank Joel Gersten for sharing his insights on the mechanism of metal fluorophore interactions during many discussions.
Footnotes
OCIS codes: 300.6280, 240.6680, 290.4020, 290.5850.
REFERENCES
- 1.Medintz IL, Udeya HT, Goldman ER, Mattoussi H. Quantum dot bioconjugates for imaging, labeling and sensing. Nat. Mater. 2005;4:435–446. doi: 10.1038/nmat1390. [DOI] [PubMed] [Google Scholar]
- 2.Zorov DB, Kobrinsky E, Juhasova M, Sollott SJ. Examining intracellular organelle function using fluorescent probes. Circ. Res. 2004;95:239–252. doi: 10.1161/01.RES.0000137875.42385.8e. [DOI] [PubMed] [Google Scholar]
- 3.McQuade DT, Pullen AE, Swager TM. Chem. Rev. Vol. 100. Washington, D.C.: 2000. Conjugated polymer-based chemical sensors; pp. 2537–2574. [DOI] [PubMed] [Google Scholar]
- 4.Zhao D, Swager T. Sensory responses in solution versus solid state: a fluorescence quenching study of poly(iptycenebutadiynylene)s. Macromolecules. 2005;38:9377–9384. [Google Scholar]
- 5.Aslan K, Lakowicz JR, Geddes CD. Metal-enhanced fluorescence using anisotropic silver nanostructures: critical progress to date. Anal. Bioanal. Chem. 2005;382:926–933. doi: 10.1007/s00216-005-3195-3. [DOI] [PMC free article] [PubMed] [Google Scholar]
- 6.Aslan K, Leonenko Z, Lakowicz JR, Geddes CD. Annealed silver-island films for applications in metal-enhanced fluorescence: interpretation in terms of radiating plasmons. J. Fluoresc. 2005;15:643–654. doi: 10.1007/s10895-005-2970-z. [DOI] [PMC free article] [PubMed] [Google Scholar]
- 7.Zhang J, Gryczynski I, Gryczynski Z, Lakowicz JR. Dye-labeled silver nanoshell—bright particle. J. Phys. Chem. B. 2006;110:8986–8991. doi: 10.1021/jp057032z. [DOI] [PMC free article] [PubMed] [Google Scholar]
- 8.Fu Y, Lakowicz JR. Enhanced fluorescence of Cy5-labeled DNA tethered to silver island films: fluorescence images and time-resolved studies using single-molecule spectroscopy. Anal. Chem. 2006;78:6238–6245. doi: 10.1021/ac060586t. [DOI] [PMC free article] [PubMed] [Google Scholar]
- 9.Ray K, Badugu R, Lakowicz JR. Distance-dependent metal-enhanced fluorescence from Langmuir-Blodgett monolayers of alkyl-NBD derivatives on silver island films. Langmuir. 2006;22:8374–8378. doi: 10.1021/1a061058f. [DOI] [PMC free article] [PubMed] [Google Scholar]
- 10.Lakowicz JR. Radiative decay engineering 5: metal-enhanced fluorescence and plasmon emission. Anal. Biochem. 2005;337:171–194. doi: 10.1016/j.ab.2004.11.026. [DOI] [PMC free article] [PubMed] [Google Scholar]
- 11.Taflove A, Hagness SC. Computational Electrodynamics: the Finite-Difference Time-Domain Method. Artech House; 2000. [Google Scholar]
- 12.Sullivan DM. Electromagnetic Simulation Using the FDTD Method. IEEE; 2000. [Google Scholar]
- 13.Taflove A, Brodwin ME. Numerical solution of steady-state electromagnetic scattering problems using the time-dependent Maxwell’s equations. IEEE Trans. Microwave Theory Tech. 1975;23:623–630. [Google Scholar]
- 14.Yee KS. Numerical solution of initial boundary value problems involving Maxwell’s equations in isotropic media. IEEE Trans. Antennas Propag. 1966;AP-14:302–307. [Google Scholar]
- 15.Yang P, Liou NK. Light scattering by hexagonal ice crystals: comparison of finite-difference time domain and geometric optics models. J. Opt. Soc. Am. A. 1995;12:162–176. [Google Scholar]
- 16.Yang P, Liou NK. Finite-difference time domain method for light scattering by small ice crystals in three-dimensional space. J. Opt. Soc. Am. A. 1996;13:2072–2085. [Google Scholar]
- 17.Prather DW, Shi S. Formulation and application of finite-difference time domain method for the analysis of axially symmetric diffractive optical elements. J. Opt. Soc. Am. A. 1999;16:1131–1142. [Google Scholar]
- 18.Guiffaunt G, Mahdjoubi K. A parallel FDTD algorithm using the MPI library. IEEE Antennas Propag. Mag. 2001;43:94–103. [Google Scholar]
- 19.Berenger JP. A perfectly matched layer for the adsorption of electromagnetic waves. J. Comput. Phys. 1994;114:185–200. [Google Scholar]
- 20.Reference Guide for FDTD Solutions Release 5.0. 2007 http://www.lumerical.com/fdtd.
- 21.Bohren CF, Huffman DR. Absorption and Scattering of Light Particles. Wiley-Interscience; 1983. [Google Scholar]
- 22.Mie G. Beitrage zur optik truber medien, speziell kolloidaler metallosungen. Ann. Phys. 1908;25:377–445. [Google Scholar]
- 23.Chew H, Kerker M, Cooke DD. Electromagnetic scattering by a dielectric sphere in a diverging radiation field. Phys. Rev. A. 1977;16:320–323. [Google Scholar]
- 24.Ruppin R. Decay of an excited molecule near a small metal sphere. J. Chem. Phys. 1982;76:1681–1684. [Google Scholar]
- 25.Gersten J, Nitzan A. Electromagnetic theory of enhanced Raman scattering by molecules adsorbed on rough surfaces. J. Chem. Phys. 1980;73:3023–3037. [Google Scholar]
- 26.Ford GW, Weber WH. Electromagnetic interactions of molecules with metal surfaces. Phys. Rep. 1984;113:195–287. [Google Scholar]
- 27.Johnson PB, Christy RW. Optical constants of the noble metals. Phys. Rev. B. 1972;6:4370–4379. [Google Scholar]
- 28.Gray SK, Kupka T. Propagation of light in metallic nanowire arrays: finite-difference time-domain studies of silver cylinders. Phys. Rev. B. 2003;68 045415. [Google Scholar]
- 29.Shadowitz A. The Electromagnetic Field. Dover; 1988. [Google Scholar]


