

Abstract
The neuropeptide galanin (GAL) is widely expressed in the central nervous system. Animal studies have implicated GAL in alcohol abuse and anxiety: chronic ethanol intake increases hypothalamic GAL mRNA; high levels of stress increase GAL release in the central amygdala. The coding sequence of the galanin gene, GAL, is highly conserved and a functional polymorphism has not yet been found. The aim of our study was, for the first time, to identify GAL haplotypes and investigate associations with alcoholism and anxiety. Seven single-nucleotide polymorphisms (SNPs) spanning GAL were genotyped in 65 controls from five populations: US and Finnish Caucasians, African Americans, Plains and Southwestern Indians. A single haplotype block with little evidence of historical recombination was observed for each population. Four tag SNPs were then genotyped in DSM-III-R lifetime alcoholics and nonalcoholics from two population isolates: 514 Finnish Caucasian men and 331 Plains Indian men and women. Tridimensional Personality Questionnaire harm avoidance (HA) scores, a dimensional measure of anxiety, were obtained. There was a haplotype association with alcoholism in both the Finnish (P=0.001) and Plains Indian (P=0.004) men. The SNPs were also significantly associated. Alcoholics were divided into high and low HA groups (≥ and < mean HA of population). In the Finns, haplotype (P < 0.0001) and diplotype (P < 0.0001) distributions differed between high HA alcoholics, low HA alcoholics and nonalcoholics. Our results from two independent populations suggest that GAL may contribute to vulnerability to alcoholism, perhaps mediated by dimensional anxiety.
Keywords: single-nucleotide polymorphism, linkage disequilibrium, haplotype, galanin, alcoholism, anxiety
Introduction
The neuropeptide galanin (GAL) is widely expressed in the central nervous system (CNS), including limbic areas regulating emotionality,1 the peripheral nervous system and the endocrine system. GAL has wide-ranging effects: it inhibits glucose-induced insulin release and reduces levels of serotonin (5HT), nor-epinephrine (NE) and acetylcholine through the inhibition of adenylate cyclase and phosphatidyl inositol hydrolysis;2 in contrast, it stimulates prolactin and growth hormone release.3 GAL has thus far been implicated in several physiological functions including food intake, pain control, neuroendocrine regulation, cardiovascular regulation, sleep and cognition. A few recent animal studies have shown that GAL is involved in behaviors such as anxiety, depression, and excessive ethanol consumption.
GAL coexists with 5HT in dorsal raphe neurons and NE in locus coeruleus (LC) neurons. It modulates the electrical activity in these two systems and plays a role in the release of 5HT and NE, two neurotransmitters involved in the regulation of mood.4–6 The LC is activated by a variety of stressors, both intrinsic and extrinsic, resulting in increased NE release in CNS regions implicated in the regulation of emotionality such as the prefrontal cortex, the amygdala and the hippocampus.7 The majority of LC neurons express GAL in addition to NE.8 GAL exerts an inhibitory effect on LC neurons by depressing the firing rate.9,10
A recent study of the central amygdala has shown that, while mild stress did not alter GAL levels, a model of high stress (e.g. the administration of yohimbine, an α2 adrenoceptor antagonist, which increases release of NE) did increase GAL release.11 Other studies of centrally administered GAL in rats12 and of GAL overexpressing transgenic mice13,14 appear to support the view that GAL may modulate behavioral responses to significant stress (i.e. high levels of noradrenergic activation in the central amygdala), but may remain dormant under conditions of mild stress.15
Variation in GAL release in limbic brain regions may be associated with stress-related behaviors such as alcoholism. Stress is likely to be important in alcoholism not only in the initiation and maintenance of heavy drinking but also as a risk factor for relapse.16,17 Many parts of the limbic system and limbic cortex are important in alcohol abuse, with much attention focused on dopamine (DA) in the nucleus accumbens (NAc). Both hypothalamic injection of GAL and systemic ethanol increase DA release in the NAc.18 Ethanol intake increases GAL mRNA expression in the rat hypothalamus,19 whereas GAL injected into the third ventricle or the hypothalamus increases ethanol consumption in rats that have learned to drink alcohol at moderate levels.20,21 This suggests the possibility of a positive feedback loop between GAL and alcohol intake.22
The gene encoding preprogalanin, GAL, localized on chromosome 11q13.2,23 is 7.5 kb in length. It encodes a 156-amino-acid precursor peptide that is proteolytically processed to generate the 30-amino-acid peptide, GAL (29 amino acids in rodents). Few GAL human association and linkage studies have been reported and none have positive findings.24,25 There are no published association studies between GAL and alcoholism or anxiety in humans.
From the foregoing discussion, however, it seems likely that there may be a relationship between GAL and alcoholism and anxiety. There are no known GAL functional polymorphisms, and because the amino-acid sequence of GAL is highly conserved (almost 90% across species Vrontakis et al.26), it is unlikely that there will be highly abundant polymorphisms. Owing to the lack of putative functional GAL variants, we undertook comprehensive haplotype-based analyses in this study to look for associations between GAL, alcoholism and anxiety. We first identified GAL haplotype structure in five populations. We then determined a single-nucleotide polymorphism (SNP) panel (tag SNPs) that maximized GAL haplotype information content, and, finally, we used tag SNPs to investigate GAL haplotype associations with alcoholism and anxiety in two ethnically distinct population isolates.
Materials and methods
Control populations
A total of 65 unrelated individuals of differing ethnicity were genotyped to determine GAL haplotype structure: US Caucasians, Finnish Caucasians, African Americans, Southwest American Indians and Plains American Indians. Informed consent was obtained according to human research protocols approved by the human research committees of the recruiting institutes, including the National Institute on Alcohol Abuse and Alcoholism (NIAAA), National Institute of Mental Health (NIMH), Rutgers University and University of Helsinki. All participants had been psychiatrically interviewed and none had a DSM-III-R psychiatric disorder.
Association study participants
Plains American Indians
Ascertainment
Volunteers (135 men and 196 women, total 331) were recruited from a Plains Indian tribe living in rural Oklahoma. Probands were initially ascertained at random from the tribal register, and the families of alcoholic probands were extended. Although most participants derived from one large, multigenerational pedigree, the average sharing of descent between any two individuals was only 0.3%. Individuals were required to have a minimum of 25% Plains Indian ancestry (at least one grandparent) in order to be included on the tribal register (a legal document in which the validated ancestors of tribal members are documented in considerable detail). Most participants had a high percentage of Indian ancestry, and it was calculated that the average Plains Indian ancestry in this sample was 87%. Written informed consent was obtained according to a human research protocol approved by the human research committee of the NIAAA, NIH. The protocol and consent forms were also approved by the Plains Indian Tribal Council. The mean ages were: women, 44.2 years, s.d. = 14.8; men, 41.5 years, s.d. = 12.9.
Psychiatric diagnoses
Blind-rated DSM-III-R lifetime psychiatric diagnoses27 were derived from the Schedule for Affective Disorders and Schizophrenia-Lifetime Version (SADS-L; Endicott and Spitzer28). An additional criterion for alcohol dependence, drinking heavily for a year or more, was incorporated to establish a clear pattern of long-term alcohol use. A clinical social worker (BA) experienced in the tribal customs and culture conducted the SADS-L interviews and obtained a Lifetime Drinking History.29
The successfully genotyped final study sample was comprised of 193 alcoholics (98 men, 95 women) and 138 nonalcoholics (37 men and 101 women). Nearly all the 193 alcoholics had a diagnosis of dependence; only eight had alcohol abuse. There were 38 individuals with lifetime DSM-III-R anxiety disorders, 84% of whom had phobic disorder, 12% had obsessive-compulsive disorder and 5% had panic disorder. Comorbidity between alcoholism and lifetime DSM-III-R disorders was as follows: anxiety disorders, 19% in women and 14% in men; major depression (MD), 29% in women and 11% in men; antisocial personality disorder (ASPD), 10% in women and 29% in men; smoking ≥10 cigarettes/day, 41% in women and 64% in men; and drug dependence, 13% in women and 26% in men. The main drugs of dependence were cannabis and amphetamines (Table 1). Comorbidity in nonalcoholics is given in Table 1.
Table 1.
Comorbidity in nonalcoholics and alcoholics with high and low HA: Plains American Indians
| Men |
Women |
|||||
|---|---|---|---|---|---|---|
| Nonalcoholics | Alcoholics High HA |
Alcoholics Low HA |
Nonalcoholics | Alcoholics High HA |
Alcoholics Low HA |
|
| N | 36 | 54 | 32 | 92 | 58 | 26 |
| Age (years) | 39.6±16.5 | 43.8±10.6 | 40.1±12.4 | 45.0±16.8 | 44.3±12.1 | 41.4±12.8 |
| Age onset heavy drinking (years) | 20.1±5.9 | 19.7±5.2 | 22.2±7.1 | 20.2±5.6 | ||
| HA | 10.3±4.9 | 15.8±2.9 | 7.9±2.8 | 13.1±5.9 | 17.8±4.9 | 7.5±2.4 |
| NS | 14.2±4.6 | 14.9±4.6 | 14.4±4.4 | 12.7±4.0 | 13.9±3.9 | 12.2±3.8 |
| % smokers | 45 | 65 | 61 | 34 | 40 | 44 |
| % ASPD | 0 | 23 | 38 | 1 | 5 | 19 |
| MD | 3 | 11 | 12 | 7 | 31 | 23 |
| % anx dis | 0 | 16 | 12 | 7 | 19 | 19 |
| % drug dep | 0 | 20 | 35 | 0 | 16 | 8 |
TPQ subscales: HA = harm avoidance; NS = novelty seeking.
High HA defined as ≥mean HA of population, taken as mean of nonalcoholics, that is, ≥12.
Low HA defined as < mean HA of population, taken as mean of nonalcoholics, that is, < 12.
MD = DSM-III-R lifetime major depression; anx dis = DSM-III-R lifetime anxiety disorders; ASPD = DSM-III-R lifetime antisocial personality disorder. Smokers defined as smoking ≥10 cigarettes/day.
Drug dependence (drug dep): cannabis 69%, amphetamine 33%, cocaine 10%, opioids 7% and sedatives 12%. Several individuals had multiple drug dependence.
In this study, the terms ‘alcohol use disorders’, ‘alcoholism’ and ‘alcoholics’ include DSM-III-R abuse and dependence.27 It should be noted that in the alcoholics, diagnoses of anxiety disorders were made only if they pre-dated the onset of heavy drinking (as determined by the alcoholic).
Finnish Caucasians
Ascertainment
The Finnish population is regarded as an isolate founded around 2000 years ago. The sample from Helsinki, Finland, has been described in detail elsewhere.30,31 In total, 514 men were genotyped: 263 alcoholics and 251 nonalcoholics. The sample comprised 174 incarcerated alcoholic criminal offenders, 146 relatives (89 alcoholic) and 194 population controls. Although some individuals were related, the average sharing of descent between any two individuals was only 0.2%. Of the alcoholics, 214 had alcohol dependence and 49 had alcohol abuse. Mean ages were: alcoholics, 34.4 years (s.d. = 10.4); nonalcoholics: 33.1 years (s.d. = 12.0).
Written informed consent was obtained according to human research protocols approved by the human research committees of NIAAA and NIMH, NIH, the Department of Psychiatry, University of Helsinki, and the University of Helsinki Central Hospital, Helsinki, Finland.
Psychiatric diagnoses
The Structured Clinical Interview for DSM-III-R (SCID)32,33 was administered by psychiatrists to both alcoholics and controls and blind-rated DSM-III-R psychiatric diagnoses were obtained. Individuals with major psychotic episodes were excluded. Comorbidity between alcoholism and lifetime DSM-III-R disorders was: anxiety disorders, 10%; MD, 13%; ASPD, 45%; and drug dependence, 15%. The main drugs of dependence were cannabis and sedatives (Table 2). Comorbidity in nonalcoholics is given in Table 2.
Table 2.
Comorbidity in nonalcoholics and alcoholics with high and low HA: Finnish Caucasian men
| Nonalcoholics | High HA alcoholics |
Low HA alcoholics |
|
|---|---|---|---|
| N | 244 | 205 | 38 |
| Age (years) | 31.9±11.1 | 34.2±9.5 | 35.5±14.3 |
| Age onset heavy drinking (years) |
20.9±5.8 | 22.6±8.9 | |
| HA | 11.0±5.3 | 19.3±5.2 | 7.4±2.3 |
| Novelty seeking | 15.8±4.3 | 19.1±4.6 | 17.9±5.2 |
| % ASPD | 0 | 46 | 39 |
| % MD | 3 | 14 | 5 |
| % anxiety disorders | 6 | 12 | 3 |
| % drug dependence | 1 | 17 | 5 |
TPQ subscales: harm avoidance, novelty seeking.
High HA defined as ≥ mean HA of population, taken as mean of nonalcoholics, that is, ≥11.
Low HA defined as < mean HA of population, taken as mean of nonalcoholics, that is, < 11.
MD = DSM-III-R lifetime major depression; ASPD = DSM-III-R lifetime antisocial personality disorder.
Drug dependence: sedatives 75%, cannabis 41% and stimulants 16%. Several individuals had multiple drug dependence.
Dimensional measures of personality
In accordance with our hypothesis that there may be a relationship between GAL, alcoholism and anxiety, harm avoidance (HA) scores were derived from the Tridimensional Personality Questionnaires (TPQ)34 that were completed by both Plains Indians and the Finnish Caucasians. HA is a dimensional measure of the tendency to be anxious and fearful. Individuals who have high HA have been categorized as cautious, tense, apprehensive, worriers, fearful, shy and inhibited.34 The TPQ has been widely validated and HA has been shown to be moderately (40–60%) heritable.35 HA scores were normally distributed in both samples. In addition, we obtained TPQ novelty seeking scores to determine whether they differed between alcoholics with high and low HA (Tables 1 and 2).
Genotyping
A panel of seven equally spaced common SNPs ( > 0.05 frequency) was selected from a commercial database (Celera Discovery System (CDS)) to cover the 7.5 kb gene region plus 2 kb upstream and 2.5 kb downstream (Figure 1, Table 3).
Figure 1.

GAL LD matrix in African-Americans (a); US Caucasians and Finnish Caucasians (b); and Plains Indians and Southwestern Indians (c). A schematic of the gene is given in the middle of each panel with lines indicating the positions of the seven SNPs. The eight exons are represented by rectangles. Each box represents D’, % linkage disequilibrium (LD) between SNP pairs, as generated by Haploview (Whitehead Institute for Biomedical Research, USA). Boxes without numbers represent complete LD; D’ = 100%. SNP IDs are public database rs numbers. *The tag SNPs for this gene region.
Table 3.
Locations and allelic frequencies of seven GAL SNPs in 65 individuals from US Caucasians, Finnish Caucasians, African Americans, Plains Indians and Southwest Indians
| No. | SNP ID (CDS) |
SNP ID (NCBI) |
Variation | Position (CDS) |
Location | Allelic frequency (for allele 2) |
||||
|---|---|---|---|---|---|---|---|---|---|---|
| US Caucasians |
Finnish Caucasians |
African Americans |
Plains Indians |
Southwest Indians |
||||||
| 1a | hCV1514991 | rs4930241 | G > A | 65 785 125 | 5′ intergenic | 0.79 | 0.83 | 0.50 | 0.80 | 0.90 |
| 2a | hCV8760774 | rs694066 | G > A | 65 789 599 | Intron 4 | 0.09 | 0.05 | 0.28 | 0.07 | 0.04 |
| 3 | hCV1492278 | rs1546309 | C > T | 65 791 296 | Intron 5 | 0.82 | 0.87 | 0.75 | 0.83 | 0.91 |
| 4a | hCV1492277 | rs3136540 | G > A | 65 793 024 | Intron 7 | 0.18 | 0.13 | 0.28 | 0.19 | 0.09 |
| 5a | hCV1514993 | rs3136541 | G > A | 65 794 557 | Intron 7 | 0.75 | 0.82 | 0.46 | 0.57 | 0.86 |
| 6 | hCV1514997 | rs3136544 | G > A | 65 796 276 | 3′ intergenic | 0.25 | 0.17 | 0.57 | 0.44 | 0.14 |
| 7 | hCV1514999 | rs2513304 | C > A | 65 797 758 | 3′ intergenic | 0.22 | 0.17 | 0.28 | 0.19 | 0.09 |
SNP positions are from the Celera Discovery System (CDS) database, September 2004.
Identifies tag SNPs used in the Finnish and Plains Indian association studies.
Genomic DNA was extracted from lymphoblastoid cell lines, diluted to a concentration of 5 ng/μl. Aliquots (2 μl) were dried in 384-well plates. Genotyping was performed by the 5′ exonuclease method36 using fluorogenic allele-specific probes. Oligonucleotide primer and detection probe sets were designed based on gene sequence from the CDS (Table 4). A measure of 2.5 μl of PCR Master Mix (Applied Biosystems, CA, USA), containing AmpliTaq Gold® DNA Polymerase, dNTPs, Gold Buffer and MgCl2, were mixed with 900 nM of each forward and reverse primer and 100 nM of each reporter and quencher probe in each reaction well. DNA was allowed to stand at 50°C for 2 min and at 95°C for 10 min, amplified by 40 cycles at 95°C for 15 s and 60°C for 1 min, and then held at 4°C. PCR was carried out with a GeneAmp PCR system 9700 (Applied Biosystems). Allele-specific signals were distinguished by measuring end point 6-FAM or VIC fluorescence intensities at 508 and 560 nm, respectively, and genotypes were generated using Sequence Detection System Software Version 1.7 (Applied Biosystems, CA, USA). Genotyping error rate was directly determined by regenotyping 25% of randomly chosen samples for each SNP. The overall error rate was < 0.005. Genotype completion rate was 0.98. All genotype frequencies conformed to Hardy—Weinberg equilibrium.
Table 4.
Primer and probe sequences for 5′ nuclease genotyping of seven GAL SNPs
| SNP | Primers and probes | Sequences |
|---|---|---|
| 1 | Forward primer Reverse primer Allele 1 probe (FAM) Allele 2 probe (VIC) |
TGCCGACCTCAGGAAACC GGGAAGGCTACAGACAAGCAA TTCAGGCCACTGCC CCTTCAGACCACTGCC |
| 2 | Forward primer Reverse primer Allele 1 probe (FAM) Allele 2 probe (VIC) |
GCTATCCAAAAGCACATGCATTGTT CCTGGAGCCTATGCTGAATGG CATGCCGGGAAAG CCATGCCAGGAAAG |
| 3 | Forward primer Reverse primer Allele 1 probe (FAM) Allele 2 probe (VIC) |
TCCTTTGTCTGGCCTTGTAGATG CCTCTGTGTTTCCAGCTGGTT CAGTCCACCCAGGCC ACAGTCCACTCAGGCC |
| 4 | Forward primer Reverse primer Allele 1 probe (FAM) Allele 2 probe (VIC) |
TTCTGTCTTTCTTGCATCTCAAAGGT GGCCTTTTACGTTTCCAGTGTACTA ATGTTAAGTTGGTGATATT TGAATGTTAAGTTGATGATATT |
| 5 | Forward primer Reverse primer Allele 1 probe (FAM) Allele 2 probe (VIC) |
ACTGCCAGAGAAGGTCTTGGA ACTTGGTGACTCGGTTTTGAGATT TAATGAACACCGCCTTT TCTAATGAACACCACCTTT |
| 6 | Forward primer Reverse primer Allele 1 probe (FAM) Allele 2 probe (VIC) |
GGAGGTGGTTTCCCAGTTTCC GGCTCTGTGCCCCTTGA CTGCCTAAGGCCTGTT CTGCCTAAGACCTGTT |
| 7 | Forward primer Reverse primer Allele 1 probe (FAM) Allele 2 probe (VIC) |
CCTTGTCTAAACCTTGCCTTCCTTT CACTTCCTTTCCCTCACCTTCTG ACCTGCCCCACTCC CCTGCCACACTCC |
Statistical analyses
The fraction of genes shared between any two individuals by common descent was calculated for all relative pairs in both populations using SAGE. The average sharing of descent was only 0.3% in the Plains Indians and 0.2% in the Finnish Caucasians; this is less than the degree of relationship between second cousins once removed and third cousins, and indicates that most pairs of individuals in these two populations have a very low degree of relationship. We were therefore able to undertake analyses that assume independence of individuals. The Finnish Caucasians are regarded as a population isolate with little or no admixture. The average Plains Indian ancestry in our sample was 87% (s.d. 21%); however, the median and modal values were 100%. Any admixture was predominantly with other American Indian tribes, among whom genetic diversity is low.37 Therefore, population stratification is highly unlikely to be an issue in our analyses.
Allelic associations or linkage disequilibrium (LD) (D’) matrices were computed across the seven SNPs using Haploview version 2.04 Software (White-head Institute for Biomedical Research, USA). A D’ value of ≥0.8 was considered strong LD to reflect the somewhat arbitrary nature of such D’ cutoffs. A single haplotype block was identified. Within the block, haplotypes were generated; haplotype and diplotype frequencies were estimated using a Bayesian approach implemented with PHASE.38 The results from PHASE closely agreed with results from a maximum-likelihood method (MLOCUS) implemented via an expectation-maximization (EM) algorithm.39
Analysis of variance (ANOVA) was employed to compare HA scores across groups. Allele, genotype, haplotype and diplotype frequencies were compared using the χ2 distribution.
Phylogenic analysis
The sequence conservation at the location of the seven GAL SNPs plus 10 bp at both sides was extracted using the UCSC Genome Browser (http://genome.ucsc.edu/) for human, chimp, mouse, rat and dog DNA. The joint alignments were displayed with Jalview.40
Results
The seven GAL SNPs were polymorphic in all populations and interpopulation differences in allele frequencies were observed for most of the SNPs (Table 3). In general, allele frequencies were similar within both Caucasian populations. Likewise, apart from SNPs 5 and 6, there was little variation between the two American Indian tribes. A single haplotype block spanning GAL (at least 12 kb in all populations) was observed (Figure 1). In the GAL haplotype block region, D’ averaged 82, 93, 90, 98 and 98 in the African Americans, US Caucasians, Finnish Caucasians, Plains Indians and Southwest Indians, respectively. Perhaps more importantly, the median D’ values within those five populations’ haplotype blocks were 79, 94, 93, 100 and 100, respectively, meaning that most of the SNPs were in very high LD. The greatest heterogeneity is to be expected in African Americans, the population studied with the highest contribution from the ancestral African population, and indeed this proved to be the case; there was some disruption of LD within the haploblock in African Americans (Figure 1).
Haplotype frequencies in the five control populations are shown in Table 5. For each population, two to five common (≥0.05) haplotypes accounted for most of the total: 76% of African-American haplotype diversity and 92–98% of the two Caucasian and two American Indian populations’ haplotype diversity. The number of common (≥0.05) haplotypes in the region genotyped were: 5, 4, 4, 4 and 2 for African Americans, US Caucasians, Finnish Caucasians, Plains Indians and Southwest Indians, respectively. For each population, a smaller group of tag SNPs sufficient to maximize genetic information content within the GAL region was selected from the larger panel of seven SNPs. The required number of tag SNPs varies according to the haplotype diversity of the region (and population) and the information content of the SNPs available. For GAL, a total of four tag SNPs (SNPs 1, 2, 4 and 5) was generated by the SNPTagger program41 and used to investigate the association between GAL and alcoholism/anxiety in Finnish Caucasians and Plains Indians.
Table 5.
Frequencies of haplotypes derived from seven GAL SNPs in 65 individuals from US Caucasians, Finnish Caucasians, African Americans, Plains Indians and Southwest Indians
| Haplotype | Frequency |
|||||
|---|---|---|---|---|---|---|
| US Caucasians | Finnish Caucasians | African Americans | Plains Indians | Southwest Indians | ||
| A | 2121211 | 0.70 | 0.74 | 0.39 | 0.54 | 0.86 |
| B | 2121121 | 0.05 | 0.05 | 0.06 | 0.25 | 0.04 |
| C | 1112122 | 0.09 | 0.08 | 0.06 | 0.11 | 0.06 |
| D | 1212122 | 0.08 | 0.05 | 0.16 | 0.08 | 0.03 |
| E | 1121121 | 0.00 | 0.00 | 0.08 | 0.00 | 0.00 |
There were four common haplotypes ( > 5% frequency) generated by the four tag SNPs (Table 6). Haplotype A was most abundant in both populations. Haplotype B differed by only one allele from haplotype A. Haplotypes C and D differed by only one allele from each other. Thus, haplotypes A and B derived from the same ancestral haplotype and similarly haplotypes C and D originated from a common ancestral haplotype (Table 6). Therefore, it was considered rational to analyze haplotypes A and B together as one group and haplotypes C and D together as another group where necessary because of small cell sizes.
Table 6.
(a—c) Frequencies of haplotypes derived from GAL tag SNPs (1,2, 4 and 5) in nonalcoholics and alcoholics
| Haplotype | Nonalcoholics (N-Alc) |
Alcoholics (Alc) |
|||||||
|---|---|---|---|---|---|---|---|---|---|
| N | Frequencies |
N | Frequencies |
||||||
| All N-Alc | All N-Alc | High HA | Low HA | All Alc | All Alc | High HA | Low HA | ||
| Finnish men | |||||||||
| A | 2112 | 390 | 0.80 | 0.78 | 0.83 | 430 | 0.85 | 0.86 | 0.81 |
| B | 2111 | 19 | 0.04 | 0.05 | 0.03 | 30 | 0.06 | 0.05 | 0.14 |
| C | 1121 | 50 | 0.10 | 0.10 | 0.09 | 44 | 0.09 | 0.09 | 0.05 |
| D | 1221 | 29 | 0.06 | 0.07 | 0.04 | 4 | 0.00 | 0.00 | 0.00 |
| Total N | 488 | 262 | 226 | 508 | 410 | 75 | |||
| Plains Indian men | |||||||||
| A | 2112 | 42 | 0.59 | 0.56 | 0.64 | 131 | 0.70 | 0.69 | 0.72 |
| B | 2111 | 14 | 0.20 | 0.22 | 0.14 | 42 | 0.22 | 0.22 | 0.19 |
| C | 1121 | 12 | 0.17 | 0.15 | 0.19 | 12 | 0.06 | 0.06 | 0.08 |
| D | 1221 | 3 | 0.04 | 0.07 | 0.02 | 4 | 0.02 | 0.03 | 0.01 |
| Total N | 71 | 27 | 42 | 189 | 107 | 64 | |||
| Plains Indian women | |||||||||
| A | 2112 | 127 | 0.69 | 0.70 | 0.70 | 112 | 0.65 | 0.61 | 0.71 |
| B | 2111 | 35 | 0.19 | 0.20 | 0.17 | 36 | 0.21 | 0.22 | 0.21 |
| C | 1121 | 16 | 0.09 | 0.08 | 0.11 | 12 | 0.07 | 0.09 | 0.04 |
| D | 1221 | 5 | 0.03 | 0.02 | 0.02 | 12 | 0.07 | 0.08 | 0.04 |
| Total N | 183 | 90 | 87 | 172 | 115 | 51 | |||
The given haplotype frequency is for the group of four common haplotypes that represent 93–98% of total haplotype diversity.
High HA = high harm avoidance, defined as ≥mean of nonalcoholics, that is, ≥11 (Finns) and ≥12 (Plains Indians).
Low HA = low harm avoidance, defined as < mean of nonalcoholics, that is, < 11 (Finns) and < 12 (Plains Indians). Harm avoidance scores were not available for a few individuals.
Haplotype and diplotype associations with alcoholism in men
There was a haplotype association with alcoholism in both the Finnish and Plains Indian men (Finns: χ2 = 23.4, 3 df, P < 0.001; Plains Indians: χ2 = 8.0, 3 df, P=0.045). Haplotypes A and B, differing only by SNP 5 alleles, were more common in alcoholics, whereas haplotypes C and D, differing only by SNP 2 alleles, were more common in nonalcoholics (Table 6, Figure 2). We compared haplotypes (A + B) with (C + D) across alcoholics and nonalcoholics (Finns: χ2 = 10.2, 1 df, P=0.001; Plains Indians: χ2 = 8.2, 1 df, P=0.004).
Figure 2.
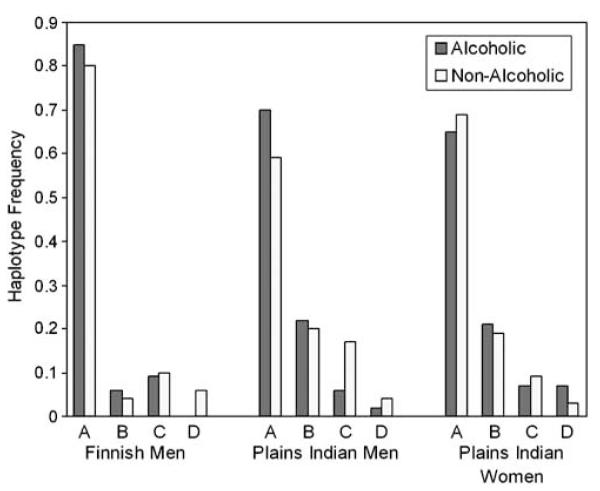
Differences in GAL haplotype frequencies between alcoholics and nonalcoholics. χ2 comparisons across all four haplotypes: Finnish men, n=996, P < 0.001; Plains Indian men, n=263, P=0.045; and Plains Indian women, n=357, P=0.254.
In the Finnish men, there was a significant association between the eight available diplotypes and alcoholism (χ2 = 27.8, 7 df, P=0.002). There were four common (≥5%) diplotypes (AA, AB, AC and AD) that accounted for 97% of the available diplotypes. The frequency of each common diplotype in alcoholics and nonalcoholics is given in Table 7; diplotypes AA and AB were more abundant in alcoholics, whereas diplotypes AC and AD were more abundant in nonalcoholics (χ2 = 20.5, 3 df, P=0.0001). Both diplotypes AA and AB contributed to the significant effect when compared with diplotypes AC and AD: AA vs (AC + AD), χ2 = 8.4, 1 df, P=0.004; AB vs (AC + AD), χ2 = 8.0, 1 df, P=0.005.
Table 7.
(a—c) Frequencies of common GAL (≥5%) diplotypes in nonalcoholics and alcoholics
| Nonalcoholics (N-Alc) |
Alcoholics (Alc) |
|||||||
|---|---|---|---|---|---|---|---|---|
| N | Frequencies |
N | Frequencies |
|||||
| Diplotype | All N-Alc | All N-Alc | High HA | Low HA | All Alc | All Alc | High HA | Low HA |
| Finnish men | ||||||||
| AA | 149 | 0.68 | 0.63 | 0.73 | 172 | 0.74 | 0.77 | 0.65 |
| AB | 14 | 0.06 | 0.08 | 0.05 | 24 | 0.11 | 0.08 | 0.26 |
| AC | 39 | 0.17 | 0.19 | 0.15 | 32 | 0.14 | 0.14 | 0.09 |
| AD | 19 | 0.09 | 0.10 | 0.07 | 3 | 0.01 | 0.01 | 0.00 |
| Total N | 221 | 119 | 101 | 231 | 184 | 35 | ||
| Plains Indian men | ||||||||
| AA | 10 | 0.32 | 0.25 | 0.37 | 41 | 0.49 | 0.52 | 0.52 |
| AB | 9 | 0.29 | 0.42 | 0.21 | 31 | 0.37 | 0.35 | 0.31 |
| AC | 11 | 0.36 | 0.25 | 0.42 | 9 | 0.11 | 0.09 | 0.14 |
| AD | 1 | 0.03 | 0.08 | 0.00 | 3 | 0.03 | 0.04 | 0.03 |
| Total N | 31 | 12 | 19 | 84 | 46 | 29 | ||
| Plains Indian women | ||||||||
| AA | 39 | 0.48 | 0.49 | 0.50 | 35 | 0.48 | 0.40 | 0.59 |
| AB | 25 | 0.31 | 0.33 | 0.25 | 21 | 0.29 | 0.29 | 0.32 |
| AC | 14 | 0.17 | 0.15 | 0.20 | 10 | 0.14 | 0.19 | 0.05 |
| AD | 3 | 0.04 | 0.03 | 0.05 | 7 | 0.09 | 0.12 | 0.04 |
| Total N | 81 | 39 | 40 | 73 | 48 | 22 | ||
The given haplotype frequency is for the group of four common haplotypes that represent 93–98% of total haplotype diversity.
High HA = high harm avoidance, defined as ≥ mean of nonalcoholics, that is, ≥11 (Finns) and ≥12 (Plains Indians).
Low HA = low harm avoidance, defined as < mean of nonalcoholics, that is, < 11 (Finns) and < 12 (Plains Indians).
Harm avoidance scores were not available for a few individuals.
In the Plains Indian men, the seven available diplotypes were likewise significantly associated with alcoholism (χ2 = 13.2, 6 df, P=0.039). The three common (≥5% frequency) diplotypes (AA, AB and AC) accounted for 89% of all diplotypes and their frequencies are given in Table 7. As in the Finns, the frequencies of diplotypes AA and AB were increased in alcoholics, whereas diplotype AC was more abundant in nonalcoholics (χ2 = 9.8, 2 df, P=0.008). Once again, both diplotypes AA and AB contributed to the significant effect when compared with diplotypes AC: AA vs AC, χ2 = 8.6, 1 df, P=0.003; AB vs AC, χ2 = 6.3, 1 df, P=0.012.
Tag SNPs
Allele frequencies differed significantly between alcoholics and nonalcoholics in all four tag SNPs in the Finns (SNP 1: χ2 = 6.2, P=0.013; SNP 2: χ2 = 17.8, P < 0.0001; SNP 4: χ2 = 12.1, P=0.0005; SNP 5: χ2 = 4.9 P=0.027 (all 1 df)), and in tag SNPs 1 and 4 in the Plains Indian men (SNP 1: χ2 = 5.9, P=0.015; SNP 2: χ2 = 0.8, P=0.384; SNP 4: χ2 = 6.7, P=0.0098; SNP 5: χ2 = 2.5 P=0.114 (all 1 df)).
Haplotype and diplotype associations with HA
In the Finnish alcoholics, there was a trend for HA variation between the four common haplotypes: A and B tended to be associated with lower HA (mean HA of A = 17.4±6.4 and B = 17.1±7.2) and haplotypes C and D tended to be associated with higher HA (mean HA of C = 18.7±6.0 and D = 24.0±8.5) (F(1,481) = 2.2, P=0.142). The association between the diplotypes and HA in alcoholics reflected the haplotype relationship (F(1,217) = 3.3, P=0.072). There was no similar haplotype or diplotype association in nonalcoholics (mean HA: A = 10.9±5.3, B = 13.1±7.6, C = 11.3±5.1 and D = 11.8±5.8). There was no significant relationship between haplotypes or diplotypes and HA in the Plains Indians.
Our previous study in these two populations has shown that alcoholics with high HA, defined as ≥ the population mean (taken as the mean HA for nonalcoholics), and low HA, defined as < the population mean, may be distinct subtypes.31 In the current study, we only found a nonsignificant trend for the association of HA with GAL haplotypes and diplotypes in alcoholics. Nevertheless, because our study has no precedent, we decided to pursue exploratory analyses of the HA association. We therefore divided the alcoholics into high and low HA groups, as described previously. Mean (s.d.) HA for nonalcoholics was 11.1 (5.3) in the Finns and 12.1 (5.7) in the Plains Indians. The high HA alcoholics had mean HA scores of 19.1±5.2 (Finns) and 16.9±4.2 (Plains Indians). The low HA alcoholics had mean HA scores of 7.2±2.5 (Finns) and 7.6±2.5 (Plains Indians). High and low HA alcoholics did not differ significantly in the prevalence of ASPD, MD, anxiety disorders, drug dependence, novelty seeking or age of onset of heavy drinking (Tables 1, 2).
In Finns, distribution of the four haplotypes (χ2 = 37.2, 6 df, P < 0.0001) and the four common diplotypes (χ2 = 30.0, 6 df, P < 0.0001) differed between high HA alcoholics, low HA alcoholics and nonalcoholics (Tables 6, 7, Figure 3). High HA alcoholics had an excess of haplotype A and diplotype AA relative to low HA alcoholics and nonalcoholics. Low HA alcoholics were distinguished by a sizeable excess of haplotype B (three-fold) and diplotype AB (four-fold) compared with high HA alcoholics and nonalcoholics (Figure 3). Haplotype D was almost exclusively confined to nonalcoholics. There was no significant difference in haplotype or diplotype distribution between nonalcoholics with high and low HA.
Figure 3.

GAL haplotype and diplotype frequencies in Finnish men: alcoholics with high harm avoidance (HA) ( > mean HA of nonalcoholics), alcoholics with low HA ( < mean HA of nonalcoholics) and nonalcoholics. χ2 comparisons of the three groups across all four haplotypes: n=996, χ2 = 37.2, 6 df, P < 0.0001; and all four diplotypes: n=452, χ2 = 30.0, 6 df, P < 0.0001.
In the Plains Indian men, haplotype and diplotype frequencies did not differ between high HA and low HA alcoholics.
Haplotype/diplotype associations with alcoholism and HA in women
No significant associations were found in the women.
Anxiety disorders
There were no significant associations between haplotypes or diplotypes and anxiety disorders in either population.
Phylogenic analysis of GAL SNPs
Among the seven genotyped SNPs, SNP 1 (rs4930241) showed the highest overall sequence conservation in the nearby region among the five examined species (Figure 4). The sequence conservation surrounding the seven genotyped SNPs decreased from the 5′-end to the 3′-end of GAL. For three genotyped human SNPs (SNP 4 (rs3136540), SNP 5 (rs3136541) and SNP 7 (rs2513304)), both alleles were found in some of the five examined vertebrate species. Therefore, these SNPs might have originated before speciation. In contrast, the corresponding dog sequence for human SNP 3 (rs1546309) is A, which differs from the human C or T alleles.
Figure 4.

Conservation of GAL SNPs across five mammalian species (from top to bottom: human, chimp, mouse, rat, dog). Sequence alignment surrounding SNPs 1–7. The SNP numbers and positions are marked above the aligned sequences for five species. Dashed lines indicate that no sequence is available.
Discussion
Our study is the first to report on the haplotype structure of GAL, and we have done so in five populations. The advantage of haplotype analysis is that disease associations can be narrowed down to regions of LD; therefore, eliminating the requirement for every SNP in that LD block to be genotyped. Since there is as yet no known functional GAL polymorphism, we used a haplotype-based approach to capture potential GAL variation. This approach is highly likely to detect the effects of any allele, known or unknown, of moderate abundance and effect size for areas of the genome with conserved block structure.42
Using a comprehensive panel of four tag SNPs, we found a significant haplotype association with alcoholism in both Finnish Caucasian and Plains American Indian men. This is a robust finding given that the two groups of alcoholics differ in numerous aspects including ethnicity, country of origin, cultural background, socioeconomic status and rural vs urban environment. In addition, the Finnish Caucasian alcoholics were largely incarcerated violent offenders, whereas the Plains Indian alcoholics were derived from the community. In both populations, the two haplotypes A and B, differing by only one allele and therefore originating from a common ancestral haplotype, were risk factors for alcoholism. The other two haplotypes, C and D, also differing by only one allele and also derived from a shared ancestral haplotype, were protective against alcoholism (Figure 2). We were able to acquire further information about this association of GAL haplotypes with alcoholism by investigating potential mediating effects of HA, a measure of anxious temperament. Based on an earlier study in these two populations,43 we defined two subgroups of alcoholics; high HA alcoholics, the majority group, who had a more anxious personality than nonalcoholics, and low HA alcoholics who were less anxious than nonalcoholics. We based our definition around the mean HA of the nonalcoholics in each population rather than on a global mean HA score because differing environmental stressors in each population may modify baseline levels of anxiety. This approach revealed that, in the Finns, it was the high HA alcoholics who had an excess of haplotype A and diplotype AA, whereas haplotype B and diplotype AB were significantly more common in the low HA alcoholics (Figure 3). In contrast, there was no difference in haplotype distribution between nonalcoholics with high and low HA. Therefore, our results suggest a possible mediating effect of anxiety in alcoholics and that high HA and low HA alcoholics may be distinct subtypes.
Although we found a strong association between GAL haplotypes and alcoholism in the Plains Indian men, it did not appear to be influenced by HA as in the Finns. Possible explanations for this include the fact that the sample size was considerably smaller and that environmental influences are likely to be very different in these two populations. Our study indicates that there may be sexual dimorphic effects in the association between GAL and alcoholism. The influence of estrogen on GAL expression may have some bearing on these sex differences.43,44 In addition, environmental stressors influencing excessive alcohol consumption may differ between the sexes and may vary across populations.
Haplotype blocks represent ancient chromosomal regions, undisturbed by recombination, and haplotype frequency variation across populations reflects different exposures to selective pressures, genetic drift and population bottlenecks. The considerable variability in GAL allele and haplotype frequencies across three different ethnicities indicates that it is important to take population stratification into account in association studies. However, we studied two populations that are essentially isolates and so population stratification is unlikely to be an issue in our study.
Our study did not identify a functional locus (loci); therefore, sequencing and subsequent functional studies of GAL are required for this purpose. In order to get preliminary information on the functional potential of the GAL SNPS used in this study, we have correlated their physical location to gene structure using RefSeq Human Genome Build 35 (http://ncbi.nih.gov/genomes/H_sapiens/) and Geno-matix, software for transcription factor binding sites analysis (http://www.genomatix.de/). One potentially interesting finding is that SNP 4 (rs3136540), which was strongly associated with alcoholism both in Finns and Plains Indians, is located within 15 bases of a splicing donor site and therefore might affect the efficiency of splicing.
In conclusion, we have demonstrated an association between GAL haplotypes and alcoholism in two, very different male populations. We distinguished different genetic associations in Finnish alcoholics with high HA and low HA. However, our results should be treated with caution until replicated in other large data sets and by other methods, including family-based association studies. GAL is a candidate gene for pharmacotherapy for stress and stress-induced relapse, and if our results are reproducible in other populations, this finding may be relevant because the two subtypes of alcoholics may have different pharmacotherapeutic responses.
Acknowledgments
We are grateful to Dr Alec Roy for permitting the use of a subset of his African American data set, and to Longina Akhtar and Lori Schwartz for technical assistance. This research was supported in part by the Office of Research on Minority Health and the Intramural Research Programs of the National Institute of Dental and Craniofacial Research and the National Institute on Alcohol Abuse and Alcoholism, NIH.
References
- 1.Jacobowitz DM, Kresse A, Skofitsch G. Galanin in the brain: chemoarchitectonics and brain cartography — a historical review. Peptides. 2004;25:433–464. doi: 10.1016/j.peptides.2004.02.015. [DOI] [PubMed] [Google Scholar]
- 2.Wrenn CC, Crawley JN. Pharmacological evidence supporting a role for galanin in cognition and affect. Prog Neuropsychopharmacol Biol Psychiatry. 2001;25:283–299. doi: 10.1016/s0278-5846(00)00156-1. [DOI] [PubMed] [Google Scholar]
- 3.Crawley JN. Biological actions of galanin. Regul Pept. 1995;59:1–16. doi: 10.1016/0167-0115(95)00083-n. [DOI] [PubMed] [Google Scholar]
- 4.Hokfelt T, Broberger C, Diez M, Xu ZQ, Shi T, Kopp J, et al. Galanin and NPY, two peptides with multiple putative roles in the nervous system. Horm Metab Res. 1999;31:330–334. doi: 10.1055/s-2007-978748. [DOI] [PubMed] [Google Scholar]
- 5.Yoshitake T, Wang FH, Kuteeva E, Holmberg K, Yamaguchi M, Crawley JN, et al. Enhanced hippocampal noradrenaline and serotonin release in galanin-overexpressing mice after repeated forced swimming test. Proc Natl Acad Sci USA. 2004;101:354–359. doi: 10.1073/pnas.0307042101. [DOI] [PMC free article] [PubMed] [Google Scholar]
- 6.Yoshitake T, Reenila I, Ogren SO, Hokfelt T, Kehr J. Galanin attenuates basal and antidepressant drug-induced increase of extracellular serotonin and noradrenaline levels in the rat hippocampus. Neurosci Lett. 2003;339:239–242. doi: 10.1016/s0304-3940(03)00020-x. [DOI] [PubMed] [Google Scholar]
- 7.Charney DS. Psychobiological mechanisms of resilience and vulnerability: implications for successful adaptation to extreme stress. Am J Psychiatry. 2004;161:195–216. doi: 10.1176/appi.ajp.161.2.195. [DOI] [PubMed] [Google Scholar]
- 8.Hokfelt T, Xu ZQ, Shi TJ, Holmberg K, Zhang X. Galanin in ascending systems. Focus on coexistence with 5-hydroxytryptamine and noradrenaline. Ann NY Acad Sci. 1998;863:252–263. doi: 10.1111/j.1749-6632.1998.tb10700.x. [DOI] [PubMed] [Google Scholar]
- 9.Ma X, Tong YG, Schmidt R, Brown W, Payza K, Hodzic L, et al. Effects of galanin receptor agonists on locus coeruleus neurons. Brain Res. 2001;919:169–174. doi: 10.1016/s0006-8993(01)03033-5. [DOI] [PubMed] [Google Scholar]
- 10.Sevcik J, Finta EP, Illes P. Galanin receptors inhibit the spontaneous firing of locus coeruleus neurones and interact with mu-opioid receptors. Eur J Pharmacol. 1993;230:223–230. doi: 10.1016/0014-2999(93)90806-s. [DOI] [PubMed] [Google Scholar]
- 11.Khoshbouei H, Cecchi M, Morilak DA. Modulatory effects of galanin in the lateral bed nucleus of the stria terminalis on behavioral and neuroendocrine responses to acute stress. Neuropsychopharmacology. 2002;27:25–34. doi: 10.1016/S0893-133X(01)00424-9. [DOI] [PubMed] [Google Scholar]
- 12.Bing O, Moller C, Engel JA, Soderpalm B, Heilig M. Anxiolytic-like action of centrally administered galanin. Neurosci Lett. 1993;164:17–20. doi: 10.1016/0304-3940(93)90846-d. [DOI] [PubMed] [Google Scholar]
- 13.Holmes A, Yang RJ, Crawley JN. Evaluation of an anxiety-related phenotype in galanin overexpressing transgenic mice. J Mol Neurosci. 2002;18:151–165. doi: 10.1385/JMN:18:1-2:151. [DOI] [PubMed] [Google Scholar]
- 14.Kuteeva E, Hokfelt T, Ogren SO. Behavioural characterisation of young adult transgenic mice overexpressing galanin under the PDGF-B promoter. Regul Pept. 2005;125:67–78. doi: 10.1016/j.regpep.2004.07.028. [DOI] [PubMed] [Google Scholar]
- 15.Khoshbouei H, Cecchi M, Dove S, Javors M, Morilak DA. Behavioral reactivity to stress: amplification of stress-induced noradrenergic activation elicits a galanin-mediated anxiolytic effect in central amygdala. Pharmacol Biochem Behav. 2002;71:407–417. doi: 10.1016/s0091-3057(01)00683-9. [DOI] [PubMed] [Google Scholar]
- 16.Brady KT, Sonne SC. The role of stress in alcohol use, alcoholism treatment, and relapse. Alcohol Res Health. 1999;23:263–271. [PMC free article] [PubMed] [Google Scholar]
- 17.Breese GR, Chu K, Dayas CV, Funk D, Knapp DJ, Koob GF, et al. Stress enhancement of craving during sobriety: a risk for relapse. Alcohol Clin Exp Res. 2005;29:185–195. doi: 10.1097/01.alc.0000153544.83656.3c. [DOI] [PMC free article] [PubMed] [Google Scholar]
- 18.Rada P, Mark GP, Hoebel BG. Galanin in the hypothalamus raises dopamine and lowers acetylcholine release in the nucleus accumbens: a possible mechanism for hypothalamic initiation of feeding behavior. Brain Res. 1998;798:1–6. doi: 10.1016/s0006-8993(98)00315-1. [DOI] [PubMed] [Google Scholar]
- 19.Leibowitz SF, Avena NM, Chang GQ, Karatayev O, Chau DT, Hoebel BG. Ethanol intake increases galanin mRNA in the hypothalamus and withdrawal decreases it. Physiol Behav. 2003;79:103–111. doi: 10.1016/s0031-9384(03)00110-0. [DOI] [PubMed] [Google Scholar]
- 20.Lewis MJ, Johnson DF, Waldman D, Leibowitz SF, Hoebel BG. Galanin microinjection in the third ventricle increases voluntary ethanol intake. Alcohol Clin Exp Res. 2004;28:1822–1828. doi: 10.1097/01.alc.0000148099.12344.c8. [DOI] [PubMed] [Google Scholar]
- 21.Rada P, Avena NM, Leibowitz SF, Hoebel BG. Ethanol intake is increased by injection of galanin in the paraventricular nucleus and reduced by a galanin antagonist. Alcohol. 2004;33:91–97. doi: 10.1016/j.alcohol.2004.05.002. [DOI] [PubMed] [Google Scholar]
- 22.Thiele TE, Stewart RB, Badia-Elder NE, Geary N, Massi M, Leibowitz SF, et al. Overlapping peptide control of alcohol self-administration and feeding. Alcohol Clin Exp Res. 2004;28:288–294. doi: 10.1097/01.alc.0000113777.87190.9c. [DOI] [PubMed] [Google Scholar]
- 23.Evans H, Baumgartner M, Shine J, Herzog H. Genomic organization and localization of the gene encoding human preprogalanin. Genomics. 1993;18:473–477. doi: 10.1016/s0888-7543(11)80002-9. [DOI] [PubMed] [Google Scholar]
- 24.Kofler B, Lapsys N, Furler SM, Klaus C, Shine J, Iismaa TP. A polymorphism in the 3′ region of the human preprogalanin gene. Mol Cell Probes. 1998;12:431–432. doi: 10.1006/mcpr.1998.0200. [DOI] [PubMed] [Google Scholar]
- 25.Eckenrode S, Marron MP, Nicholls R, Yang MC, Yang JJ, Fonseca LC Guida, et al. Fine-mapping of the type 1 diabetes locus (IDDM4) on chromosome 11q and evaluation of two candidate genes (FADD and GALN) by affected sibpair and linkage-disequilibrium analyses. Hum Genet. 2000;106:14–18. doi: 10.1007/s004399900186. [DOI] [PubMed] [Google Scholar]
- 26.Vrontakis ME, Torsello A, Friesen HG. Galanin. J Endocrinol Invest. 1991;14:785–794. doi: 10.1007/BF03347918. [DOI] [PubMed] [Google Scholar]
- 27.Association AP . Diagnostic and Statistical Manual of Mental Disorders. American Psychiatric Association Press; Washington DC: 1987. revised. [Google Scholar]
- 28.Endicott J, Spitzer RL. A diagnostic interview: the schedule for affective disorders and schizophrenia. Arch Gen Psychiatry. 1978;35:837–844. doi: 10.1001/archpsyc.1978.01770310043002. [DOI] [PubMed] [Google Scholar]
- 29.Skinner HA, Sheu WJ. Reliability of alcohol use indices. The Lifetime Drinking History and the MAST. J Stud Alcohol. 1982;43:1157–1170. doi: 10.15288/jsa.1982.43.1157. [DOI] [PubMed] [Google Scholar]
- 30.Lappalainen J, Long JC, Eggert M, Ozaki N, Robin RW, Brown GL, et al. Linkage of antisocial alcoholism to the serotonin 5-HT1B receptor gene in 2 populations. Arch Gen Psychiatry. 1998;55:989–994. doi: 10.1001/archpsyc.55.11.989. [DOI] [PubMed] [Google Scholar]
- 31.Enoch MA, Albaugh B, Virkkunen M, Goldman D. Anxious temperament mediates linkage of GABRA2 haplotypes with alcoholism. (submitted) [DOI] [PMC free article] [PubMed]
- 32.Spitzer RL, Williams JB, Gibbon M, First MB. The Structured Clinical Interview for DSM-III-R (SCID). I: history, rationale, and description. Arch Gen Psychiatry. 1992;49:624–629. doi: 10.1001/archpsyc.1992.01820080032005. [DOI] [PubMed] [Google Scholar]
- 33.Williams JB, Gibbon M, First MB, Spitzer RL, Davies M, Borus J, et al. The Structured Clinical Interview for DSM-III-R (SCID). II. Multisite test—retest reliability. Arch Gen Psychiatry. 1992;49:630–636. doi: 10.1001/archpsyc.1992.01820080038006. [DOI] [PubMed] [Google Scholar]
- 34.Cloninger CR. A systematic method for clinical description and classification of personality variants. A proposal. Arch Gen Psychiatry. 1987;44:573–588. doi: 10.1001/archpsyc.1987.01800180093014. [DOI] [PubMed] [Google Scholar]
- 35.Heath AC, Cloninger CR, Martin NG. Testing a model for the genetic structure of personality: a comparison of the personality systems of Cloninger and Eysenck. J Pers Soc Psychol. 1994;66:762–775. doi: 10.1037//0022-3514.66.4.762. [DOI] [PubMed] [Google Scholar]
- 36.Shi MM, Myrand SP, Bleavins MR, de la Iglesia FA. High throughput genotyping for the detection of a single nucleotide polymorphism in NAD(P)H quinone oxidoreductase (DT diaphorase) using TaqMan probes. Mol Pathol. 1999;52:295–299. doi: 10.1136/mp.52.5.295. [DOI] [PMC free article] [PubMed] [Google Scholar]
- 37.Mulligan CJ, Hunley K, Cole S, Long JC. Population genetics, history, and health patterns in native Americans. Annu Rev Genomics Hum Genet. 2004;5:295–315. doi: 10.1146/annurev.genom.5.061903.175920. [DOI] [PubMed] [Google Scholar]
- 38.Stephens M, Donnelly P. A comparison of Bayesian methods for haplotype reconstruction from population genotype data. Am J Hum Genet. 2003;73:1162–1169. doi: 10.1086/379378. [DOI] [PMC free article] [PubMed] [Google Scholar]
- 39.Long JC, Williams RC, Urbanek M. An E—M algorithm and testing strategy for multiple-locus haplotypes. Am J Hum Genet. 1995;56:799–810. [PMC free article] [PubMed] [Google Scholar]
- 40.Clamp M, Cuff J, Searle SM, Barton GJ. The Jalview Java alignment editor. Bioinformatics. 2004;20:426–427. doi: 10.1093/bioinformatics/btg430. [DOI] [PubMed] [Google Scholar]
- 41.Ke X, Cardon LR. Efficient selective screening of haplotype tag SNPs. Bioinformatics. 2003;19:287–288. doi: 10.1093/bioinformatics/19.2.287. [DOI] [PubMed] [Google Scholar]
- 42.Gabriel SB, Schaffner SF, Nguyen H, Moore JM, Roy J, Blumenstiel B, et al. The structure of haplotype blocks in the human genome. Science. 2002;296:2225–2229. doi: 10.1126/science.1069424. [DOI] [PubMed] [Google Scholar]
- 43.Shen ES, Meade EH, Perez MC, Deecher DC, Negro-Vilar A, Lopez FJ. Expression of functional estrogen receptors and galanin messenger ribonucleic acid in immortalized luteinizing hormone-releasing hormone neurons: estrogenic control of galanin gene expression. Endocrinology. 1998;139:939–948. doi: 10.1210/endo.139.3.5841. [DOI] [PubMed] [Google Scholar]
- 44.Ponchon M, Lause P, Maiter D. In vitro effects of oestradiol on galanin gene expression in rat anterior pituitary cells. J Neuroendocrinol. 2000;12:559–564. doi: 10.1046/j.1365-2826.2000.00489.x. [DOI] [PubMed] [Google Scholar]