

Abstract
The objective of this study was to develop and demonstrate the utility of a novel method of evaluating intracellular levels of extracellular matrix (ECM) components in intervertebral disc (IVD) cells using flow cytometry. By using this method, this study discriminated between cell populations in porcine IVD and examined the response of IVD cells to monolayer cultures, a traditional method of cell expansion, by measuring phenotypic attributes of ECM component production. It was found that monolayer cultures affected collagen production of IVD cells while there were differences in collagen type II production between the cells isolated from the annulus fibrosus (AF) and nucleus pulposus (NP) regions of IVD. Size distributions of fresh and cultured cells were also presented while the relationships between cell size and intracellular collagen level revealed heterogeneous cell populations in AF and NP regions. Furthermore, this study showed that the intracellular collagen signals of IVD cells were significantly enhanced by the treatments of Brefeldin-A and ascorbic acid. This suggests that Brefeldin-A and ascorbic acid could be used to increase the sensitivity of flow cytometric analysis on intracellular collagen levels by maximizing collagen accumulation inside cells. Since a unique feature of the flow cytometric screening tool is the ability to discriminate between various cell populations in a single sample, the flow cytometric method developed in this study may have the potential to identify specific collagen-producing cell populations from tissues or cell cultures.
Keywords: annulus fibrosus, nucleus pulposus, intracellular collagen, Brefeldin-A, ascorbic acid, colchicine
Introduction
Degeneration of the intervertebral disc (IVD) has been associated with the presentation of back pain, a common but serious disorder with high economic impact from lost work time and medical care costs.2 Considerable research has been undertaken to elucidate the underlying mechanisms and to resolve a strategy for treatment. Despite the growth in knowledge, however, reliable solutions are still elusive. While a surgical approach to fuse vertebrae and relieve pain has had success, it is preferable to realize a less invasive and traumatic procedure to restore the disc function.11 Towards treatment, research in the field of tissue engineering has been moving forward rapidly and promises a biological approach to treat disc degeneration. One solution may be a solid tissue implant that re-establishes the function of the disc.
Since the building blocks for disc tissue are the cells that comprise it, in order to create an implant, a process is first required for obtaining large numbers of disc cells, in optimal condition, that are capable of performing the desired function. The source for these cells may be derived from stem cells or adult chondrocytes24,10 or from primary explants of IVD disc tissue.
The IVD consists of an outer concentric layer of fibrous tissue known as the annulus fibrosis (AF) and a central gelatinous portion, the nucleus pulposus (NP).19 The cell population in the outer annulus is primarily fibroblastic while the cells residing in the inner AF exhibit characteristics of both fibroblasts and chondrocytes.29 At least two distinct cell populations are recognized in the NP in early life: chondrocytic cells and the notochordal cells that are much larger with a vacuolated appearance and contain significant cellular processes and intracellular glycogen.29 Differences in phenotypic expression and extracellular matrix production between the cells from different anatomical regions (i.e., NP and AF) in the IVD have been recognized in the literature.5,6,13,30,16,18 Biomechanical properties of the NP cells as compared with AF or transition zone cells were measured and it was concluded that cells of the NP were approximately three times stiffer and significantly more viscous than cells of the AF or transition zone.12 Therefore, characterization and separation of heterogeneous cell populations in the IVD should be the first step for engineering disc tissue substitutes. A single source (i.e. stem cells) of cellular material reduces this requirement in terms of heterogeneous populations but the need for characterization is still present since it must be shown that the populations remain uniform and possess the traits desired for successful regeneration.
Once IVD cells have been isolated from the native tissue, there is much evidence that phenotypic changes develop, sometimes rapidly. It has been shown that the relative gene expressions for collagen type I and II and aggrecan for relevant monolayer passage numbers (P0-P4) display dramatic changes occurring as early as the first passage.8 In addition to growth factors or drug exposure, the extracellular concentrations of nutrients have a profound effect both on the viability of disc cells and on their ability to produce extracellular matrix.4 Differences in cell phenotype within IVD tissue and the difficulties in maintaining those phenotypes in culture have made the investigation of the effects of various compounds difficult.17 There is a need for markers that determine cell populations from the AF and the NP.3 However, clear phenotypic assays for chondrocytic nucleus pulposus and notochordal cells are essentially non-existent.26
Current cell studies often analyze gene expression as a means of measuring cellular phenotype.6,13,30 However, analytical techniques of gene expression such as reverse transcription–polymerase chain reaction (RT-PCR) only account for the average gene expression response of all of the cells in the sample without resolution of specific heterogeneous populations. Since it is likely that multiple cell populations are found in tissues or cultured cells, the ability to characterize these populations with a single assay represents an improvement on current methods.
The flow cytometric technique could provide such an enhancement to the analysis since it is able to discriminate between various cell populations, especially for IVD in which definitive phenotypes for AF and NP cells remain unclear.23 Flow cytometric analysis of the intracellular presence of collagen protein is advantageous because quantitative biochemical analyses of the collagen composition are made difficult by the highly covalent molecular cross-linking that limits availability.20 Since IVD cells, especially NP cells, are slow in reforming an extracellular matrix (ECM) which is a protective layer rich in proteoglycans and collagen molecules7 on the outer surface of the cell, it often requires a long-term cell culture period to obtain sufficient deposition of the ECM for detection by traditional protein analyses such as histology and western blotting. Normally, these types of studies rely on histological evaluation of the ECM production which adds to the labor cost and reduces the potential sensitivity of the results by increased sample handling. Although flow cytometry was shown to characterize chondrocyte phenotype of cell membrane-associated extracellular matrix antigens,31 that approach relies on careful manipulation of the preparations and considerable variation may be introduced when processing samples on large scales.
Therefore, the objective of this study was to develop a novel method for characterizing IVD cells on a cell by cell basis using flow cytometry. By using flow cytometric analysis, this study examined the response of IVD cells to culture conditions that affect phenotypic attributes of the cells, namely extracellular matrix (ECM) production such as collagen.
Materials and Methods
Isolation and culture procedure for IVD cells
Four morphologically normal lumbar spines were obtained from 4–6 month-old female White pigs within 2 - 8 h of sacrifice (Cabrera Farms, Hialeah, FL). Isolation of cells from the regions of annulus fibrosus (AF) and nucleus pulposus (NP) was performed based on the protocol reported in our previous study.14 Briefly, AF and NP tissues were harvested from five lumbar discs from each spine and the cells were isolated by digesting AF and NP tissues with a collagenase (Worthington Biochemical Corp., Lakewood, NJ) -proteinase (Sigma Chemical, St. Louis, MO) solution overnight at 37 °C at 5% CO2.14 After filtering the digestions by a sterile 70 μm cell strainer (BD Biosciences, Bedford, MA), the cells were recovered by centrifugation and cultured in Dulbecco's Modified Eagle Media (DMEM) medium, supplemented with 10% fetal bovine serum (FBS; Invitrogen Corp., Carlsbad, CA) and 1% antibiotic-antimycotic (Invitrogen Corp.) at 5% CO2 at 37 °C. After reaching confluence, cells were either frozen in FBS with 10% dimethyl sulfoxide for storage in liquid nitrogen or passaged with a 1:3 expansion every 7 days. Cells that were frozen and subsequently thawed for experimentation were cultured in the previously described DMEM.
Flow cytometric analysis of intracellular levels of collagen type I and II
Cells were trypsinized from the tissue culture plates and resuspended in a minimal volume of phosphate buffered solution (PBS) (Beckman Coulter, Inc., Fullerton, CA) containing 2% FBS (PBSF 2%) to inhibit the enzymatic action of the trypsin. AF and NP cells of different passage numbers were examined for size distribution and the presence of intracellular collagen. The four sets of cell preparations examined were fresh cells (2 days after isolation, before plating for long term culture), and cells from the initial growth phase at confluency (P0), passage 1 (P1), and passage 4 (P4) cultures. The passage number refers to the number of times the cells had been trypsinized and either analyzed or subsequently re-seeded and grown to confluence. Each cell suspension (either fresh or cultured cells) was counted on a Vi-Cell™ XR cell viability analyzer (Vi-Cell) (Beckman Coulter, Inc.) to obtain cell number and size distribution. The Vi-Cell is a video imaging system for analyzing cells in culture media that automates the trypan blue dye exclusion method for cell count and viability.
For flow cytometric analysis of intracellular protein levels, the cells were prepared using absolute methanol (Pharmco Products Inc, Brookfield, CT) fixation and permeabilization. Briefly, 100 μL of cell suspension was mixed with 1 ml of cold methanol (-20°C). After an incubation of 15 minutes at 4°C, 2 ml of PBSF 2% was added and the cells were pelleted at 300 g for 5 minutes. The supernatant was removed by aspiration and the cells were suspended in 100 μL of PBSF 2% containing primary antibody or isotypic control and incubated for 15 minutes. After incubation, the cells were washed with 4 ml of PBSF 2% once and incubated with conjugated secondary antibody for 15 minutes in the dark. After washed with PBSF 2%, the cells were suspended in approximately 0.5 ml in PBSF 2% and 0.1% paraformaldehyde. Antibody for collagen type I (ab23446-100; Abcam, Cambridge, MA) is highly specific for the native triple-helical conformation of type I collagen and has no cross reactivity with type II, III, V or VI collagens or the other connective tissue proteins (laminin, fibronectin, and elastin). The antibody highly specific to type II collagen was obtained from Neomarkers (2B1.5 MS-235-P1) and showed no cross-reaction with types I, III, IV, V, VI, IX, X, or XI.
The flow cytometric analysis was performed using a Cytomics FC 500 flow cytometry system (Beckman Coulter, Inc.). The relative fluorescence index (RFI) was chosen as the data measurement method due to its sensitivity to small population shifts in fluorescence values. The RFI was calculated by taking the ratio of the mean fluorescence value obtained from the positive antibody signal to the isotype (nonspecific) control signal.
Treatment of protein transport inhibitors and ascorbic acid
It is well known that protein transport inhibitors such as Brefeldin A and colchicine can increase intracellular accumulation of collagen by inhibiting protein transport 25,9 while ascorbic acid is essential for collagen formation.15 This study also investigated the enhancement of intracellular collagen signals using the treatments of protein transport inhibitors and ascorbic acid.
AF and NP cells that were previously frozen in FBS with 10% dimethyl sulfoxide were thawed and cultured in six-well plates until approximately 80% confluent. The culture conditions were identical during this growth period for all of the cells examined and consisted of Dulbecco's Modified Eagle Media (DMEM) medium, supplemented with 10% fetal bovine serum (FBS; Invitrogen Corp., Carlsbad, CA) and 1% antibiotic-antimycotic (Invitrogen Corp.) at 5% CO2 at 37 °C. A Box-Behnken response surface design was built with Design Expert (version 5.0.8, Stat-Ease, Inc., Minneapolis, MN) to assess the effects of ascorbic acid, Brefeldin A and colchicine on the RFI for collagen type I and II as measured by flow cytometry. The factors and levels are shown in Table 1. Briefly, varying combinations of ascorbic acid (0, 25, 50 μg / ml), Brefeldin A (0, 0.25, 0.5 μg / ml) and colchicine (0, 5, 10 μM) were added to the near confluent cultures and allowed to incubate at 37°C in 5% CO2 for approximately 18 hours. The cells were harvested and analyzed for intracellular collagen (type I and II) by flow cytometry as previously described.
Table 1.
Experimental Design Table for ascorbic acid and protein transport inhibitors
| Factors | Levels | ||
|---|---|---|---|
| Low | Medium | High | |
|
Ascorbic Acid (μg / ml) |
0 | 25 | 50 |
|
Brefeldin A (μg / ml) |
0 | 0.25 | 0.50 |
|
Colchicine (μM) |
0 | 5 | 10 |
Visualization of Intracellular Collagen with Fluorescence Microscopy
To confirm the results seen with the flow cytometer, additional staining was performed and the cells were examined on an Eclipse E-600 upright fluorescence microscope (Nikon Inc., Melville, NY). Frozen and thawed cells were cultured in a 100 mm culture plate and then treated with ascorbic acid and Brefeldin A as previously described. The cells were then examined for type I collagen with the methanol permeabilization method previously described. The cells were visualized on the fluorescent microscope with filters appropriate for the yellow fluorescence emitted by the phycoerythrin fluorochrome.
Data analysis
Two-way ANOVA analysis of variance was performed to examine differences in cell size and collagen level among fresh and cultured cells, and the effect of protein transport inhibitors and ascorbic acid on collagen levels of IVD cells using the program SPSS (SPSS Inc., Chicago, IL). When examining differences in cell size and collagen level among the fresh and cultured cells, the two factors were passage number and region. When examining the effects of each treatment (i.e., transport inhibitors and ascorbic acid) on collagen level, the factors were concentration and region. The post hoc test was Student-Newman-Keuls test.
Results
Size measurements
The freshly isolated AF cells were relatively uniform in size while with culture the P4 AF cells became larger in size and more heterogeneous (Figure 1a). In contrast, the size of the P4 NP cells was uniform while fresh NP cells were larger in size and more heterogeneous (Figure 1b). There was a significant difference in the average size of the fresh AF and fresh NP cells with the NP cells being significantly larger (p<0.001) (Figure 1c) whereas no difference was found in cell size between the P4 NP and P4 AF cells.
Figure 1.

Typical cell size distribution of fresh (a) AF and (b) NP vs. passage 4 (P4) cells. (c) Comparison of cell size between AF and NP cells (n=6). Error bars represent standard deviation.
Flow cytometric analysis of intracellular proteins (collagen type I and II)
Figure 2a shows typical histograms of the isotype (non-specific control) and the specific fluorescence intensity pattern for collagen type II antibody. The shift of the population to the right indicates binding of the specific antibody and an increase in the fluorescence emitted by the cells. Permeabilizing the cells with cold methanol effectively “pokes holes” in the plasma membrane while simultaneously fixing the cell and keeping the main structures intact. This procedure effectively kills the cell and no further work is possible towards any metabolic state requiring active processes. Without permeabilizing the cells, only low level background fluorescence was observed for collagen (Figure 2b), indicating collagen protein staining originated from inside the cells.
Figure 2.

(a) Typical histograms showing non-specific (isotype) and specific (collagen type II) fluorescence patterns for fresh AF cells. (b) Typical histograms showing collagen type II in fresh AF cells with and without permeabilization by methanol.
Figure 3 shows the RFI of flow cytometric analysis for intracellular collagen production of AF and NP cells that were either fresh, P0, P1, or P4 cells from four separate cell isolation experiments. Generally speaking, for AF cells, the collagen type II level was highest in the fresh isolated cells while the collagen type II level decreased as early as P0 culture (Figure 3). Type I collagen level of AF was uniform from sample to sample. For NP cells, a decrease occurred on collagen type II level while an increase in collagen I levels was seen from fresh to P1. At passage 4 the type II collagen level was slightly higher in NP compared to AF cells. However, according to statistical analysis, there was no statistically significant difference between collagen type I levels among the cells (p = 0.71) while the collagen type II level of the fresh AF cells was significantly higher than those of the other cells (p <0.01).
Figure 3.

Intracellular collagen levels depicted by relative fluorescence index analysis of the flow cytometric analysis on freshly isolated and cultured [primary culture (P0) and passage 1 (P1) and 4 (P4)] AF and NP cells from four separate cell isolation experiments (n=6). Error bars represent standard deviation.
When the fresh AF cells were examined for intracellular collagen type II content (Figure 4a), there were two populations in the freshly isolated cells. The AF cells positive for collagen type II were smaller (lower FS) while the larger cells (higher FS) were negative for collagen II. In contrast, the fresh NP cells positive for collagen II are the larger cells present (higher FS) (Figure 4b).
Figure 4.
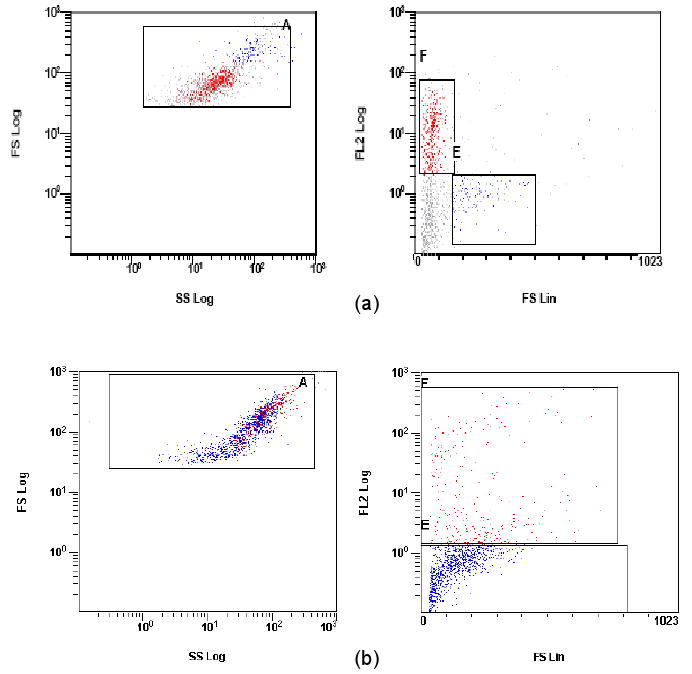
Forward scatter (FS) vs. side scatter (SS) histograms (left side) and fluorescence histograms (right side) for collagen II (FL-2, red) on permeabilized (a) fresh AF cells and (b) NP cells. The larger cells exhibit higher values for forward angle light scatter. Multiple cell populations are evident. In (a), AF cells with larger, high forward scatter value (blue) were not positive for collagen II. In (b), collagen II positive NP cells (red) are high in forward scatter value in contrast to AF cells.
Treatment with protein transport inhibitors and ascorbic acid
Brefeldin-A significantly increased the intracellular contents of collagen type I and collagen type II in NP and AF cells (Figure 5a). Although the only significant increase in intracellular collagen type I level was observed in NP cells with ascorbic acid treatment (Figure 5c), ascorbic acid tends to increase the RFI of both collagens. However, colchicine tended to lower the RFI of collagen type I and II (Figure 5b). Fluorescence staining of type I collagen can be visualized within the cytoplasm of Brefeldin-A treated AF cells under fluorescence microscopy (Figure 6), indicating the presence of intracellular collagen.
Figure 5.

Effects of (a) Brefeldin-A, (b) colchicine, and (c) ascorbic acid concentration on the intracellular levels of type I collagen (C1) and type II collagen (C2) in frozen and thawed passage 1 NP and AF cells (n=6). Error bars represent standard deviation.
Figure 6.

Fluorescence microscopy of intracellular type I collagen in a Brefeldin-A treated AF cell. Fluorescence was located within the cytoplasm indicating the presence of collagen within the cell. Optical magnification: 100X.
Discussion and Conclusions
This study developed a novel flow cytometric analysis to characterize phenotypic expression of IVD cells on a cell by cell basis. This is the first study to measure intracellular collagen level in IVD cells using flow cytometry and to discern multiple cell populations within a single sample. The intracellular measurement of cellular antigens by flow cytometry has been a much utilized technology.28 Shahdadfar and co-workers (2008) demonstrated intracellular measurement of collagen type II in articular cartilage cells.27 Previous to that, no other reports had been noted making ours the first study examining intracellular collagen in IVD cells. Our study includes collagen type I as well as optimization methods using Brefeldin A that improves the sensitivity of this novel approach. This method has the potential to enable the selection of specific IVD cell populations that have the best likelihood for realizing a successful implant.
Fresh and cultured cells demonstrated significant differences in their size distributions when examined with the Vi-Cell analyzer. In the freshly isolated samples, the NP cells were significantly larger than the AF cells while the AF cells displayed a more uniform size distribution as manifested by the fact that the fresh AF cells exhibited a smaller standard deviation compared with fresh NP cells and the P4 cell samples. These results are consistent with an analysis by Chen et al that showed that the immature NP contained a majority of cells that were larger than AF cells.6 The present study however provides a calibrated size distribution of IVD cells by utilizing a micrometer scale on the Vi-Cell analyzer and not just arbitrary units of light scatter mean intensity. The contrast in size between fresh AF and NP cells is eliminated by passage 4 where the cells appear to de-differentiate during culture and the size distributions converge to similar ranges. The average cell size increases for the previously small AF cells while the largest of the cells in the NP cells are no longer present. The resulting cell populations have lost their distinguishing characteristics.
The results demonstrate that type I and type II collagen proteins are identified in both fresh and cultured AF and NP cells. The finding that collagen type II protein expression level was significantly higher in the fresh AF cells than the other cell types agrees with previous studies.21,30 Anatomically, however, it is known that NP contains an amorphous arrangement of proteoglycans in a network of mostly type II collagen, so this result is still somewhat unexpected. Poiraudeau et al. found that IVD cells expressed different levels of collagen type II mRNA while AF and NP cells contained 22% and 8% of collagen type II mRNA, respectively, compared with that found in articular or growth plate chondrocytes from the same animal.21 Wang et al. showed the cells isolated from the transitional zone (i.e., inner AF) of porcine lumbar IVD expressed higher levels of mRNA of collagen type I and II than the cells isolated from the outer AF and NP.30
In the present study, the collagen type II level of monolayer cultured AF cells was significantly lower than that of the fresh AF cells while monolayer culture had no effects on the type I collagen level. These findings are supported by the study of Wang et al., who found that the collagen type II gene expression of AF cells decreased when cultured in monolayer, while monolayer culture exhibited no effect on expression of collagen type I gene in inner AF cells.30
Furthermore, there was more than a single population of cells in freshly isolated AF when examined for intracellular collagen type II. A previous study also indicated different cell populations in porcine AF tissue by showing that the cells isolated from inner (e.g., transitional zone) and outer AF regions exhibited different levels of collagen type II gene expression.30
The NP cells exhibited an increase in collagen type I level and a decrease in collagen type II levels after monolayer culture (e.g., passage 1). This result is similar to those obtained by previous studies, which found that monolayer cultured rabbit NP cells demonstrated a significantly lower gene expression of collagen type II and a higher gene expression of collagen type I1 while significant reduction of collagen type II mRNA level in fresh NP tissues was observed after an initial culture in DMEM.22
Just as cellular responses involved in the progression of degeneration remain poorly understood,3 the purity of IVD cell preparations is not described in detail in many publications where analyses were reported on behavior of AF or NP cells in vitro. The pitfalls of an undefined population arise from various issues. There may be less defined anatomical regions for isolation; subsequently the original cell preparations may be mixed populations with each cell type having a separate influence on the outcome. Additionally, there may be differences in growth rates of isolated cells and the resulting mix may not be representative of the starting material. The methodology described here moves toward better definition of the cells being studied although further work towards identification of a marker is necessary for NP and AF cells.
Brefeldin-A is a fungal toxin widely used to study protein transport along the secretory pathway. Brefeldin-A inhibits protein secretion, collapses the Golgi complex into the endoplasmic reticulum (ER), causes redistribution of processing enzymes normally resident in the Golgi to the ER, and uncouples the proximal and distal regions of the secretory pathway and has been shown to completely block collagen secretion.25 Ascorbic acid is a critical cofactor for production of collagen and was demonstrated to increase the levels of collagen detected by the assay. The study demonstrated that Brefeldin-A and ascorbic acid significantly enhanced the intracellular collagen signal while colchicine lowered RFI of collagen as its concentration increases. A two-dimensional overlay contour plot of RFI of collagen type I and II for the AF and NP cells with treatments of Brefeldin-A and ascorbic acid was generated using Design Expert to determine an optimal combination of treatments (Figure 7). Based on the overlay contour plot, it can be seen that ascorbic acid concentration of approximately 40 μg/ml and Brefeldin-A at 0.4 μg/ml maximize each of the RFI signals of collagen types I and II for AF and NP cells (Figure 7). Therefore, treatments of Brefeldin-A and ascorbic acid with such concentrations can be used to increase the accuracy of flow cytometric analysis on intracellular collagen levels by maximizing collagen accumulation.
Figure 7.

Overlay plot of the responses of the RFI signals for AF and NP cells for collagens type I (C1) and type II (C2). The x-axis represents the Brefeldin-A concentration (μg / ml) and the y-axis, the ascorbic acid concentration (μg / ml). The blue lines represent cutoff regions for each RFI signal associated with C1 or C2 for AF and NP cells. The cutoff regions delineate areas of concentration associated with increased collagen levels. In an optimized response, it is assumed that higher collagen levels are desired (more representative of the in vivo state). The yellow region represents the area of the 2-dimensional response surface graph where the C2 levels are maximized as a result of the response of the cells to Brefeldin-A and ascorbic acid. An ascorbic acid concentration of approximately 40 μg / ml and Brefeldin-A at 0.4 μg / mL optimizes the responses as shown by the yellow area. The colchicine value is held at zero as it was shown to have a negative effect on RFI.
It is recommended that further studies be undertaken to verify that these additives do not adversely affect the cell phenotypes being examined although the impact of the Brefeldin-A is likely to be minimal as it is only added during the final 18 hr of the experiment. The action of Brefeldin-A is such that it interrupts post-translational processing of all proteins by disrupting the Golgi apparatus and essentially freezes the live cell in its current phenotype. In the case of collagen, an extracellular matrix protein, this prevents the protein from leaving the cell thereby increasing the quantity found intracellularly. False positive responses can be minimized by careful selection of reactive antibodies for high purity and specificity. Finally, no work was done to assess the changes brought on by the freezing process alone and it is suggested that studies be carried out if cell freezing evolves as a viable storage mode for implantable cell cultures.
The method was demonstrated to show that the collagen staining was occurring within the cytoplasm of the cells. The results indicate that without permeabilization of the cell no staining for collagen was observed, confirming that the signal being measured originates from collagen protein internal to the cell. There was also no extracellular collagen matrix remaining on the cells that was able to bind the antibody. With cultured AF cell preparations, fluorescence microscopy also confirms the presence of stained collagen within the cytoplasm (Figure 5).
In summary, this study develops a novel flow cytometric method to analyze intracellular collagen levels in IVD cells and to discern multiple cell populations within a single sample. With this new method, it was found that monolayer cultures, a traditional way of cell expansion, affected extracellular matrix production (i.e., collagen) of IVD cells while there were also shown to be differences in collagen type II production between AF and NP cells. The intracellular collagen signals of IVD cells were significantly enhanced by Brefeldin-A and ascorbic acid, which could be used to increase the accuracy of flow cytometric analysis on intracellular collagen levels by maximizing collagen accumulation. Since a unique feature of the flow cytometric screening tool is the ability to determine unique cell populations in a single sample, the method developed in this study can be utilized to accurately characterize cellular material for future tissue engineering studies.
Acknowledgments
The authors would like to thank Mr. Xiaoyi Li and Ms. Liza Laquian for their assistance with cell culture. This study was supported by Grant Number AR050609 from NIH (NIAMS).
References
- 1.Anderson DG, Tannoury C. Molecular pathogenic factors in symptomatic disc degeneration. Spine J. 2005;5:260S–266S. doi: 10.1016/j.spinee.2005.02.010. [DOI] [PubMed] [Google Scholar]
- 2.Andersson GB. Epidemiological features of chronic low-back pain. Lancet. 1999;354:581–585. doi: 10.1016/S0140-6736(99)01312-4. [DOI] [PubMed] [Google Scholar]
- 3.Andersson GB, An HS, Oegema TR, Setton LA. Directions for future research. J Bone Joint Surg. 2006;88:110–114. doi: 10.2106/JBJS.F.00030. [DOI] [PubMed] [Google Scholar]
- 4.Bibby SR, Urban JP. Effect of nutrient deprivation on the viability of intervertebral disc cells. Eur Spine J. 2004;13:695–701. doi: 10.1007/s00586-003-0616-x. [DOI] [PMC free article] [PubMed] [Google Scholar]
- 5.Chelberg MK, Banks GM, Geiger DF, Oegema TR., Jr Identification of heterogeneous cell populations in normal human intervertebral disc. J Anat. 1995;186(Pt 1):43–53. [PMC free article] [PubMed] [Google Scholar]
- 6.Chen J, Yan W, Setton LA. Molecular phenotypes of notochordal cells purified from immature nucleus pulposus. Eur Spine J. 2006;15 3:S303–S311. doi: 10.1007/s00586-006-0088-x. [DOI] [PMC free article] [PubMed] [Google Scholar]
- 7.Chiba K, Andersson GB, Masuda K, Thonar EJ. Metabolism of the extracellular matrix formed by intervertebral disc cells cultured in alginate. Spine. 1997;22:2885–2893. doi: 10.1097/00007632-199712150-00011. [DOI] [PubMed] [Google Scholar]
- 8.Darling ME, Athanasiou KA. Rapid phenotypic changes in passaged articular chondrocyte subpopuations. Journal of Orthopaedic Research. 2005;23:425–432. doi: 10.1016/j.orthres.2004.08.008. [DOI] [PubMed] [Google Scholar]
- 9.Ehrlich HP, Bornstein P. Microtubules in transcellular movement of procollagen. Nat New Biol. 1972;238:257–260. doi: 10.1038/newbio238257a0. [DOI] [PubMed] [Google Scholar]
- 10.Gaetani P, Torre ML, Klinger M, Faustini M, Crovato F, Bucco M, Marazzi M, Chlapanidas T, Levi D, Tancioni F, Vigo D, Rodriguez y Baena R. Adipose-derived stem cell therapy for intervertebral disc regeneration: an in vitro reconstructed tissue in alginate capsules. Tissue Eng Part A. 2008;14:1415–1423. doi: 10.1089/ten.tea.2007.0330. [DOI] [PubMed] [Google Scholar]
- 11.Goins ML, Wimberley DW, Yuan PS, Fitzhenry LN, Vaccaro AR. Nucleus pulposus replacement: an emerging technology. Spine J. 2005;5:317S–324S. doi: 10.1016/j.spinee.2005.02.021. [DOI] [PubMed] [Google Scholar]
- 12.Guilak F, Ting-Beall HP, Baer AE, Trickey WR, Erickson GR, Setton LA. Viscoelastic properties of intervertebral disc cells. Identification of two biomechanically distinct cell populations. Spine. 1999;24:2475–2483. doi: 10.1097/00007632-199912010-00009. [DOI] [PubMed] [Google Scholar]
- 13.Horner HA, Roberts S, Bielby RC, Menage J, Evans H, Urban JP. Cells from different regions of the intervertebral disc: effect of culture system on matrix expression and cell phenotype. Spine. 2002;27:1018–1028. doi: 10.1097/00007632-200205150-00004. [DOI] [PubMed] [Google Scholar]
- 14.Huang CY, Yuan TY, Jackson AR, Hazbun L, Gu WY. Effects of low glucose concentrations on oxygen consumption rates of intervertebral disc cells. Spine. 2007;32:2063–2069. doi: 10.1097/BRS.0b013e318145a521. [DOI] [PMC free article] [PubMed] [Google Scholar]
- 15.Jeffrey JJ, Martin GR. The role of ascorbic acid in the biosynthesis of collagen. I. Ascorbic acid requirement by embryonic chick tibia in tissue culture. Biochim Biophys Acta. 1966;121:269–280. doi: 10.1016/0304-4165(66)90116-4. [DOI] [PubMed] [Google Scholar]
- 16.Maldonado BA, Oegema TR., Jr Initial characterization of the metabolism of intervertebral disc cells encapsulated in microspheres. J Orthop Res. 1992;10:677–690. doi: 10.1002/jor.1100100510. [DOI] [PubMed] [Google Scholar]
- 17.Masuda K, An HS. Growth factors and the intervertebral disc. Spine J. 2004;4:330S–340S. doi: 10.1016/j.spinee.2004.07.028. [DOI] [PubMed] [Google Scholar]
- 18.Melrose J, Smith S, Ghosh P. Assessment of the cellular heterogeneity of the ovine intervertebral disc: comparison with synovial fibroblasts and articular chondrocytes. Eur Spine J. 2003;12:57–65. doi: 10.1007/s00586-002-0434-6. [DOI] [PubMed] [Google Scholar]
- 19.Mow VC, Huiskes R. Basic orthopaedic biomechanics and mechano-biology. third. 2005. [Google Scholar]
- 20.Nerlich AG, Schleicher ED, Boos N. Volvo Award winner in basic science studies. Immunohistologic markers for age-related changes of human lumbar intervertebral discs. Spine. 1997;22:2781–2795. doi: 10.1097/00007632-199712150-00001. [DOI] [PubMed] [Google Scholar]
- 21.Poiraudeau S, Monteiro I, Anract P, Blanchard O, Revel M, Corvol MT. Phenotypic characteristics of rabbit intervertebral disc cells. Comparison with cartilage cells from the same animals. Spine. 1999;24:837–844. doi: 10.1097/00007632-199905010-00002. [DOI] [PubMed] [Google Scholar]
- 22.Preradovic A, Kleinpeter G, Feichtinger H, Balaun E, Krugluger W. Quantitation of collagen I, collagen II and aggrecan mRNA and expression of the corresponding proteins in human nucleus pulposus cells in monolayer cultures. Cell Tissue Res. 2005;321:459–464. doi: 10.1007/s00441-005-1116-6. [DOI] [PubMed] [Google Scholar]
- 23.Rajpurohit R, Risbud MV, Ducheyne P, Vresilovic EJ, Shapiro IM. Phenotypic characteristics of the nucleus pulposus: expression of hypoxia inducing factor-1, glucose transporter-1 and MMP-2. Cell Tissue Res. 2002;308:401–407. doi: 10.1007/s00441-002-0563-6. [DOI] [PubMed] [Google Scholar]
- 24.Richardson SM, Walker RV, Parker S, Rhodes NP, Hunt JA, Freemont AJ, Hoyland JA. Intervertebral disc cell-mediated mesenchymal stem cell differentiation. Stem Cells. 2006;24:707–716. doi: 10.1634/stemcells.2005-0205. [DOI] [PubMed] [Google Scholar]
- 25.Ripley CR, Fant J, Bienkowski RS. Brefeldin A inhibits degradation as well as production and secretion of collagen in human lung fibroblasts. J Biol Chem. 1993;268:3677–3682. [PubMed] [Google Scholar]
- 26.Risbud MV, Di MA, Guttapalli A, Seghatoleslami R, Denaro V, Vaccaro AR, Albert TJ, Shapiro IM. Toward an optimum system for intervertebral disc organ culture: TGF-beta 3 enhances nucleus pulposus and anulus fibrosus survival and function through modulation of TGF-beta-R expression and ERK signaling. Spine. 2006;31:884–890. doi: 10.1097/01.brs.0000209335.57767.b5. [DOI] [PubMed] [Google Scholar]
- 27.Shahdadfar A, Løken S, Dahl JA, Tunheim SH, Collas P, Reinholt FP, Engebretsen L, Brinchmann JE. Persistence of collagen type II synthesis and secretion in rapidly proliferating human articular chondrocytes in vitro. Tissue Eng Part A. 2008;14:1999–2007. doi: 10.1089/ten.tea.2007.0344. [DOI] [PubMed] [Google Scholar]
- 28.Shapiro HM. Practical flow cytometry. 4th. 2003. [Google Scholar]
- 29.Walker MH, Anderson DG. Molecular basis of intervertebral disc degeneration. Spine J. 2004;4:158S–166S. doi: 10.1016/j.spinee.2004.07.010. [DOI] [PubMed] [Google Scholar]
- 30.Wang JY, Baer AE, Kraus VB, Setton LA. Intervertebral disc cells exhibit differences in gene expression in alginate and monolayer culture. Spine. 2001;26:1747–1751. doi: 10.1097/00007632-200108150-00003. [DOI] [PubMed] [Google Scholar]
- 31.Wang L, Verbruggen G, Almqvist K, Elewaut D, Broddelez CE, Veys E. Flow cytometric analysis of the human articular chondrocyte phenotype in vitro. Osteoarthritis and Cartilage. 2001;9:73–84. doi: 10.1053/joca.2000.0352. [DOI] [PubMed] [Google Scholar]