Abstract
We are using Optical Coherence Tomography (OCT) to image structure and function of the developing embryonic heart in avian models. Fast OCT imaging produces very large 3D (2D + time) and 4D (3D volumes + time) data sets, which greatly challenge ones ability to visualize results. Noise in OCT images poses additional challenges. We created an algorithm with a quick, data set specific optimization for reduction of both shot and speckle noise and applied it to 3D visualization and image segmentation in OCT. When compared to baseline algorithms (median, Wiener, orthogonal wavelet, basic non-orthogonal wavelet), a panel of experts judged the new algorithm to give much improved volume renderings concerning both noise and 3D visualization. Specifically, the algorithm provided a better visualization of the myocardial and endocardial surfaces, and the interaction of the embryonic heart tube with surrounding tissue. Quantitative evaluation using an image quality figure of merit also indicated superiority of the new algorithm. Noise reduction aided semi-automatic 2D image segmentation, as quantitatively evaluated using a contour distance measure with respect to an expert segmented contour. In conclusion, the noise reduction algorithm should be quite useful for visualization and quantitative measurements (e.g., heart volume, stroke volume, contraction velocity, etc.) in OCT embryo images. With its semi-automatic, data set specific optimization, we believe that the algorithm can be applied to OCT images from other applications.
1. Introduction
We are using Optical Coherence Tomography (OCT) to image structure and function of the developing embryonic heart in avian models. OCT allows one to non-invasively image living hearts with microscopic resolution, and to visually and quantitatively analyze development. Due to the diminutive size and rapid movements of the early embryonic heart, OCT imaging provides a unique ability to study anatomy and function. We believe that OCT has the requisite spatial and temporal resolution and is hence an important tool to facilitate understanding of the underlying mechanisms responsible for normal/abnormal heart development [1]. However, noise present in OCT imaging systems [2-11] limits our ability to interpret, visualize and analyze image data which is crucial to the understanding of early cardiac development. The purpose of our study is to address this limitation by creating an algorithm for noise reduction in OCT images and evaluating its performance both visually and quantitatively through volumetric visualization and image segmentation. The novelty of our noise reduction technique lies in its ability to optimally reduce noise based on the characteristics of a particular image data set.
Due to its deleterious effects on coherent imaging systems such as ultrasound and OCT, there has been significant effort to characterize and reduce noise [2-21]. The two most common noise sources are shot noise, which is additive in nature and can be adequately described by the Additive White Gaussian Noise (AWGN) process, and speckle noise, which is multiplicative in nature and harder to eliminate due to its signal dependency. In fact, speckle carries useful information about the underlying tissue structure [11]. OCT is very similar to ultrasound and a brief review of shot and speckle noise reduction in ultrasound is in order. Shot noise reduction is applied both during acquisition [17] and post-acquisition using simple image processing techniques [22-24] such as an averaging filters, median filters and Gaussian low-pass filters. However, many of these filtering techniques tend to remove useful features from images. One of the most effective technique for shot noise removal is the phase preserving non-orthogonal wavelet (NW) filtering technique proposed by Kovesi [16]. As for speckle noise removal from ultrasound images, spatial domain techniques have been employed including the one proposed by Xie et al. [19] who applied a salient boundary enhancement technique with a speckle suspension term, and Dutt and Greenleaf [13], who employed a local statistical model to quantify the extent of speckle formation and subsequently used an unsharp masking filter to suppress speckle. As for transform domain techniques, wavelet-based speckle suppression has been reported [12,14,20]. More recently, Fan et al. [25] combined pyramid decomposition of images with anisotropic diffusion filtering to reduce speckle in ultrasound images of phantoms and liver. For OCT images, shot noise has been reduced using post-acquisition image processing techniques [22-24] such as averaging filters, median filters and Gaussian filters. There are also reports on speckle reduction techniques in OCT including physical techniques [2,4,5,7,8], those applied prior to image formation [6], and post-acquisition, image processing techniques such as hybrid median filter (HMF), Wiener filter, ELEE filter, symmetric nearest neighbor (SNN) filter, Kuwahara filter, adaptive Wiener filter, rotating kernel transformation (RKT), anisotropic diffusion filtering, orthogonal and non-orthogonal wavelet filters [3,7,10]. Ozcan et. al [7] have compared the relative performances of the ELEE filter, two wavelet transform based filters, the HMF, SNN, a Kuwahara filter, and the adaptive Wiener filter, and have argued that post-acquisition digital image processing is advantageous because it does not require the additional acquisition of compounding angles required by the physical technique for speckle reduction. Puvanathasan and Bizheva [9] have used a fuzzy thresholding algorithm in the wavelet domain for speckle reduction in OCT images of a human finger tip, and have compared their technique with the Wiener and Lee filters.
In this paper, we create an algorithm to reduce both shot and speckle noise through digital image processing. The Kovesi NW filtering technique, originally applied to video surveillance data, can greatly reduce shot noise. However, manual optimization of parameters can be a daunting and unsatisfying task. Hence, we will investigate methods for automatically optimizing the wavelet filter bank for OCT. We call our technique Optimized Non-orthogonal Wavelet (ONW) denoising. To reduce speckle, we use an enhanced version of the Laplacian Pyramid Nonlinear Diffusion (LPND) technique used by Fan et. al on ultrasound images of the liver and carotid artery [25]. Since speckle size depends on imaging parameters such as the characteristics of the light source, the spot size, and sampling rate, we have investigated adaptive optimization of LPND parameters, and call the method Adaptive LPND (ALPND).
We have identified three approaches for evaluation of noise reduction. First, there are quantitative measures on individual images such as edge preservation (β) [15], structural similarity measure (SSIM) [26], and contrast-to-noise ratio (CNR) [27], as reported in a recent work by Fan et al [25]. We will create a weighted sum of these measures and use this scalar image quality criterion to optimize ALPND. This measure will also be used to evaluate other noise reduction algorithms. Second, as described by Frangakis et al [28], one can evaluate the effect of noise reduction on 3D image visualization. We will investigate how noise reduction affects both isosurface, surface rendering and direct volume rendering [29]. Gradients provide enhanced volume visualization of internal surfaces and tissue boundaries [30-32], and we are particularly interested in the role of noise reduction in improving visualization through accurate estimation of gradients in data. Third, one can determine the effect of noise reduction on segmentation [33]. We used a simple tolerance based seeded region growing algorithm available within the visualization package Amira [34] and a more sophisticated semi-automatic image contour segmentation tool called LiveWire [35,36] to both qualitatively and quantitatively evaluate the effect of noise reduction.
The rest of the paper is organized as follows. In Section 2, we briefly describe baseline denoising algorithms such as median filtering, Wiener filtering, and orthogonal wavelet (OW) filtering, followed by our proposed ONW-ALPND denoising algorithm. In Section 3, we discuss methods for evaluating the performance of image denoising algorithms. Section 4 presents results of our proposed denoising algorithm along with quantitative/qualitative comparisons to baseline algorithms. This is followed by a discussion in Section 5.
2. Image denoising algorithms
2.1 Baseline methods: median, Wiener and orthogonal wavelet (OW) filtering
We briefly review some “baseline” noise reduction filters, which will be compared to our new noise reduction filter. The median filter has been used as a baseline comparison method for filtering additive, impulse and speckle noise in OCT images [3,7,10]. In median filtering, noise is suppressed by replacing each pixel with the median computed from neighboring pixels in a window. We used the Matlab Image Processing Toolbox implementation [37] of the median filter called median2. Like the median filter, the Wiener filter is a popular baseline comparison method for shot and speckle noise removal both in ultrasound and OCT images [7,21,25]. The Wiener filter is a linear filter mostly suited for images degraded by additive noise. Wiener filtering assumes that the signal and noise processes are second-order stationary (in the random process sense). The basic Wiener filter is a bandpass filter that minimizes (in a least-squares sense) the difference between the true and observed signal. It is defined in terms of the following spectra (i) Fourier Transform of the point spread function (PSF) of the system, (ii) Power spectrum of the signal process, and (iii) Power spectrum of the noise process. We used the Matlab Image Processing Toolbox implementation [37] of the Wiener filter called wiener2 which is an adaptive version of the Wiener filter that uses statistics estimated from a local neighborhood of each pixel [38]. We also used a standard wavelet wdencmp from the Matlab Wavelet Toolbox for noise reduction. Wavelets are a powerful tool in image analysis for pattern detection, signal recovery, image compression and noise reduction [39]. Orthogonal wavelets (OW) are a specific class of wavelets where the basis functions are orthogonal i.e. any pair of basis functions in the set has a zero correlation. Image denoising using OW filter consists of (i) decomposition of spatial image data into wavelet coefficients using an appropriate family of wavelet basis functions, (ii) identification of a suitable threshold for the wavelet coefficients followed by a thresholding operation, and (iii) reconstruction of the spatial domain image from the thresholded wavelet coefficients [12,14,20].
Following some ad hoc optimizations, we determined a fixed set of algorithm parameters that were used in our baseline denoising schemes. For median2, we used a square 13 × 13 filter kernel. In wiener2, we again set the filter size to be 13 × 13. In the case of the OW filter using wdencmp function of Matlab, we used the symlet-7 (sym7) wavelet with decomposition performed up to level 3. In order to make a fair comparison, these values were chosen to match the optimal settings for the proposed ONW and ALPND denoising schemes.
2.2 Optimized non-orthogonal wavelet (ONW) denoising
To reduce shot noise, we created the ONW algorithm. It builds upon the basic Kovesi NW filter [16] which was originally applied to synthetic and video surveillance images. Kovesi argued that denoising should not corrupt the phase information in the image, and used a non-orthogonal wavelet filter bank followed by a thresholding of the magnitudes of the wavelet coefficients leaving the phase unchanged. In our modification, we include an image data set specific method for designing the optimal wavelet filter bank for OCT images. A parameter optimization scheme is applied once to a given data set, a set of parameters for designing an optimal filter bank are derived, and all the images in the data set are processed using this optimal filter bank.
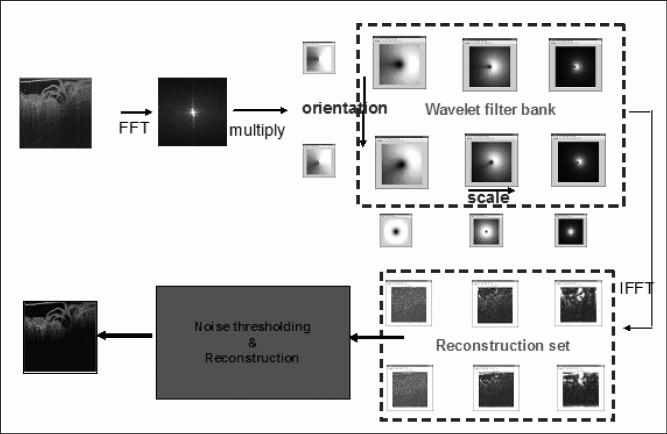
The basic Kovesi NW filter is illustrated in Fig. 1. It uses a non-orthogonal wavelet filter bank with a non-zero correlation between any two filters in the bank [16]. Filters are created to detect features at different frequency subbands (called scales) and different orientations. Assuming the original noise to be an Additive White Gaussian Noise (AWGN) process, the amplitude of the transformed noise follows a Rayleigh distribution [16], whose probability density function (PDF) is characterized by a single parameter. Due to this property, a noise threshold can be determined for the lowest scale from the transformed coefficient values and a simple scaling operation can be applied to derive noise thresholds for higher scales. The noise threshold at each scale is then subtracted from the corresponding filter response and the resulting constituent images are used to reconstruct the denoised image.
Fig. 1.
Kovesi NW filtering for shot noise reduction. The image is convolved with a filter bank after Fourier transformation. The result is transformed back to the spatial domain by an inverse Fourier transformation. A noise threshold is identified in each scale and the filtered image is produced by reconstruction.
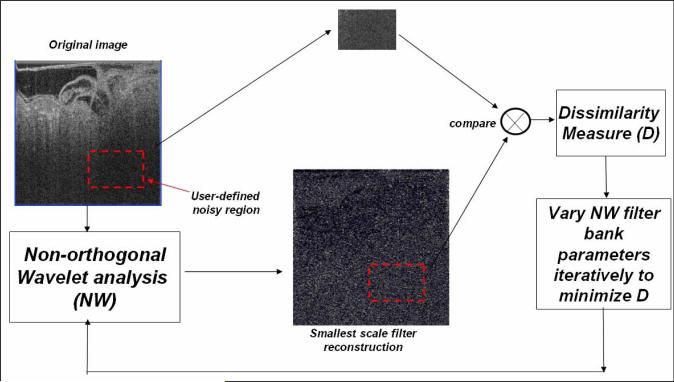
In our modified filter, we propose an optimization scheme for the parameters that generate the wavelet filter bank as illustrated in the schematic flow diagram in Fig. 2. The parameters controlling the filters in the filter bank are (i) number of scales (s), (ii) number of orientations (o), (iii) number of standard deviations around noise threshold to reject as noise (k), (iv) multiplying factor between scales (p), (v) wavelength of smallest scale filter (λ), (vi) ratio of the standard deviation of the Gaussian describing the filter transfer function in the frequency domain to the filter center frequency (Rg) , and (vii) ratio of angular interval between filter orientations and the standard deviation of the angular Gaussian function used to design filters (Ra). We have seen by experimentation that, although parameters (i) through (iv) can be set independently of image data, parameters (v) through (vii) namely λ, Rg and Ra are image dependent. However, Kovesi’s technique [16] does not adapt these parameters based on noise characteristics of the images. We propose a parameter optimization step where empirically determined maximum and minimum values are used for λ, Rg and Ra and each parameter is varied in this range [see Equation(1) below]. For each setting, the wavelet filter response of the smallest scale filter across all orientations, denoted by hss, is computed. We note that the smallest scale filter mostly responds to noise thereby making it a useful approximation to the “noise pattern” in the image. Next, a user-selected noisy region-of-interest (ROI) from the original image I (denoted by Ω) is matched to the co-located ROI in hss using an image distance measure function D based on local histograms [40]. Finally, the optimal parameter settings (λ’, Rg’, Ra’,) are determined as those values that result in the minimum image distance between the two ROIs. Mathematically, this can be represented as:
| (1) |
where λmin, λmax, Rg,min, Rg,max, Ra,min, and Ra,max, are the maximum and minimum values of λ, Rg and Ra that have been determined empirically. To compute this image distance D, the two ROIs are divided into tiled rectangular blocks. A local image histogram with a predefined number of bins is computed for each tile for both the ROIs. Now, a sum-of-absolute-difference (SAD) distance metric is computed between the histograms of the two ROIs [40]. We note that ONW is not only suited for shot noise reduction, but could also be used for speckle reduction. However, we have found that in presence of speckle, shot noise reduction alone is not sufficient f and more sophisticated speckle reduction techniques need to be employed.
Fig. 2.
Proposed optimization scheme for shot noise reduction based on the Kovesi NW filter. The resulting filter is called the Optimized Non-orthogonal Wavlet (ONW) filter. In ONW, a user-defined ROI is matched against a co-located ROI in the smallest scale reconstruction to compute an image dissimilarity measure. The parameters that generate the wavelet filter bank are varied through empirically determined ranges to minimize this dissimilarity measure.
2.3 Adaptive Laplacian pyramid nonlinear diffusion (ALPND) denoising
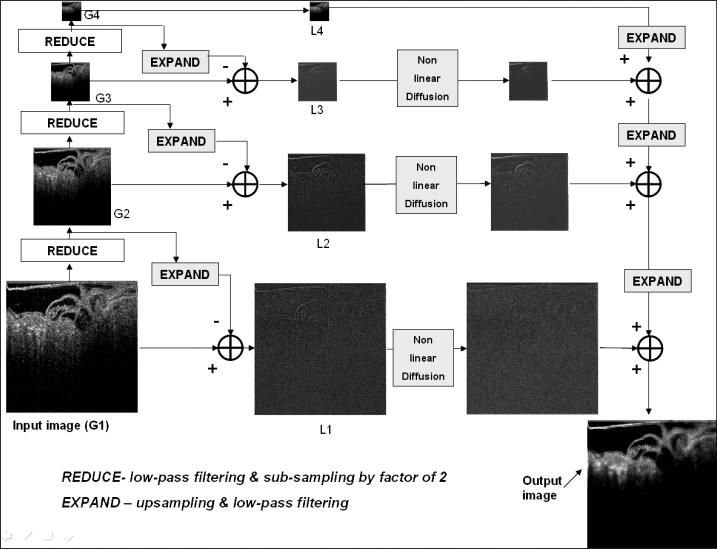
We developed the Adaptive Laplacian Pyramid Nonlinear Diffusion (LPND) technique building upon the basic LPND filter of Fan et al [25] which was originally used on ultrasound images of the liver and the carotid artery. Specifically, we use an optimization scheme for determining parameters of the nonlinear diffusion step that are specific to the speckle characteristics of a given OCT image data set. In other words, the optimization is done once for a given data set by choosing a representative image (visually) that best describes the speckle characteristics. A detailed discussion of pyramid decomposition of images can be found in the medical imaging textbook by Paul Seutens [41]. As illustrated in the flow diagram of Fig. 3, the basic technique proposed by Fan et al. [25] for speckle reduction in ultrasound images employs (LPND) which essentially comprises of a nonlinear (anisotropic) diffusion technique [42] applied to the frequency subbands of the images obtained by Laplacian pyramid image decomposition. As a result of this decomposition, the high frequency speckle noise occupies lower pyramid layers; its effect in higher layers will be negligible. Parameters controlling the amount of smoothing due to anisotropic diffusion are computed separately for each decomposition layer. The smoothing itself is directional in nature and is dependent on the gradient - a high gradient means lesser smoothing while a lower gradient implies heavier smoothing. As a result, speckle is reduced without affecting image features and edges.
Fig. 3.
Laplacian Pyramid Nonlinear Diffusion (LPND) technique for speckle reduction of Fan et al. The image is decomposed into constituent images spanning different frequency bands (referred to as layers). A nonlinear diffusion step is applied in each layer to reduce speckle and the output image is reconstructed from the speckle-reduced images in each layer.
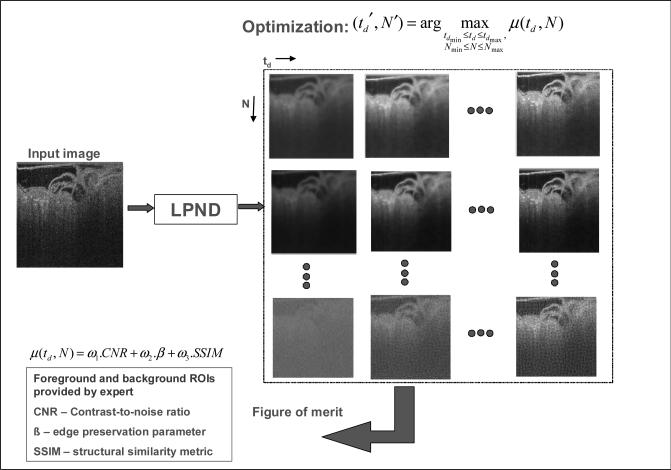
We developed a technique for optimally determining the diffusion threshold td and filter kernel size N used for the nonlinear diffusion process, as illustrated in the flow diagram of Fig. 4. This optimization step is necessary to ensure that the speckle filtering is adaptive to the characteristics of the data set and to the imaging set up. Our technique computes a combined figure of merit μ for evaluating visual quality of the denoised images produced by LPND. Specifically, the following image quality metrics - structural similarity (SSIM) measure, edge preservation parameter (β) and contrast-to-noise ratio (CNR) were computed [25]. These three measures are robust estimators of signal preservation in an image which made them applicable for our filter evaluation. SSIM is a measure of overall processing quality, which compares the original and processed images based on statistics of co-located sub-regions. β is an edge preservation metric that involves computation of high-pass filtered (edge-enhanced) images from the two images being compared using a Laplacian operator. CNR is the relationship of signal intensity differences between two regions, scaled to image noise. Improving CNR increases perception of the distinct differences between two clinical areas of interest.
Fig. 4.
The parameter optimization scheme used in adaptive LPND (ALPND) technique. The filter kernel size N used to compute gradients for nonlinear diffusion and the diffusion threshold td are iterated through a set of values in an empirically determined range and a quantitative figure of merit μ is evaluated at each step. The optimal values for td and N are determined by maximizing μ.
A combined figure of merit μ was derived from the above three measures (CNR, SSIM and β) using a weighted linear function as shown by Equation (1) below where set the weights ω1 = ω2 = ω1 = 1/3. Since each individual measure does not completely capture all aspects of image quality accurately (e.g. CNR produces a higher value with more smoothing and may erroneously rate a highly blurry image higher than a less blurry image), we found it advantageous to combine these parameters linearly using user-selected weights (which in our case were set equal). This let us tune out extreme effects caused by any one individual parameter.
| (2) |
A region-of-interest (foreground) ΩFG and a background region ΩBG are needed to evaluate μ and were manually selected by a user. μ is therefore a function of td, N, ΩFG, ΩBG, ω1, ω2, ω3. However, for a fixed user choice of foreground and background regions and the weights ωi, it is sufficient to denote μ as μ(td, N). The parameter values td and N were iterated through a set of values from a predetermined range (determined empirically), and the optimal parameter settings (td’, N’) were derived by maximizing μ. Mathematically, this is written as:
| (3) |
2.4 Combined filter for shot and speckle noise reduction
We created a noise reduction method using both the ONW and ALPND algorithms in a serial fashion to reduce shot and speckle noise, respectively. We call this combined technique the ONW-ALPND denoising algorithm. To apply this method, a single representative 2D image was chosen from a data set, and ONW and ALPND parameters were optimized. Following optimization, the ONW-ALPND denoising algorithm was run on the entire (2D+time) or (3D+time) data set.
3. Methods for evaluating image quality
We have developed three methods to evaluate the performance of our noise reduction algorithms. First, we quantitatively evaluate image quality from the 2D OCT images before and after denoising. Second, we use volume and surface rendering of the original and denoised volumetric data sets as a means for evaluating the noise reduction performance. Third, we apply a tolerance based seeded region growing algorithm for image segmentation available within Amira [34], a popular 3D image analysis and visualization package, and a semi-automatic contour segmentation technique called LiveWire [35,36] to both noisy and denoised image data. Our evaluation was performed using the following data sets (i) (2D + time) data set that consisted of about 500 images (captured at 195 fps) from a complete cardiac cycle of a day 2 quail embryo, (ii) (3D + time) data set that consisted of 20 volumes (3 cardiac cycles) of the day 2 quail embryonic heart captured at a rate of 10 volumes/sec, (iii) a single volume 3D data set consisting of 131 2D image slices of a stage 14 quail embryo corresponding to one phase (beginning of diastolic filling) of the cardiac cycle, and (iv) human colonic crypt data set consisting of 600 2D image slices. This volume was obtained by an image processing technique called retrospective gating (the topic of retrospective gating is reserved for a future publication).
3.1 Evaluating 2D image quality
A quantitative method was used for evaluating image quality [3,25] of the resultant images produced through filtering. A human expert was shown (2D + time) OCT images of the quail embryonic heart. She first picked a region on the myocardial wall as the foreground and a nearby surrounding region consisting of cardiac jelly as the background. Following this, a combined figure of merit , introduced in Section 2.3 [Equation (2)], was evaluated for the 2D images.
3.2 Volumetric visualization
We next describe the methods used to visualize our (2D + time), 3D, and (3D + time) data sets before and after applying the noise reduction schemes. For the (2D + time) data, the ONWALPND denoising algorithm was applied to each 2D frame following which all the original (noisy) and denoised frames across time were assembled into a single movie file [37]. As for the (3D + time) data, surface renderings of volumetric data from each time point were generated using the isosurface algorithm which generates a surface passing through the volumetric data corresponding to a chosen gray value called the iso-value, using an algorithm similar to marching cubes [29]. . Although surface rendering is a useful tool for data visualization, surfaces are normally rendered opaque eliminating the ability to visualize internal structures such as interfaces between tissue types and boundaries. A 3D volume rendering of our data sets was implemented to enable visualization of internal structures by using suitable voxel opacities for the data points within the volume. To compute the voxel opacities, we built a 2D opacity transfer function (OTF) that assigns an opacity value based on both the original data value and its gradient. In other words, a 2D OTF maps each (data, gradient) pair to an opacity value. To optimize these volume renderings, we first rendered a volume using the “default” OTF provided by the software. Then, sub-regions within the volume were explored and the shape of the OTF was changed using a set of control points till an optimal rendering was obtained (as evaluated visually by the user). The beating heart of the quail embryo before and after the noise reduction step has been visualized as a time series of 3D volume renderings. To generate the surface and volume rendering discussed above, we implemented software extensions using the 3D visualization packages Amira [34] and Drishti [43] by the way of scripts and plug-ins.
3.3 Semi-automatic segmentation
First, we used a tolerance based seeded region growing algorithm for segmentation. Many image analysis and visualization packages such as Amira [34] implement this basic algorithm. Here, the user clicks on a region in the image called a seed and subsequently manipulates a pair of sliders which define a tolerance (in terms of intensity) around the seed value. The algorithm returns a region within the 2D image which satisfies the tolerance set by the user. Second, we employed a semi-automatic 2D image contour segmentation algorithm called LiveWire [35,36] to determine the heart contour from images in our (2D + time) and the single volume 3D data sets. In LiveWire, the user performs mouse-clicks to choose points on a boundary in a digital image. Following each mouse-click, a contour edge is automatically drawn between the current and previous points and the LiveWire boundary starts wrapping around the object of interest. LiveWire is based on a least cost path algorithm of Dijkstra [44] for detecting an optimal boundary in a digital image. More specifically, the boundary detection problem is formulated as an optimal path search in a weighted graph. Graph searching provides mathematically piece-wise optimal boundaries while greatly reducing sensitivity to local noise or other intervening structures [35,36]. We slightly modified the algorithmic implementation of LiveWire so that the user first clicks on a finite number of almost evenly spaced points on the contour and then instructs the software to complete the contour. The segmented heart contours (i.e. from the noisy and denoised data) are compared to the “ground truth” segmentations obtained from human expert users. We first made a subjective (visual) comparison for a few test cases. In addition to this visual comparison, we have developed a quantitative method for computing the distance between two contours. Briefly, the two contours are sampled by selecting an equal number of uniformly spaced pixels (points) on each of them. The x and y coordinates are then noted for each set of points. Following this, Euclidean distances are computed between the two sets of corresponding points [45] and the standard deviation of these distances is obtained to quantify the differences in shape of the contour and location of sampled points in the two contours. A smaller value implies a higher similarity and vice-versa.
4. Results
We performed experiments using the three data sets discussed in the beginning of section 3. We determined optimal parameter settings for both the ONW and the ALPND algorithms using a representative image from our (2D + time) data set. We ran the optimization process using 2D images from different phases of the cardiac cycle and found little variation in the optimal values determined in each case. The optimization process was more dependent on the imaging set up and less on which image from a data set was chosen. For our experiments, we chose one image close to the beginning of diastole for both ONW and ALPND optimization. This image has been shown as the input image in Fig. 4. In the case of the ONW algorithm, the optimal parameter settings were determined to be λ’ = 3, Rg’ = 0.35, and Ra’ = 0.25, as opposed to the default (suboptimal) settings for the basic Kovesi NW filter which were λ’ = 2, Rg’ = 0.55, and Ra’ = 1.0. In the case of the ALPND algorithm, the optimal value for the square filter kernel size N was 13 and that for the diffusion threshold td was determined to be 0.0001, when compared with a default (suboptimal) setting of N = 7 and td = 0.005 that have been suggested previously by Fan et al [25].
4.1 ONW denoising
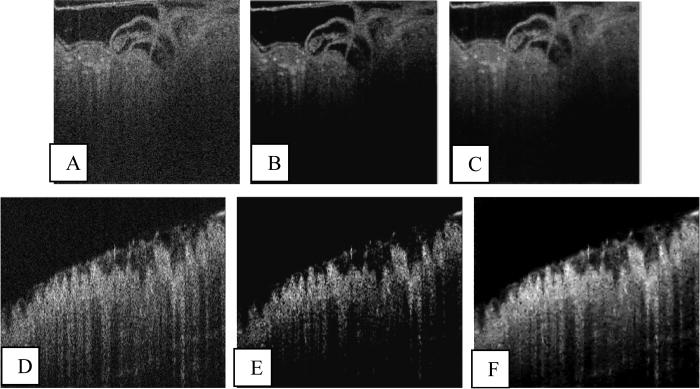
In Fig. 5, we compare the basic Kovesi NW filter with the ONW filter using a sample 2D image from the (2D + time) data set [Fig. 5(a)]. Although the Kovesi NW filter efficiently reduced noise, we see that in the resulting image [Fig. 5(b)], there is a loss of information with depth. For instance, the image information close to the bottom part of the inflow tract (see bottom right portion of the tubular heart) seems to be lost in Fig. 5(b). The proposed ONW technique reduced the shot noise but preserved image information with depth [Fig. 5(c)]. Figs. 5d-f show the results of applying ONW to OCT images of the human colonic crypt data set. As before, a depth-dependent loss of information due to suboptimal choice of filter bank parameters is very apparent [Fig. 5(e)]. For instance, in Fig. 5e, the muscularis mucosae (thin layer of smooth muscle) at the bottom of the mucosa and the lower parts of the crypts of Lieberkuhn are clearly lost in this image. The ONW technique again preserved information with depth [Fig. 5(f)].
Fig. 5.
ONW technique applied to OCT images of quail embryo (a-c) from (2D + time) data set and colon crypt pattern (d-f). (a) Original image of day 2 quail embryo, (b) Denoised image using the basic Kovesi NW filter, (c) Denoised image using ONW, (d) Original image of colon crypt pattern, (e) Denoised image using the basic Kovesi NW filter, and (f) Denoised image using ONW.
4.2 ALPND denoising
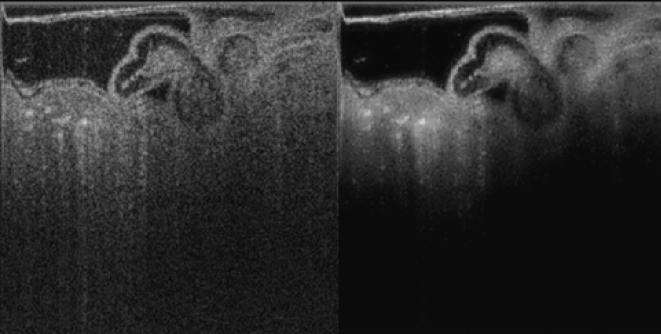
We applied the LPND method to the image already processed using ONW [Fig. 6(a), 6(b)]. Suboptimal parameter settings produced a heavily blurred image [Fig. 6(b)]. The ALPND method produced a speckle-reduced image with minimal blurring [Fig. 6(c)].
Fig. 6.
ALPND technique applied to quail embryo OCT images (a) ONW filtered image from Fig. 5(c), (b) Result of basic LPND filtering of Fan et al. applied to the image in (a), (c) Result of proposed ALPND technique applied to the image in (a).
4.3 Visual and quantitative comparison with other filtering techniques
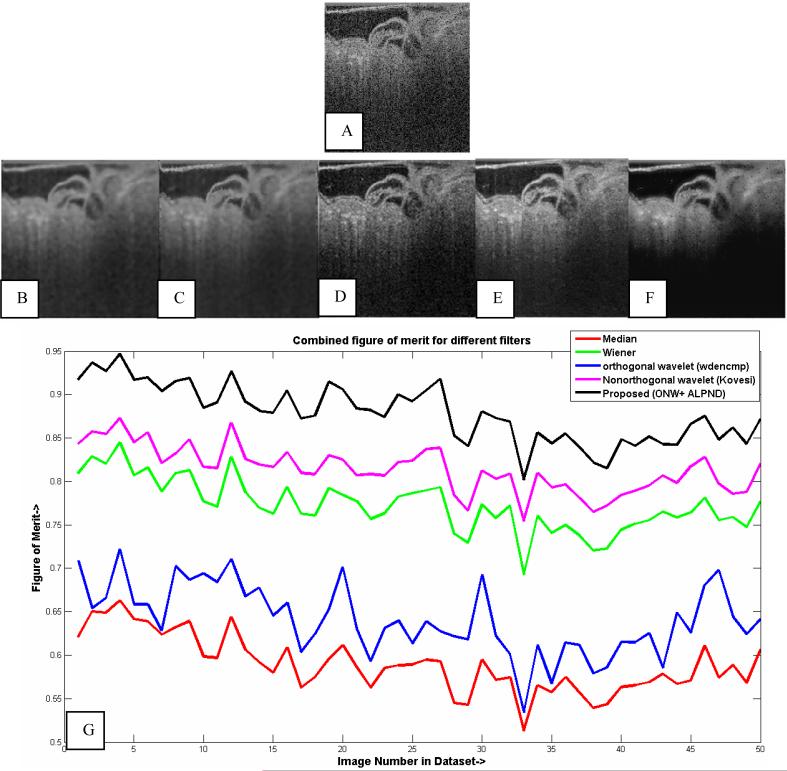
In Fig. 7 (a)-(f), we visually compared the ONW-ALPND denoising algorithm with the baseline denoising algorithms and the basic Kovesi NW filter [16] using a panel of experts in OCT technology and embryonic development. More specifically, our expert panel consisted of (i) an expert in cardiac developmental biology (Dr. Michiko Watanabe, Associate Professor of Pediatrics, Case Western Reserve University), (ii) two students from the Case School of Medicine majoring in Anatomy, and (iii) two experts in OCT imaging (Michael Jenkins & Andrew Rollins, authors). Our experts were shown images from different cardiac cycles for training and evaluation. Using the same input image as in Fig. 5(a) [repeated as Fig. 7(a)], we applied the baseline algorithms, the basic Kovesi NW filter and finally our ONW-ALPND denoising algorithm. Experts indicated that the denoised image obtained using the proposed method [Fig. 7(f)] was visually better as compared to the other methods [Fig. 7 (b)-(e)]. Figure 8 shows a movie comparing the image frames from the noisy and the denoised data sets after applying the proposed algorithm. Again, experts indicated that with denoising, blood flow can be more clearly visualized. Also, we can see structures such as cardiac jelly and the endocardial wall better after denoising. We also performed a quantitative comparison with the baseline algorithms. We chose 50 consecutive (in time) images from our (2D + time) data set. In order to make a fair comparison, the optimal filter kernel size determined by the ALPND algorithm was used to set the kernel size for the baseline algorithms. We obtained the combined figure of merit (μ) in Equation (2) for the filtered images [Fig. 7(g)] produced by each of the above-mentioned techniques, from which it is evident that our proposed denoising algorithm performs better than the baseline algorithms.
Fig. 7.
Visual and quantitative comparison of filtered images obtained by applying various noise reduction techniques to image in (a). (b) Median filter, (c) Wiener filter, (d) The OW filter using wdencmp function from the MATLAB® Wavelet Toolbox™, (e) the basic Kovesi NW filter, and (f) proposed ONW-ALPND technique. (g) Quantitative comparison of figure of merit of ONW-ALPND filter with median, Wiener, OW and the basic Kovesi NW filters.
Fig. 8.
(3.19 MB) A (2D + time) movie of original (noisy) and ONW-ALPND denoised data from the (2D + time) data set of the stage 13 quail embryo.
4.4 Surface and volume visualization
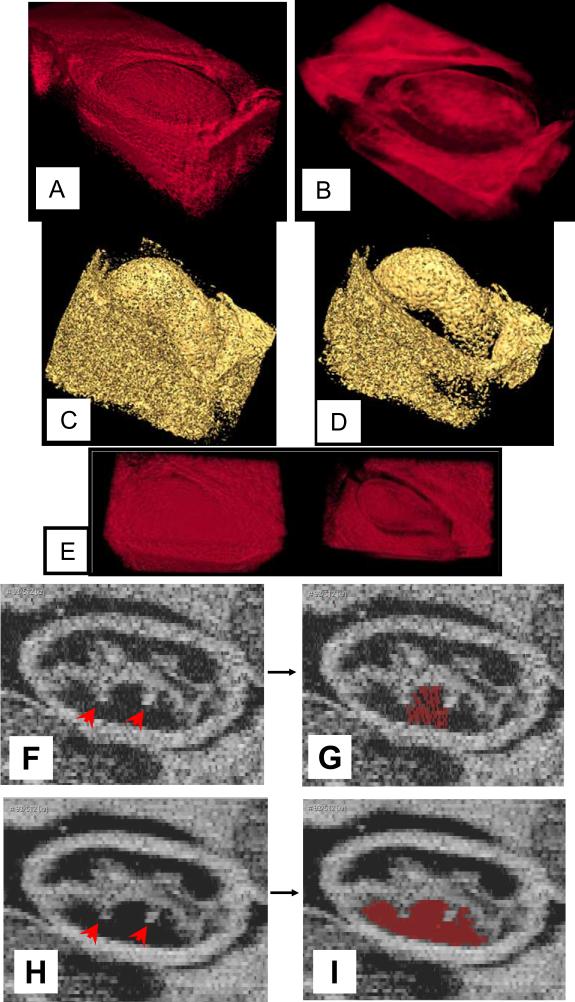
Surface and volume renderings from the original and denoised data were evaluated by experts in image processing and embryonic development. First, the experts were shown a volume rendering from one representative volume in the (3D+time) data set produced by each of the baseline denoising algorithms and the ONW-ALPND denoising algorithm. Anecdotally, the experts indicated that the ONW-ALPND denoising enabled the best visualization of internal structures without loss of useful details. Next, we asked them to compare the volume rendering produced by the ONW-ALPND denoising algorithm fro with that obtained from the original data [Fig. 9(a)]. They concluded that denoising enabled better visualization of tissue boundaries and the tubular structure of the heart. Following this, experts were shown surface renderings from the original [Fig. 9(c)] and ONW-ALPND denoised data [Fig. 9(d)]. They concluded that the heart surface was smoother and that the adjoining surfaces were more clearly visible after denoising. Finally, they were shown a movie made from a time series of volume renderings consisting of six phases of the cardiac cycle, corresponding to both the original and the denoised data [Fig. 9(e)]. They concluded that the dynamics of the beating heart in 3D, e.g. interaction between the heart and adjoining structures, could be more clearly visualized.
Fig. 9.
Comparison of volume renderings of one phase of the cardiac cycle from the (3D + time) data set before (a) and after (b) ONW-ALPND denoising. Volume renderings were produced using the Drishti visualization software. An isosurface for a gray level value of 60 from both noisy (c) and denoised (d) data. In (e), (301 KB) a movie is shown of the time series of original (left) and denoised (right) volumes corresponding to a complete heartbeat. Figures (f) – (i) show an en face 2D image slice from a different data set - the single volume 3D data set of quail embryo. The noisy image appears in (f) and the ONW-ALPND denoised image is shown in (h). It is clear that outpocketings from the endocardium (red arrows) are more clearly visible after ONW-ALPND denoising. Figures (g) and (i) show the result of the Amira tolerance based seeded region growing tool applied to (f) and (h) respectively for segmenting the cardiac jelly (red region).
4.5. Semi-automatic segmentation
4.5.1 Tolerance based seeded region growing
Figures 9(f) and (h) show a visual comparison of noisy versus ONW-ALPND denoised data respectively using an en face 2D image from the single volume 3D data set. It is clear that anatomically important features such as outpocketings (sometimes called tethers) from the endocardial wall into the surrounding cardiac jelly are more distinctly visible in the denoised image in Fig. 9(h) (red arrows), suggesting that it should be easier to segment after denoising. We have verified that the tolerance based seeded region growing algorithm (section 3.3) performed better on denoised data because it clearly segmented out the lower portion of the cardiac jelly, as shown by the red region in Fig. 9(i). This can be observed by comparing it with the corresponding red region in Fig. 9(g), which shows the same algorithm applied on noisy data.
4.5.2 LiveWire segmentation
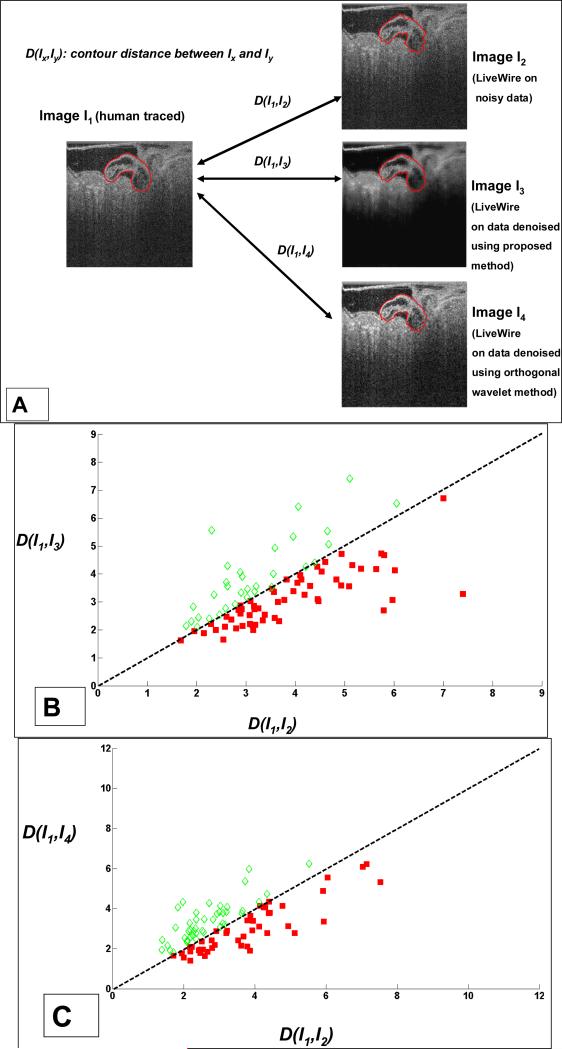
We compared LiveWire 2D segmentation results obtained by applying the proposed denoising technique with those obtained from noisy data and the OW filter denoising technique [Fig. 10(a)]. The data set consisted of 90 2D images from the (2D + time) data set corresponding to one complete cardiac cycle of the quail embryo. We computed the contour distance measure (section 3.3) between human expert traced contours and those obtained using LiveWire on (i) noisy data [denoted by D(I1,I2) in Fig. 10], (ii) denoised data using proposed technique [denoted by D(I1,I3)], and (iii) denoised data using OW filter [denoted by D(I1,I4)]. A scatter plot of D(I1,I2) versus D(I1,I3) is shown in Fig. 10 (b). It can be easily seen that a larger number of points (64%) lie below the dotted line [corresponding to D(I1,I2) = D(I1,I3)] than above it, as indicated by solid red squares. This indicated that LiveWire segmentation of the myocardial wall after noise reduction more closely matched an expert traced contour than LiveWire segmentation from noisy data.
Fig. 10.
Quantitative comparison of LiveWire segmentation with human tracings using ONW-ALPND and OW filters on 90 images from the (2D + time) data set. (a) Method used for contour comparison. Scatter plots of contour distance measure (section 3.3) are shown in (b) comparing noisy data with ONW-ALPND denoised data where 64% of the images showed closer conformity of proposed technique to human tracings, and in (c) comparing OW filter denoised data with ONW-ALPND denoised data where 60% of the images showed closer conformity to human tracings.
Computing accurate gradients from data is very crucial for the success of 2D image segmentation algorithms. Some of the existing approaches for noise reduction are not tuned to the specific noise characteristics of an image data set. Therefore, the resulting images may be insufficiently or excessively filtered posing challenges to the gradient estimation process thereby affecting the performance of segmentation. Using the same (2D + time) data set, we compared the performance of the OW filter when used as a preprocessing (denoising) step for segmentation with our proposed ONW-ALPND technique [Fig. 10(c)] using human expert tracings as the baseline. We observed that, in 60% of the cases (solid red squares), Livewire contours produced by the proposed method were closer to human expert tracings than the LiveWire contours produced by OW filtering, thereby suggesting the superiority of the ONWALPND method.
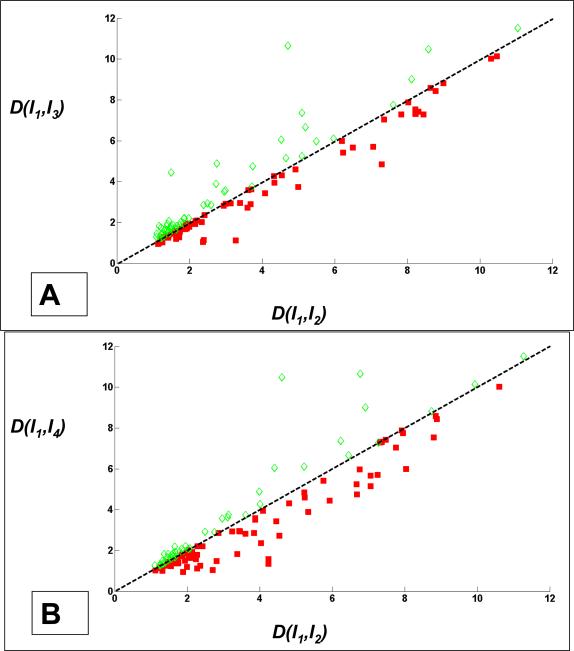
We next performed the same experiments on the single volume 3D data set consisting of 2D slices obtained at different spatial positions (outer myocardial wall was visible in 131 slices). These images were from a stage 14 quail heart volume at a single phase in the cardiac cycle. This data set was obtained using an image processing technique called retrospective gating (the topic of retrospective gating is reserved for a future publication). For this data set, Figs. 9(f)-(i) have already demonstrated visually that both image quality and segmentation performance are better in the case of ONW-ALPND denoised data. We further provide quantitative evaluation results in Fig. 11. Figure 11(a) shows a comparison of ONW-ALPND versus noisy data as a scatter plot in which about 60% of the points (solid red squares) lie below the dotted line, indicating that noise reduction aids segmentation. Similarly, Fig. 11(b) shows a comparison of ONW-ALPND versus the OW filter in which 65% of the points (solid red squares) indicate better conformity of the ONW-ALPND technique to human expert tracings.
Fig. 11.
Quantitative comparison of LiveWire segmentation on the single volume 3D data set consisting of 131 2D image slices corresponding to different spatial positions within the volume. Scatter plots of contour distance measure (section 3.3) have been plotted. (a) Comparison of contours obtained from noisy data with those obtained from ONW-ALPND where 60% of images showed closer conformity of proposed technique to human tracings, (b) Comparison of ONW-ALPND with OW filter where 65% of images showed closer conformity of proposed technique to human tracings.
The results from these data sets indicate a moderate percentage of conformity of contours obtained from the proposed algorithm to human tracings (in the range of 60-65%), when compared with those obtained from noisy data and the OW filtering method. This was probably due to (i) inaccuracies in human tracings owing to the changing shape and position of the myocardial wall contour across the 2D slices, and (ii) robustness of the LiveWire segmentation algorithm to noise.
4.5.3Shot versus speckle noise reduction for LiveWire segmentation
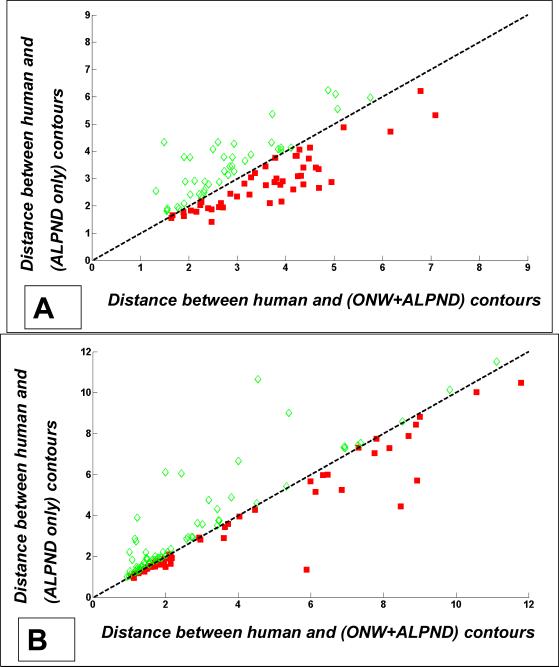
We performed an experiment to evaluate the effect of shot noise reduction on segmentation. First, we applied ONW-ALPND to the noisy images from both the (2D + time) and the single volume 3D data sets. We then applied LPND only to these same images. LiveWire segmentation was performed in both cases and compared (as usual) with human expert tracings (Fig. 12). We observed that the segmentation performance improvement due to the addition of the shot noise reduction step was only marginal, as demonstrated by Fig. 12(a) for the (2D + time) data set where only 48 of the 90 images (53%) indicated that adding the shot noise reduction step helped segmentation, and by Fig. 12(b) for the single volume 3D data set where only 62 of the 131 images (47%) indicated an improved LiveWire segmentation as a result of the shot noise reduction step. In other words, there was strong evidence to believe that speckle noise is more dominant in “segmentable” regions.
Fig. 12.
Quantitative comparison of LiveWire segmentation to human tracings with and without shot noise reduction (ONW). Scatter plots of contour distance measure (section 3.3) have been plotted. (a) Results from the (2D + time) data set consisting of 90 images from one cardiac cycle of quail heart (where shot noise reduction helped in only 53% of the total images). (b) Results from single volume 3D data set consisting of 131 2D images from one time point of the cardiac cycle (where shot noise reduction helped in only 47% of the total images).
5. Discussion
The combined ONW-ALPND filter aids data interpretation by reducing noise, facilitates biologically useful volume visualizations, and improves semi-automatic segmentation. The results shown in Figs. 5 through 12 strongly support our claim with regard to the usefulness of these filters in investigating early cardiac development in small animal models. We explored the use of each individual filter (ONW, ALPND) in isolation but concluded that the combined filter when applied serially in a specific order (ONW followed by ALPND) produced the best volume visualizations as evaluated subjectively by human experts. These experts were also provided the results from median, Wiener and OW filtering methods to evaluate and compare with the proposed filter. As an example, one expert evaluated the median filter as being inadequate in terms of noise reduction when shown the corresponding volume renderings.
There are some limitations to the current implementation. First, both the ONW and ALPND techniques involve an optimization step, which is currently applied on one representative image to determine the optimal settings for the filtering process. Once the optimal settings are obtained, the denoising is performed using these predetermined settings for the entire data set. Depending on the choice of the “representative” image, ONW may cause a signal drop off especially deeper in the tissue and the ALPND may result in image blurring. One solution would be to use different optimized parameters on different blocks of images. Second, with regards to the computational time, we first employed an unoptimized MATLAB code which took about 25 seconds to process a single 512 × 512 image from the (2D + time) data set on a 2.16 GHz Intel Core Duo laptop with 2 GB of RAM. Since this computation time can become prohibitively large for our extreme data sets, we performed some code optimization. We have currently reduced the computation time to 6 seconds per image on the same computer configuration but believe that further optimizations are possible. Third, we perform denoising on 2D image data only i.e. a 3D data set is processed in a serial fashion by applying the denoising to each 2D image in the stack. We plan to extend denoising to 3D as part of our future work. Also, we employ a serial, slice-by-slice, semi-automatic 2D segmentation technique to perform 3D segmentation. We plan to extend this to a fully automatic 3D implementation. Supervised (i.e. training-based) 3D shape modeling techniques such as Active Shape Models (ASM) and Active Appearance Models (AAM) [46-49] will be useful in this regard but will pose several new challenges. For instance, the complex morphological changes that organs undergo during development would make training a subjective and difficult task. Fourth, there are probably opportunities for improving the opacity and color mapping functions for volume visualization. A 2D opacity transfer function (OTF) leads to enhanced volume visualization as shown by the renderings obtained using the Drishti software [43]. However, it is possible to obtain even improved renderings by designing more complex OTFs that use a higher number of data-dependent variables (and hence a higher number of dimensions). For instance, in addition to the original data value and its gradient, a Laplacian (second derivative) of the data could be employed to derive OTFs. When combined with suitable scalar weighting values along with the original data value and its gradient, a Laplacian can help determine exact location of boundaries, as suggested by Kniss et al [32]. We are planning to build extensions to our volume visualization software so that it can support higher dimensional OTFs during volume rendering.
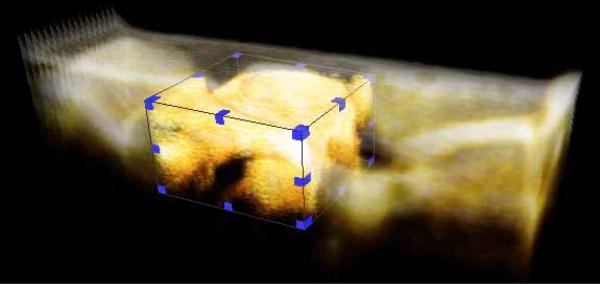
We have routinely encountered very large data sets while producing our volume and surface renderings. Occasionally, we have had to sub-sample our data sets due to computer memory limitations. A possible solution to this data management issue is a multi-resolution volume rendering. Here, the user can work with a lower resolution data set (obtained from sub-sampling high-resolution data) for exploratory purposes. They can then load sub-regions of the image data set at higher resolutions at will (Fig. 13). Some currently available visualization software packages have large scale data visualization features. For example, Amira [34], a popular 3D image analysis and visualization tool provides a Large Data Access (LDA) module which lets the user perform multi-resolution volume rendering shown in Fig. 13.
Fig. 13.
Multi-resolution volume interaction on a single volume of quail embryonic heart from the (3D + time) data set. From a low resolution volume rendering of the heart, a region of interest can be selected (shown by bounding box) for higher resolution viewing.
OCT technology coupled with image processing steps discussed in this paper would constitute a useful tool for investigating the early embryonic heart. Developmental cardiac researchers currently lack an effective imaging tool to investigate the morphological dynamics of the early avian/murine embryonic heart. Recently, we demonstrated the ability of OCT to morphologically phenotype embryonic murine hearts [50]. The set of image denoising algorithms, volume and surface visualization techniques and semi-automatic segmentation techniques presented in this report could be easily adapted to images of murine hearts and would represent a first step towards a fully automated, non-destructive, high-throughput system to assess the phenotype of embryonic murine hearts. This would allow researchers to pinpoint critical time periods at a much faster rate. Also, we have recently demonstrated the ability to image the 3D avian embryonic heart while beating [1,51,52]. Again, an evolved image processing pipeline would assist us in understanding mechanisms that drive normal versus abnormal heart development in early stages.
6. Conclusion
The combined ONW-ALPND filter efficiently reduced additive and speckle noise in OCT images. This algorithm compared very favorably to other popular denoising algorithms when evaluated both visually and quantitatively on 2D images from a (2D + time) data set of the quail embryonic heart. Also, surface and volume visualization from denoised data were greatly improved as compared to that from original data when evaluated visually with the help of human experts. Cardiac structure and function was much more easily visualized following denoising. Also, it was demonstrated using two different data sets [(2D + time) and single volume 3D data sets] that segmentation of substructures such as heart could be performed more efficiently using semi-automatic algorithms after applying our noise reduction techniques. We are currently developing techniques for optimizing opacity transfer functions (OTFs) for producing better visualization of 3D data sets. We are also exploring supervised (training-based) 3D segmentation techniques.
Supplementary Material
Acknowledgements
This research is supported in part by National Institutes of Health RO1HL083048, the Ohio Wright Center of Innovation and Biomedical Research and Technology Transfer award: “The Biomedical Structure, Functional and Molecular Imaging Enterprise”, and the Interdisciplinary Biomedical Imaging Training Program NIH T32EB007509. This investigation was conducted in a facility constructed with support from Research Facilities Improvement Program Grant Number C06 RR12463-01 from the National Center of Research Resources, National Institutes of Health. The authors also acknowledge James G. Fujimoto, Desmond Adler and Robert Huber for their technical contributions.
Footnotes
OCIS codes: (170.4500) Optical coherence tomography; (170.3880) Medical and biological imaging; (030.4280) Noise in imaging systems; (100.6890) Three-dimensional i mage processing; (100.2960) Image Analysis.
References and links
- 1.Jenkins MW, Adler DC, Gargesha M, Huber R, Rothenberg F, Belding J, Watanabe M, Wilson DL, Fujimoto JG, Rollins AM. Ultrahigh-speed optical coherence tomography imaging and visualization of the embryonic avian heart using a buffered Fourier Domain Mode Locked laser. Opt. Express. 2007;15:6251–6267. doi: 10.1364/oe.15.006251. [DOI] [PMC free article] [PubMed] [Google Scholar]
- 2.Bashkansky M, Reintjes J. Statistics and reduction of speckle in optical coherence tomography. Opt. Lett. 2000;25:545–547. doi: 10.1364/ol.25.000545. [DOI] [PubMed] [Google Scholar]
- 3.Brezinski ME. Optical Coherence Tomography: Principles and Applications. Elsevier; 2006. [Google Scholar]
- 4.Desjardins AE, Vakoc BJ, Tearney GJ, Bouma BE. Speckle reduction in OCT using massively-parallel detection and frequency-domain ranging. Opt. Express. 2006;14:4736–4745. doi: 10.1364/oe.14.004736. [DOI] [PMC free article] [PubMed] [Google Scholar]
- 5.Kholodnykh AI, Petrova IY, Larin KV, Motamedi M, Esenaliev RO. Precision of measurement of tissue optical properties with optical coherence tomography. Appl. Opt. 2003;42:3027–3037. doi: 10.1364/ao.42.003027. [DOI] [PubMed] [Google Scholar]
- 6.Marks DL, Ralston TS, Boppart SA. Speckle reduction by I-divergence regularization in optical coherence tomography. J. Opt. Soc. Am. A. 2005;22:2366–2371. doi: 10.1364/josaa.22.002366. [DOI] [PubMed] [Google Scholar]
- 7.Ozcan A, Bilenca A, Desjardins AE, Bouma BE, Tearney GJ. Speckle reduction in optical coherence tomography images using digital filtering. J. Opt. Soc. Am. A. 2007;24:1901–1910. doi: 10.1364/josaa.24.001901. [DOI] [PMC free article] [PubMed] [Google Scholar]
- 8.Pircher M, Gotzinger E, Leitgeb R, Fercher AF, Hitzenberger CK. Speckle reduction in optical coherence tomography by frequency compounding. J. Biomed. Opt. 2003;8:565–569. doi: 10.1117/1.1578087. [DOI] [PubMed] [Google Scholar]
- 9.Puvanathasan P, Bizheva K. Speckle noise reduction algorithm for optical coherence tomography based on interval type II fuzzy set. Opt. Express. 2007;15:15747–15758. doi: 10.1364/oe.15.015747. [DOI] [PubMed] [Google Scholar]
- 10.Rogowska J, Brezinski ME. Image processing techniques for noise removal, enhancement and segmentation of cartilage OCT images. Phys. Med. Biol. 2002;47:641–655. doi: 10.1088/0031-9155/47/4/307. [DOI] [PubMed] [Google Scholar]
- 11.Schmitt JM, Xiang SH, Yung KM. Speckle in optical coherence tomography. J. Biomed. Opt. 1999;4:95–105. doi: 10.1117/1.429925. [DOI] [PubMed] [Google Scholar]
- 12.Achim A, Bezerianos A, Tsakalides P. Novel Bayesian multiscale method for speckle removal in medical ultrasound images. IEEE Trans. Med. Imaging. 2001;20:772–783. doi: 10.1109/42.938245. [DOI] [PubMed] [Google Scholar]
- 13.Dutt V, Greenleaf JF. Adaptive speckle reduction filter for log-compressed B-scan images. IEEE Trans. Med. Imaging. 1996;15:802–813. doi: 10.1109/42.544498. [DOI] [PubMed] [Google Scholar]
- 14.Gupta S, Chauhan RC, Sexana SC. Wavelet-based statistical approach for speckle reduction in medical ultrasound images. Medical & Biological Engineering & Computing. 2004;42:189–192. doi: 10.1007/BF02344630. [DOI] [PubMed] [Google Scholar]
- 15.Hao XH, Gao SK, Gao XR. A novel multiscale nonlinear thresholding method for ultrasonic speckle suppressing. IEEE Trans. Med. Imaging. 1999;18:787–794. doi: 10.1109/42.802756. [DOI] [PubMed] [Google Scholar]
- 16.Kovesi P. Phase Preserving Denoising of Images.. The Australian Pattern Recognition Society Conference: DICTA'99.; Perth, WA. 1999.pp. 212–217. [Google Scholar]
- 17.Kutay MA, Petropulu AP, Piccoli CW. On modeling biomedical ultrasound RF echoes using a power-law shot-noise model. IEEE Trans. Ultrason. Ferroelectr. Freq. Control. 2001;48:953–968. doi: 10.1109/58.935712. [DOI] [PubMed] [Google Scholar]
- 18.Loupas T, Mcdicken WN, Allan PL. An Adaptive Weighted Median Filter for Speckle Suppression in Medical Ultrasonic Images. IEEE. Transactions on Circuits and Systems. 1989;36:129–135. [Google Scholar]
- 19.Xie J, Jiang YF, Tsui HT, Heng PA. Boundary enhancement and speckle reduction for ultrasound images via salient structure extraction. IEEE Trans. Biomed. Eng. 2006;53:2300–2309. doi: 10.1109/TBME.2006.878088. [DOI] [PubMed] [Google Scholar]
- 20.Yue Y, Croitoru MM, Zwischenberger JB, Clark JW. Nonlinear multiscale wavelet diffusion for speckle suppression and edge enhancement in ultrasound images. IEEE Trans. Med. Imaging. 2006;25:297–311. doi: 10.1109/TMI.2005.862737. [DOI] [PubMed] [Google Scholar]
- 21.Zha DF, Qiu TS. A new algorithm for shot noise removal in medical ultrasound images based on alpha-stable model. International Journal of Adaptive Control and Signal Processing. 2006;20:251–263. [Google Scholar]
- 22.Gonzalez RC, Woods RE. Digital Image Processing. Prentice Hall; 2002. [Google Scholar]
- 23.Pratt WK. Digital Image Processing. John Wiley and Sons, Inc.; 2001. [Google Scholar]
- 24.Sonka M, Hlavac V, Boyle R. Image Processing: Analysis and Machine Vision. Brooks and Cole Publishing; 1998. [Google Scholar]
- 25.Fan Zhang, Yang Mo Yoo, Liang Mong Koh, Yongmin Kim. Nonlinear Diffusion in Laplacian Pyramid Domain for Ultrasonic Speckle Reduction. IEEE Trans. Med. Imaging. 2007;26:200–211. doi: 10.1109/TMI.2006.889735. [DOI] [PubMed] [Google Scholar]
- 26.Wang Z, Bovik AC, Sheikh HR, Simoncelli EP. Image quality assessment: From error visibility to structural similarity. IEEE Trans. Image Process. 2004;13:600–612. doi: 10.1109/tip.2003.819861. [DOI] [PubMed] [Google Scholar]
- 27.Verhoeven JTM, Thijssen JM, Theeuwes AGM. Improvement of Lesion Detection by Echographic Image-Processing - Signal-To-Noise-Ratio Imaging. Ultrasonic Imaging. 1991;13:238–251. doi: 10.1177/016173469101300302. [DOI] [PubMed] [Google Scholar]
- 28.Frangakis AS, Hegerl R. Noise reduction in electron tomographic reconstructions using nonlinear anisotropic diffusion. J. Struct. Biol. 2001;135:239–250. doi: 10.1006/jsbi.2001.4406. [DOI] [PubMed] [Google Scholar]
- 29.The Visualization Handbook. Elsevier Academic Press; 2005. [Google Scholar]
- 30.Csebfalvi B, Mroz L, Hauser H, Konig A, Groller E. Fast visualization of object contours by non-photorealistic volume rendering. Computer Graphics Forum. 2001;20:C452–+. [Google Scholar]
- 31.Ebert DS, Morris CJ, Rheingans P, Yoo TS. Designing effective transfer functions for volume rendering from photographic volumes. IEEE. Transactions on Visualization and Computer Graphics. 2002;8:183–197. [Google Scholar]
- 32.Kniss J, Kindlmann G, Hansen C. Multidimensional transfer functions for interactive volume rendering. IEEE. Transactions on Visualization and Computer Graphics. 2002;8:270–285. [Google Scholar]
- 33.Sato Y, Nakajima S, Atsumi H, Koller T, Gerig G, Yoshida S, Kikinis R. 3D multi-scale line filter for segmentation and visualization of curvilinear structures in medical images. Cvrmed-Mrcas'97. 1997;1205:213–222. doi: 10.1016/s1361-8415(98)80009-1. [DOI] [PubMed] [Google Scholar]
- 34.Stalling D, Hege HC, Zockler M. Amira- An Advanced 3D Visualization and Modeling System. 2007 http://amira.zib.de. http://amira.zib.de.
- 35.Ghassan Hamarneh, Judith Hradsky. DTMRI Segmentation using DT-Snakes and DT-Livewire.. Signal Processing and Information Technology, 2006 IEEE International Symposium on. Signal Processing and Information Technology, 2006 IEEE International Symposium on; 2006.pp. 513–518. [Google Scholar]
- 36.Mortensen EN, Barrett WA. Interactive segmentation with intelligent scissors. Graphical Models and Image Processing. 1998;60:349–384. [Google Scholar]
- 37.Demirci M. Matlab Image-Processing Toolbox. Computer. 1994;27:106–107. [Google Scholar]
- 38.Lim JS. Two-Dimensional Signal and Image Processing. Prentice Hall; Englewood Cliffs, NJ: 1990. [Google Scholar]
- 39.Chambolle A, Devore RA, Lee NY, Lucier BJ. Nonlinear wavelet image processing: Variational problems, compression, and noise removal through wavelet shrinkage. IEEE Trans. Image Process. 1998;7:319–335. doi: 10.1109/83.661182. [DOI] [PubMed] [Google Scholar]
- 40.Chang CC, Chan CS, Hsiao JY. A color image retrieval method based on local histogram. Advances in Mutlimedia Information Processing - Pcm 2001, Proceedings. 2001;2195:831–836. [Google Scholar]
- 41.Suetens Paul. Fundamentals of Medical Imaging. Cambridge University Press; 2002. [Google Scholar]
- 42.Perona P, Malik J. Scale-Space and Edge-Detection Using Anisotropic Diffusion. IEEE Trans. Pattern Anal. Mach. Intell. 1990;12:629–639. [Google Scholar]
- 43.Limaye Ajay. Drishti: Volume Exploration and Presentation Tool. [0.1.7] 2007.
- 44.Dijkstra EW. A note on two problems in connection with graphs. Numerische Mathematik. 1959;1:269–271. [Google Scholar]
- 45.Perlibakas V. Automatical detection of face features and exact face contour. Pattern. Recogn. Lett. 2003;24:2977–2985. [Google Scholar]
- 46.Cootes TF, Hill A, Taylor CJ, Haslam J. Use of Active Shape Models for Locating Structure in Medical Images. Image and Vision Computing. 1994;12:355–365. [Google Scholar]
- 47.Cootes TF, Taylor CJ, Cooper DH, Graham J. Active Shape Models - Their Training and Application. Computer Vision and Image Understanding. 1995;61:38–59. [Google Scholar]
- 48.Cootes TF, Beeston C, Edwards GJ, Taylor CJ. A unified framework for atlas matching using Active Appearance Models. Information Processing in Medical Imaging, Proceedings. 1999;1613:322–333. [Google Scholar]
- 49.Cootes TF, Edwards GJ, Taylor CJ. Active appearance models. IEEE Trans. Pattern Anal. Mach. Intell. 2001;23:681–685. [Google Scholar]
- 50.Jenkins MW, Patel P, Deng H, Montano MM, Watanabe M, Rollins AM. Phenotyping transgenic embryonic murine hearts using optical coherence tomography. Appl. Opt. 2007;46:1776–1781. doi: 10.1364/ao.46.001776. [DOI] [PubMed] [Google Scholar]
- 51.Jenkins MW, Rothenberg F, Roy D, Nikolski VP, Hu Z, Watanabe M, Wilson DL, Efimov IR, Rollins AM. 4D embryonic cardiography using gated optical coherence tomography. Opt. Express. 2006;14:736–748. doi: 10.1364/opex.14.000736. [DOI] [PubMed] [Google Scholar]
- 52.Jenkins MW, Chughtai OQ, Basavanhally AN, Watanabe M, Rollins AM. In vivo gated 4D imaging of the embryonic heart using optical coherence tomography. J. Biomed. Opt. 2007;12:030505. doi: 10.1117/1.2747208. [DOI] [PubMed] [Google Scholar]
Associated Data
This section collects any data citations, data availability statements, or supplementary materials included in this article.


