

Abstract
The ability of intravenous cocaine to induce Fos protein expression in anesthetized rats was tested. Two anesthetic regimens commonly used for in vivo FMRI of animals, i.v. α-chloralose and gaseous isoflurane, were studied in separate cohorts. The first experiment included three groups that received the following treatments: saline i.v. and no anesthetic; 2 mg/kg cocaine i.v. and no anesthetic; and 2 mg/kg cocaine i.v. under 36 mg/kg/h α-chloralose anesthesia. The second experiment had a factorial design of four groups that were either nonanesthetized or isoflurane-treated and were either given saline or cocaine (2 mg/kg, i.v.). Anesthetized rats were maintained for 2 h under 2.5–3.5% isoflurane anesthesia, while nonanesthetized rats were kept in an alternative environment for the same time period. Rats were given 2 mg/kg cocaine or saline i.v., 30 min into the test session. Rats were perfused and their brains were processed for Fos immunohistochemistry 90 min after the i.v. treatment. In both experiments, the frontal cortex and striatum of the cocaine-treated nonanesthetized rats expressed Fos in greater amounts than the saline-treated nonanesthetized rats, as expected. The α-chloralose treatment prevented cocaine-induced Fos expression across all eight subregions of the striatum and frontal cortex that were examined. In contrast, isoflurane only partially attenuated Fos expression in the orbital and Cg2 subregions of frontal cortex. These results suggest a strong advantage for using isoflurane, as opposed to α-chloralose, when studying anesthetized rats for in vivo effects of psychostimulants.
Keywords: α-chloralose, isoflurane, c-fos, Fos, cocaine, immediate early gene, anesthesia
Introduction
Cocaine is a widely abused drug that has powerful reinforcing properties in both humans and animals. Functional magnetic resonance imaging (FMRI) studies of systemically administered cocaine have shown widespread patterns of activated and deactivated brain regions (Breiter et al., 1997; Kufahl et al., 2005). FMRI of the effects of cocaine in laboratory animals usually rely upon anesthetic regimens to eliminate the confounding effects of stress and motion. The injectable anesthetic α-choralose has been used in several important FMRI animal experiments (Hyder et al., 1994; Lee et al., 1999; Silva et al., 1999), due to its ability to provide high functional contrast (Lindauer et al., 1993; Ueki et al., 1992). The volatile anesthetic halothane has been popular in pharmacological FMRI studies (Mandeville et al., 2004; Marota et al., 2000; Schwarz et al., 2004), but due its hepatoxicity (Younes et al., 1988) it is often replaced by the similar compound isoflurane (Hanusch et al., 2007). Anesthetics in general can have profound effects upon cerebral blood flow and cerebrovascular coupling (Austin et al., 2005), but little is known about whether their use also changes the neural activation pattern of acute cocaine or other psychoactive drugs.
The effects of drug-elicited brain activation can also be evaluated postmortem in animals by measuring expression of the immediate early gene c-fos. c-Fos is characterized by rapid and transient activation following exposure to a variety of stimuli (Morgan and Curran, 1995). In quiescent baseline conditions, c-fos mRNA is barely detectable, but after exposure to a stimulus the gene is induced, resulting in an increased expression of the protein product, Fos. The Fos protein concentration peaks within 90–120 min and then degrades to basal levels after four to six hours (Brown et al., 1992; Hyman and Nestler, 2004; Moratalla et al., 1993).
Acute administration of cocaine increases c-fos and Fos expression in cocaine-naïve animals (Graybiel et al., 1990; Hope et al., 1992; Young et al., 1991), and in animals that have undergone abstinence following a cocaine self-administration training regimen (Neisewander et al., 2000). Fos expression following cocaine exposure is also highly sensitive to the animal’s history of cocaine experience (Ennulat et al., 1994; Hope et al., 1992) and novelty of the testing environment (Crombag et al., 2002; Hope et al., 2006). This study used two experiments to describe α-chloralose- and isoflurane-induced alterations of the brain response to intravenously administered cocaine. Our initial hypothesis was that isoflurane, which provides a physiological state that is easier to precisely control than α-chloralose, would have less of a confounding impact on cocaine-induced Fos expression.
Methods and Materials
Animals
Male Sprague-Dawley rats weighing 250–300 g were housed individually in a temperature-controlled colony room with a 12-h reversed light/dark cycle. Animal care and housing conditions were consistent with the specifications of the Guide for the Care and Use of Laboratory Animals (National Research Council, 1996). Experimental procedures were approved by the Institutional Animal Care and Use Committee at Arizona State University. Animals were acclimated to handling for 5 days before surgery.
Surgery
Atropine sulfate (10 mg/kg i.p., Sigma) was administered before surgery to reduce bronchial secretions. The rats were anesthetized with sodium pentobarbital (50 mg/kg i.p., Sigma) and a catheter was inserted into the jugular vein as described in detail previously (Neisewander et al., 2000). Catheters were constructed from Silastic tubing (10 cm length, 0.012 in inner diameter, 0.025 in outer diameter, Dow Corning, Midland, MI) connected to a 22 gauge nonferrous metal cannula encased within a plastic screw connector (Plastics One, Roanoke, VA). A flexible obturator made from Tygon tubing was fitted over the cannula to prevent infection when not in use. Patency of the catheters was maintained throughout the experiment by daily flushing with 0.1 ml bacteriostatic saline solution containing heparin (70 U/ml, Elkins-Sinn, Cherry Hill, NJ) and ticarcillin disodium (20 mg/ml GlaxoSmithKline, Philadelphia, PA). Rats also received 0.67 mg/ml urokinase (Astra USA, Westerborough, MA) daily for 1 week after surgery. Catheter patency was tested periodically with 0.8 mg methohexital sodium (Brevital, Sigma), a dose that produces loss of muscle tone only when administered i.v. Following surgery, rats were allowed to recover for 5–7 days in their home cages.
Drugs
Cocaine hydrochloride (Research Triangle Institute) was dissolved in 0.9% saline and filtered for i.v. administration. Injectable α-chloralose (β-anomer ≤ 20%, Sigma, St. Louis, MO) was dissolved in a 20% (2-hydroxypropyl)-β-cyclodextrin (Sigma, St. Louis, MO) solution as described by Storer and colleagues (1997). All injections were delivered at a volume of 1 ml/kg body weight. Liquid isoflurane (Abbott Laboratories, North Chicago, IL) was mixed with oxygen gas and delivered through a plastic nose cone connected to a vaporizer/mixer with a charcoal filtration system (SurgiVet, Waukesha, WI).
Experiment 1
Experiment 1 examined changes in Fos protein following intravenous cocaine or saline infusion in nonanesthetized or α-chloralose-anesthetized rats. Rats were divided into three groups that were given either saline and no anesthetic (Sal-NoA; n = 4), cocaine and no anesthetic (COC-NoA; n = 6), or cocaine under α-chloralose anesthetic (COC-Chloralose; n = 5). Because c-fos expression is known to be highly sensitive to environmental novelty (Dragunow and Faull, 1989; Kaczmarek et al., 1988), the rats were habituated to i.v. saline injections for 5 days prior to the test session. For each habituation session, the rats were injected with saline (1 ml/kg) and returned to their home cages.
On the test day, rats in the nonanesthetized groups were given an i.v. infusion of either cocaine (2 mg/kg) or saline, and returned to their home cage for 90 min. Injections were given over 5 sec for optimal cocaine-elicited Fos response in both anesthetized and nonanesthetized rats (Ferrario et al., 2008; Samaha et al., 2004).
On the test day, rats in the COC-Chloralose group received α-chloralose (60 mg/kg, i.v., infused through the catheter over 60 sec) and were placed in the holding chamber. Complete induction of anesthesia was tested by a tail pinch. Rats were placed on an electric blanket to prevent hypothermia once they were conclusively anesthetized. Anesthesia was maintained by 36 mg/kg/h α-chloralose (i.v., 6 mg/kg injections every 10 min). Breathing was visibly monitored every 15 min and core temperature was continually measured with a flexible rectal probe (YSI, Dayton, OH) connected to a digital thermometer (Cole-Parmer, Vernon Hills, IL). The power of the electric blanket was adjusted throughout the session to keep the core temperature at 37 ± 1 °C. Cocaine was administered (2 mg/kg i.v. over 5 sec) 25 min after the first α-chloralose maintenance injection. Rats were kept under anesthesia and monitored for 90 min following the cocaine administration.
Experiment 2
Experiment 2 examined changes in Fos protein following intravenous cocaine or saline infusion in nonanesthetized or isoflurane-anesthetized rats. Rats were divided into four groups that were given either saline and no anesthetic (Sal-NoA; n = 8), cocaine (2 mg/kg, i.v.) and no anesthetic (COC-NoA; n = 6), cocaine under 2.5% isoflurane anesthesia (COC-ISO; n = 7) or saline under isoflurane anesthesia (Sal-ISO; n = 8). Rats were habituated to i.v. saline injections on each of the 5 days prior to testing, utilizing alternative holding chambers. For each habituation session, the rats were injected with saline and placed into a holding chamber for 2 h, remaining undisturbed inside the colony room. The holding chambers were ventilated and were of the same size and bedding type (Sani-chip, Harlan-Teklad, Madison, WI) as the home cages.
On the test day, rats in the nonanesthetized groups were placed in their holding chambers and given their assigned cocaine or saline infusion. Rats in the anesthetized groups were placed in a Plexiglas induction chamber and administered 3% isoflurane. After induction of anesthesia was confirmed by tail-pinch, the rat was placed on an electric blanket and the isoflurane concentration was reduced to 2%. Breathing and core temperature were monitored in a manner identical to Experiment 1. Expired gases were collected from the rat’s nose by a cannula connected to a low-flow capnograph (model V90041, SurgiVet) via a plastic sample line (Smiths Medical, Waukesha, WI). Heart rate and oxygen saturation (SpO2) were monitored using a pulse oximetry clip (SurgiVet) secured to the rear foot and connected to the same capnograph system. Thirty min after reducing the isoflurane, rats received their assigned i.v. infusion of either saline or cocaine (2 mg/kg ) over a 5–sec period. They were then maintained under isoflurane anesthesia for an additional 90 min. Physiological parameters (end-tidal CO2, SpO2, breathing rate, heart rate and core temperature) were recorded every 10 min under anesthesia. The maintenance dose of isoflurane was continually adjusted (between 1.4% and 2.5%) in order to keep SpO2 > 95% and breathing rate > 68 cycles/min, and the power of the electric blanket was adjusted to keep the core temperature at 37 ± 1 °C. It is noteworthy that some elements of the test environment for the anesthetized groups were different from that of the NoA groups for both experiments in order to incorporate anesthetic and monitoring equipment.
Tissue preparation
Ninety min after cocaine or saline administration, all rats were deeply anesthetized with sodium pentobarbital (100 mg/kg, i.p.). The circulatory system was perfused with 200 ml of ice-cold saline followed by 250 ml of ice-cold 4% paraformaldehyde in 0.1 M phosphate-buffered saline (PBS, pH 7.4). The brain was removed and post-fixed in paraformaldehyde for 24 h, and then cryoprotected by submersion in 30% sucrose for at least 24 h. The brains were then sectioned using a sliding microtome (Microm International, Walldorf, Germany) connected to a freezing stage (Physitemp, Clifton, NJ). Serial coronal 40 µm sections were collected, separated by 120 µm, centered at anatomical locations corresponding to bregma +3.2 and +1.6 mm (Paxinos and Watson, 1998). The tissue sections were then frozen and stored at 4° C in a cryoprotectant solution comprised of 0.02 M PBS (pH 7.2), 30% sucrose, 10% polyvinyl pyrrolidone and 30% ethylene glycol.
Fos protein immunohistochemistry
Free floating tissue sections were first washed in 0.02 M PBS (pH 7.2, seven times for 10 min each), incubated for 1 h in 0.4% Triton X-100 and 1.5% normal goat serum (NGS; Vector Laboratories, Burlingame, CA) in 0.02 M PBS. The tissue was then incubated for 48 h at 4°C with rabbit polyclonal anti-Fos serum (sc-52, Santa Cruz Biotechnology, Santa Cruz, CA), diluted 1:10,000 in 0.02 M PBS containing 1% NGS and 0.4% Triton X-100. Following incubation, the sections were washed in 0.02 M PBS (five times for 5 min each) and then incubated for 1 h at room temperature in biotinylated goat anti-rabbit IgG antibody (Vector Laboratories), diluted 1:400 in 0.02 M PBS. The tissue was then washed in 0.02 M PBS (three times for 10 min each) and then incubated for 1 h in avidin-biotinylated horseradish peroxidase complex (ABC Elite Kit; Vector Laboratories) diluted 1:100 in 0.02 M PBS. The sections were then washed with 0.05 M Tris buffer (pH 7.6, three times for 10 min each) and incubated in 0.05 M Tris buffer containing 0.02% 3,3’-diaminobenzidine (DAB; Sigma), 2.5% nickel ammonium sulfate and 0.005% H2O2. The DAB reaction was terminated after 3 min by rinsing the tissue three times for 10 min in 0.02 M PBS. All of the washes and incubations described above were performed on an orbital shaker (Cole-Parmer, Vernon Hills, IL) operating at 90 rpm. The sections were mounted onto gelatin chromium-coated slides, air-dried, dehydrated and protected with a coverslip of light-microscopic inspection.
Fos immunoreactivity analysis
Fos immunoreactivity was examined using a Nikon Eclipse E600 (Nikon Instruments, Melville, NY) microscope set at 20× magnification and counted by an observer blind to treatment conditions using the ImageTool software package (Version 3.0, University of Texas Health Science Center, San Antonio, TX). The anatomical locations and boundaries of each region were determined using a rat brain atlas (Paxinos and Watson, 1998) and are illustrated in Fig 1. Sections taken at +3.2 mm from bregma contained the prelimbic (PrL), infralimbic (IL), orbital (Orb) and Cg1 region of the anterior cingulate cortex (Cg1). Sections taken at +1.6 mm from bregma contained the Cg2 region of the anterior cingulate cortex (Cg2), nucleus accumbens shell (NAcS), nucleus accumbens core (NAcC) and dorsal caudate/putamen (dCPu). In addition, sections were taken from a subset of rats at −2.56 mm from bregma in order to examine the mediodorsal thalamus as a control region for determining optimal primary antibody concentration. The sections were taken such that the rostral-caudal extent of each region of interest was sampled (340 µm). Fos immunoreactivity was counted and identified by a blue-black oval-shaped nucleus (Fig. 2 and Fig. 3). Each region of interest was analyzed using both hemispheres from three tissue sections from each animal. The area of each sample measure was 0.26 mm2, but two samples were taken from each hemisphere for the Orb and dCPu. The counts from all the sample areas from a given region were averaged and scaled to provide a mean number of Fos-positive cells per mm2.
Figure 1.
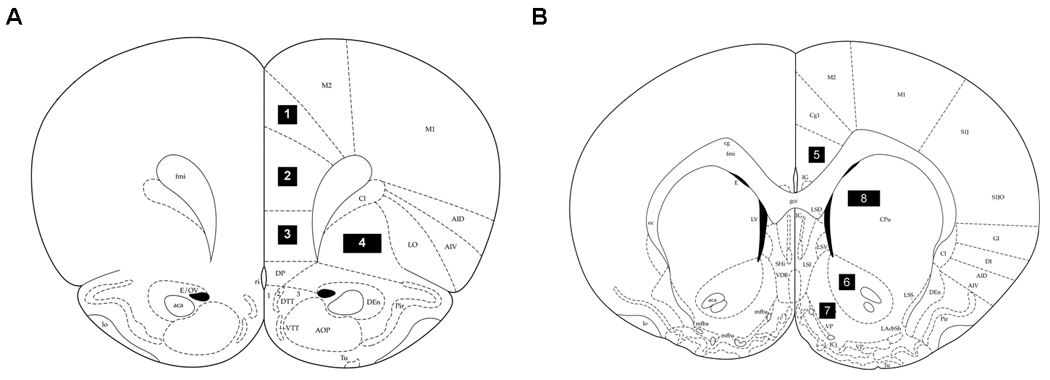
Schematic representation of coronal sections of the rat brain taken at (A) +3.2 and (B) +1.6 mm from Bregma (Paxinos and Watson,1998) illustrating the regions in this study as follows: (1) Cg1 region of the anterior cingulate cortex (Cg1); (2) prelimbic cortex (PrL); (3) infralimbic cortex (IL); (4) orbital cortex (Orb); (5) Cg2 region of the anterior cingulate cortex (Cg2); (6) nucleus accumbens core (NAcC); (7) nucleus accumbens shell (NAcS); (8) dorsal caudate/putamen (dCPu). All sample areas were 0.26 mm2, except for Orb and dCPu, which were sampled with 0.52 mm2 areas.
Figure 2.
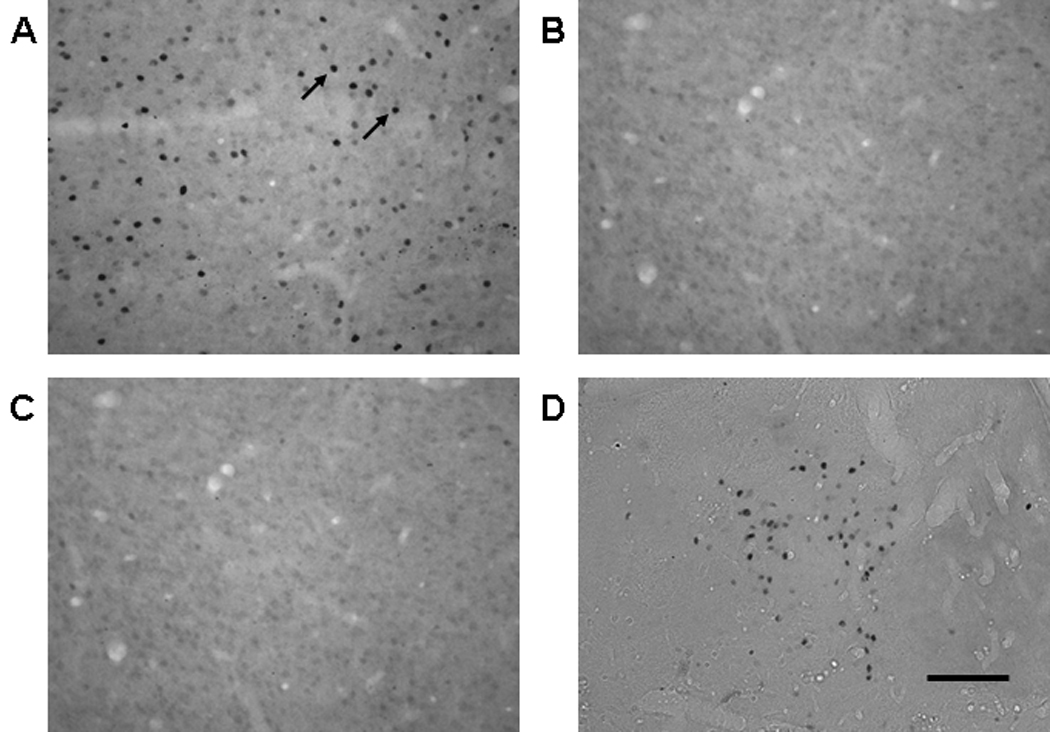
Representative photomicrographs of Fos protein expression in the IL from a rat in (A) the COC-NoA group, (B) the Sal-NoA group and (C) the COC-Chloralose group in Experiment 1. Also pictured (D) is a representative photomicrograph taken from the mediodorsal thalamus of a rat in the COC-Chloralose group. Visible Fos protein expression was manifested as dark ovals (highlighted by arrows). All images were taken at 20× magnification. Scale bar is equal to 100 µm.
Figure 3.
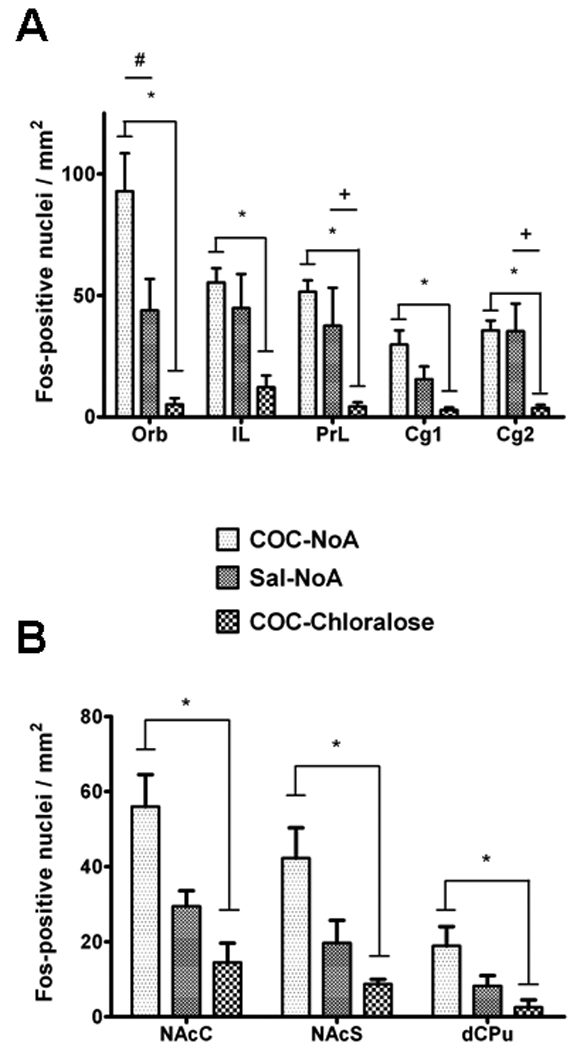
Number of Fos-positive nuclei/mm2 in cortical (A) and striatal (B) regions of rats in Experiment 1. Rats received either cocaine while nonanesthetized (COC-NoA group), saline while nonanesthetized (Sal-NoA group) and cocaine while under α-chloralose anesthesia (COC-Chloralose group). A * represents significantly greater Fos expression in the CoC-NoA group than the COC-Chloralose group (p < 0.05). A + represents significantly greater Fos expression in the Sal-NoA group versus the COC-Chloralose group (p < 0.05). A # represents significantly greater Fos expression in the COC-NoA group versus the Sal-NoA group (p < 0.05).
Statistical analysis
For Experiment 1, separate one-factor ANOVAs were used to analyze Fos protein expression for each region of interest, with treatment group (COC-NoA, Sal-NoA, COC-Chloralose) as the between-subjects factor. For Experiment 2, Fos protein expression was analyzed using 2 × 2 factorial ANOVAs for each region, with anesthetization state (nonanesthetized, anesthetized) and drug treatment (saline, cocaine) as between-subjects factors. Significant effects were further analyzed using Tukey’s HSD tests.
Results
Experiment 1
The use of α-chloralose anesthesia resulted in a dramatic suppression of Fos protein expression in all prefrontal cortical and striatal regions. In general, Fos expression was dense in the COC-NoA group (Fig. 2A), sparse in the Sal-NoA group (Fig. 2B) and almost completely suppressed in the COC-Chloralose group (Fig. 2C). Dense Fos expression was seen in trial images of the mediodorsal thalamus of the COC-Chloralose group (Fig. 2D), suggesting that α-chloralose reduction of Fos was specific to dopamine terminal regions. Analysis of the Fos-positive cells in the cortical regions (Fig. 3A) revealed a significant main effect of treatment in Orb (F2,13 = 12.0, p < 0.005), IL (F2,13 = 8.6, p < 0.005), PrL (F2,13 = 11.0, p < 0.005), Cg1 (F2,13 = 7.7, p < 0.01) and Cg2 (F2,13 = 10.0, p < 0.005). Fos expression in the COC-NoA group was significantly greater than in the COC-Chloralose group in all cortical regions (Tukey HSD tests, p < 0.05). Also, Fos expression was significantly greater in the COC-NoA group than the Sal-NoA group in Orb (Tukey HSD test, p < 0.05), but not in any of the other cortical regions. Fos expression in the Sal-NoA group was significantly greater than in the CoC-Chloralose group in PrL and Cg2 (Tukey HSD tests, p < 0.05), and exhibited a strong trend toward greater expression in IL (Tukey HSD test, p < 0.06). Analysis of Fos expression in the basal ganglia regions (Fig. 3B) also revealed a significant main effect of treatment in NAcC (F2,13 = 10.7, p < 0.005), NAcS (F2,13 = 9.2, p < 0.005) and dCPu (F2,13 = 5.4, p < 0.05). Fos expression in the COC-NoA group was significantly greater than the COC-Chloralose group in all basal ganglia regions (Tukey HSD tests, p < 0.05). Fos expression in the COC-NoA group exhibited a trend toward a difference from the Sal-NoA group in NAcC (Tukey HSD test, p < 0.07), but not in NAcS or dCPu. Fos protein expression in the COC-Chloralose group was significantly greater than in the COC-NoA group in the mediodorsal thalamus (data not shown; t15 = 3.8, p < 0.005), whereas Fos expression in this region was not significantly different between the COC-NoA and Sal-NoA groups.
Experiment 2
Isoflurane resulted in a partial and heterogeneous reduction of cocaine-induced Fos expression. For example, Fos expression in IL was dense in COC groups (Figs. 4A and 4C) and sparse in Sal groups (Figs. 4B and 4D), regardless of anesthetic condition. A main effect of anesthetic was observed for Fos expression in IL (F1,24 = 10.4, p < 0.005; Fig. 5A) and Cg2 (F1,24 = 9.9, p < 0.005). Similarly, main effects of injection, as well as anesthetic, respectively, were observed in Orb (F1,24 = 32, p < 0.001; F1,24 = 4.1, p = 0.055), PrL (F1,24 = 17.1, p < 0.001; F1,24 = 5.2, p < 0.05) and Cg2 (F1,24 = 15.4, p < 0.001; F1,24 = 8.6, p < 0.01). Additionally, an interaction between injection and anesthetic was observed in Cg1 (F1,24 = 6.1, p < 0.05). Post-hoc analysis of Cg1 Fos found a significant difference between the COC-NoA group and Sal-NoA group (Tukey’s HSD test, p < 0.005), but not for any other combination of groups. Main effects of injection, as well as anesthetic, respectively, were also observed in NAcC (F1,24 = 4.3, p < 0.05; F1,24 = 11.6, p < 0.005; Fig. 5B) and NAcS (F1,24 = 5.3, p < 0.05; F1,24 = 8.5, p < 0.01). A main effect of injection was also observed in dCPu (F1,24 = 19.3, p < 0.0001).
Figure 4.
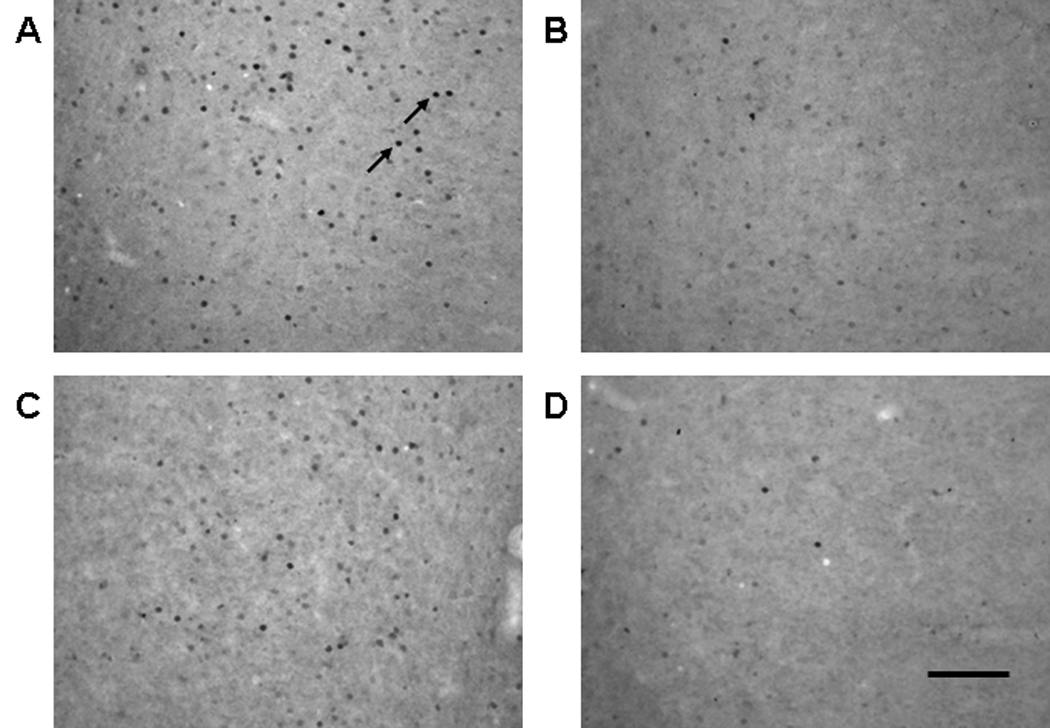
Representative photomicrographs of Fos protein expression in the IL from a rat in (A) the COC-NoA group, (B) the Sal-NoA group, (C) the COC-ISO group and (D) the Sal-ISO group in Experiment 2. Visible Fos protein expression was manifested as dark ovals (highlighted by arrows). All images were taken at 20× magnification. Scale bar is equal to 100 µm.
Figure 5.
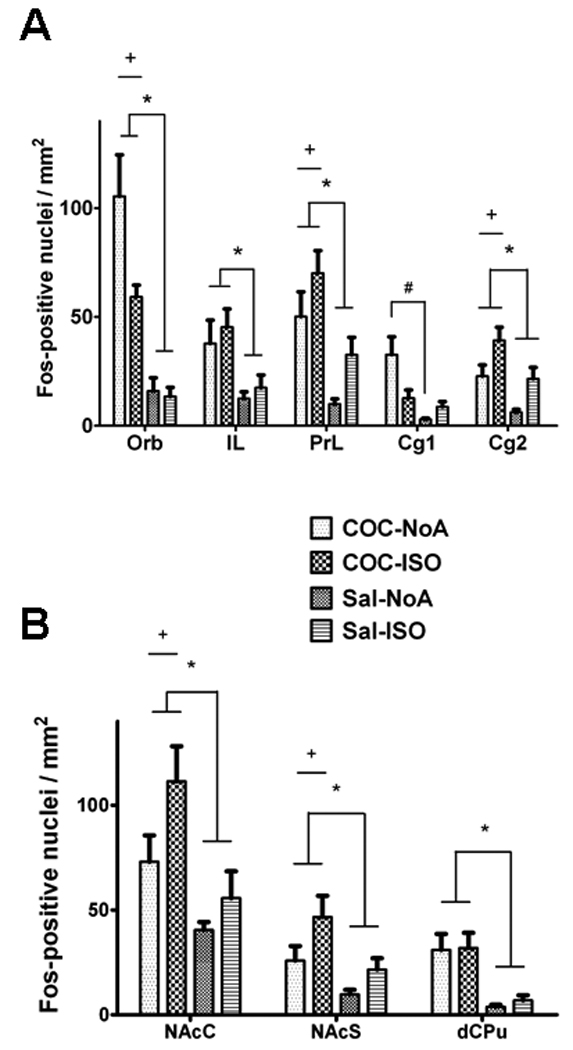
Number of Fos-positive nuclei/mm2 in cortical (A) and basal ganglia (B) regions of rats in Experiment 2. Groups of rats received cocaine while nonanesthetized (COC-NoA group), saline while nonanesthetized (Sal-NoA group), cocaine while under isoflurane anesthesia (COC-ISO group), saline while under isoflurane anesthesia (Sal-ISO group). A * represents a main effect of injected drug (p < 0.001), + represents a main effect of anesthetic treatment (p < 0.055) and # a significant difference in Fos expression between the COC-NoA group and the Sal-NoA group (p < 0.005).
Discussion
To our knowledge, this study constitutes the first comparison of cocaine-induced Fos expression in the prefrontal cortex and striatum under α-chloralose and isoflurane anesthesia. Both anesthetic regimens resulted in a reduction of cortical Fos expression, but striatal Fos expression was less affected under isoflurane. The α-chloralose maintenance dose of 36 mg/kg/h is considered light anesthesia for purposes of studying stimulated brain activity (Hyder et al., 2002), yet the Fos protein response to systemic cocaine injection was almost completely abolished. This result was anticipated by the lack of observed cocaine-induced cerebral blood volume changes under similar conditions in one study (Chen et al., 2000), but appears to contradict a recent finding of widespread cocaine-elicited brain activation (Lu et al., 2007). Lu and colleagues utilized systemically administered manganese ions, which accumulate in active neurons via calcium ion channels (Lin and Koretsky, 1997), and when these channels are open an increased c-fos expression ensues (Morgan and Curran, 1986). The manganese signal was also significant following a saline vehicle injection (Lu et al., 2007), and this measurement technique is highly sensitive to nonspecific stimuli, even in animals under α-chloralose anesthesia (Aoki et al., 2002). It remains a possibility that α-chloralose blocks those elements of the cocaine response that correlate with cortical and striatal c-fos expression, but retains others. For example, dense Fos expression in the mediodorsal thalamus was observed in the α-chloralose-treated subjects, suggesting that the somatosensory pathway often studied with this anesthetic (Duong et al., 2000; Hyder et al., 1994; Lee et al., 1999; Mandeville et al., 1998; Silva et al., 1999) was left functionally intact, if not activated.
The amount of Fos protein expression in the cortex of the Sal-NoA group in Experiment 1 was somewhat higher than expected. Despite this and the limited number of nonanesthetized subjects, cocaine-specific effects were observed in the nucleus accumbens, consistent with past c-fos and Fos studies (Graybiel et al., 1990; Hope et al., 1992). Although the absence of Fos expression is not necessarily indicative of low brain activity (Hope et al., 1992), Fos expression in the brain of an animal well-conditioned to its environment is generally expected to be quite low (Herdegen and Leah, 1998). The most likely explanation for the high Fos reactivity observed in Experiment 1 in the Sal-NoA rats is that habituation to the injection procedure occurred in the colony room in this study, rather than the environment that the rats were exposed to on the test day. The novelty of the test procedure may have induced some Fos expression. In contrast, rats in Experiment 2 were habituated to saline injections in alternative test chambers that were in the testing environment for each of the 5 days prior to the test day. This adjustment resulted in low Fos reactivity in nonanesthetized saline-treated animals.
In Experiment 2, isoflurane had no effect on cocaine-induced Fos expression in the IL and dCPu, and appeared to increase Fos expression on its own in the PrL, Cg2, and NAcS. The only regions exhibiting a reduction of cocaine-induced Fos expression were the Orb and Cg1 subregions of prefrontal cortex. Since cocaine-induced Fos expression has been shown to be dopamine-dependent in the striatum (Young et al., 1991), the fact that isoflurane did not significantly decrease Fos in the NAc or dCPu suggests that the dopaminergic response to cocaine in these regions was left intact. Preservation of cocaine-induced brain activity in the striatum has been used in the past to promote the use of halothane to investigate cocaine and other reinforcing drugs (Mandeville et al., 2001; Marota et al., 2000; Schwarz et al., 2004). The present findings suggest that isoflurane could be substituted for halothane with the advantage of less compromise of liver function.
The nonuniform influence of isoflurane on cocaine-elicited Fos protein expression could be evidence of a region-specific dependence between the mechanisms of cocaine and the molecular targets of isoflurane anesthesia, resulting in a somewhat skewed representation of the cocaine-induced brain activity. This finding is not surprising given that a positron emission tomography study in monkeys found that isoflurane anesthesia facilitates cocaine-induced inhibition of the dopamine transporter (Tsukada et al., 1999). A recent in vivo optical imaging study has found that cocaine increased intracellular calcium concentration in the rat brain under α-chloralose and isoflurane anesthesia, but this effect did not appear to be coupled with cocaine’s ability to interfere with dopamine or norepinephrine uptake (Du et al., 2006). Isoflurane itself has been shown to increase intracellular calcium ion concentrations in vitro (Iaizzo, 1992; Kindler et al., 1999). Other targets of isoflurane include GABAA receptors (Nishikawa et al., 2002), glycine receptors (Downie et al., 1996) and nicotinic acetylcholine receptors (Campagna et al., 2003). Therefore, our observation that isoflurane preserves much of the cocaine Fos response cannot be extended to other drugs of abuse, such as alcohol or nicotine, without additional experiments.
Cocaine-induced Fos has also been shown to be influenced by other anesthetic regimens in a number of previous studies. Striatal Fos was suppressed by ketamine/xylazine when injected before, but not after, systemic cocaine administration (Torres and Rivier, 1993). This effect was probably not associated with changes in cocaine-induced changes in dopamine uptake (Torres et al., 1994), implying that the lack of impact on striatal dopamine by α-chloralose anesthesia (Massott and Longo, 1978) might not translate into a preserved Fos response to cocaine. Sodium pentobarbital treatment strongly reduced the Fos response to cocaine throughout the brain (Ryabinin et al., 2000). Both chloral hydrate and urethane severely attenuated cocaine-elicited Fos expression in the striatum, by reducing glutametergic neurotransmission (Kreuter et al., 2004). Any of the wide variety of general anesthetics used in animal FMRI experiments (Steward et al., 2005) can therefore be expected to have some impact on the Fos response to systemic cocaine.
Fos protein immunohistochemistry has been repeatedly used to verify the presence and spatial localization of FMRI measurements of brain and spinal cord activity (Dashti et al., 2005; Lawrence et al., 2004; Liu et al., 2004; Lu et al., 2004). These studies considered c-fos expression to be a well-established marker of neural activity for somatosensory stimulation (Melzer and Steiner, 1997; Morgan and Curran, 1995; Sagar et al., 1988). Throughout the last decade, c-fos expression has also become an important probe of brain activity elicited by cocaine and other psychoactive drugs (Cohen et al., 1990; Graybiel et al., 1990; Neisewander et al., 2000; Patel and Hillard, 2003; Young et al., 1991). Pharmacological FMRI studies of brain function have also been utilized in conjunction with Fos, but in separate animal cohorts (Kalisch et al., 2004; Stark et al., 2006). Because peak Fos protein expression occurs 90 min to 2 h following acute drug stimulation (Moratalla et al., 1993), future animal imaging experiments should be able to measure both Fos and FMRI probes by harvesting the brains of the anesthetized rats immediately following the scan session. The results of this study suggest that use of isoflurane, but not α-chloralose, anesthesia creates an animal model that retains some brain sensitivity to systemic cocaine administration.
Acknowledgements
The authors thank Dr. Arturo Zavala and Kenneth Thiel for help with surgeries, Felicia D. Duke for help installing the isoflurane system and Valeria Routt, Krystle Kern and Maggie Chung for data analysis and other technical contributions.
Grant Support: R01 DA11064, F32 DA021485
Footnotes
Publisher's Disclaimer: This is a PDF file of an unedited manuscript that has been accepted for publication. As a service to our customers we are providing this early version of the manuscript. The manuscript will undergo copyediting, typesetting, and review of the resulting proof before it is published in its final citable form. Please note that during the production process errors may be discovered which could affect the content, and all legal disclaimers that apply to the journal pertain.
Conflict of Interest Statement:The authors have no conflicts of interest.
References
- Aoki I, Tanaka C, Takegami T, Ebisu T, Umeda M, Fukunaga M, Fukuda K, Silva AC, Koretsky AP, Naruse S. Dynamic activity-induced manganese-dependent contrast magnetic resonance imaging (DAIM MRI) Magn Reson Med. 2002;48:927–933. doi: 10.1002/mrm.10320. [DOI] [PubMed] [Google Scholar]
- Austin VC, Blamire AM, Allers KA, Sharp T, Styles P, Matthews PM, Sibson NR. Confounding effects of anesthesia on functional activation in rodent brain: a study of halothane and alpha-chloralose anesthesia. NeuroImage. 2005;24:92–100. doi: 10.1016/j.neuroimage.2004.08.011. [DOI] [PubMed] [Google Scholar]
- Breiter HC, Gollub RL, Weisskoff RM, Kennedy DN, Makris N, Berke JD, Goodman JM, Kantor HL, Gastfriend DR, Riorden JP, Mathew RT, Rosen BR, Hyman SE. Acute effects of cocaine on human brain activity and emotion. Neuron. 1997;19:591–611. doi: 10.1016/s0896-6273(00)80374-8. [DOI] [PubMed] [Google Scholar]
- Brown EE, Robertson GS, Fibiger HC. Evidence for conditional neuronal activation following exposure to a cocaine-paired environment: role of forebrain limbic structures. J Neurosci. 1992;12:4112–4121. doi: 10.1523/JNEUROSCI.12-10-04112.1992. [DOI] [PMC free article] [PubMed] [Google Scholar]
- Campagna JA, Miller KW, Forman SA. Mechanisms of actions of inhaled anesthetics. N Engl J Med. 2003;348:2110–2124. doi: 10.1056/NEJMra021261. [DOI] [PubMed] [Google Scholar]
- Chen YI, Mandeville JB, Marota JJ, Nguyen TV, Green AR, Jenkins BG. Anesthetic filters for eliciting specific neurotransmitter effects in pharmacologic MRI. ISMRM. 2000:967. [Google Scholar]
- Cohen BM, Nguyen TV, Hyman SE. Cocaine-induced changes in gene expression in rat brain. NIDA Res Monogr. 1990;105:175–181. [PubMed] [Google Scholar]
- Crombag HS, Jedynak JP, Redmond K, Robinson TE, Hope BT. Locomotor sensitization to cocaine is associated with increased Fos expression in the accumbens, but not in the caudate. Behav Brain Res. 2002;136:455–462. doi: 10.1016/s0166-4328(02)00196-1. [DOI] [PubMed] [Google Scholar]
- Dashti M, Geso M, Williams J. The effects of anaesthesia on cortical stimulation in rats: a functional MRI study. Australasian physical & engineering sciences in medicine / supported by the Australasian College of Physical Scientists in Medicine and the Australasian Association of Physical Sciences in Medicine. 2005;28:21–25. doi: 10.1007/BF03178860. [DOI] [PubMed] [Google Scholar]
- Downie DL, Hall AC, Lieb WR, Franks NP. Effects of inhalational general anaesthetics on native glycine receptors in rat medullary neurones and recombinant glycine receptors in Xenopus oocytes. Br J Pharmacol. 1996;118:493–502. doi: 10.1111/j.1476-5381.1996.tb15430.x. [DOI] [PMC free article] [PubMed] [Google Scholar]
- Dragunow M, Faull R. The use of c-fos as a metabolic marker in neuronal pathway tracing. J Neurosci Methods. 1989;29:261–265. doi: 10.1016/0165-0270(89)90150-7. [DOI] [PubMed] [Google Scholar]
- Du C, Yu M, Volkow ND, Koretsky AP, Fowler JS, Benveniste H. Cocaine increases the intracellular calcium concentration in brain independently of its cerebrovascular effects. J Neurosci. 2006;26:11522–11531. doi: 10.1523/JNEUROSCI.3612-06.2006. [DOI] [PMC free article] [PubMed] [Google Scholar]
- Duong TQ, Silva AC, Lee SP, Kim SG. Functional MRI of calcium-dependent synaptic activity: cross correlation with CBF and BOLD measurements. Magn Reson Med. 2000;43:383–392. doi: 10.1002/(sici)1522-2594(200003)43:3<383::aid-mrm10>3.0.co;2-q. [DOI] [PubMed] [Google Scholar]
- Ennulat DJ, Babb S, Cohen BM. Persistent reduction of immediate early gene mRNA in rat forebrain following single or multiple doses of cocaine. Brain Res Mol Brain Res. 1994;26:106–112. doi: 10.1016/0169-328x(94)90080-9. [DOI] [PubMed] [Google Scholar]
- Ferrario CR, Shou M, Samaha AN, Watson CJ, Kennedy RT, Robinson TE. The rate of intravenous cocaine administration alters c-fos mRNA expression and the temporal dynamics of dopamine, but not glutamate, overflow in the striatum. Brain research. 2008;1209:151–156. doi: 10.1016/j.brainres.2008.02.081. [DOI] [PMC free article] [PubMed] [Google Scholar]
- Graybiel AM, Moratalla R, Robertson HA. Amphetamine and cocaine induce drug-specific activation of the c-fos gene in striosome-matrix compartments and limbic subdivisions of the striatum. Proc Natl Acad Sci U S A. 1990;87:6912–6916. doi: 10.1073/pnas.87.17.6912. [DOI] [PMC free article] [PubMed] [Google Scholar]
- Hanusch C, Hoeger S, Beck GC. Anaesthesia of small rodents during magnetic resonance imaging. Methods. 2007;43:68–78. doi: 10.1016/j.ymeth.2007.05.009. [DOI] [PubMed] [Google Scholar]
- Herdegen T, Leah JD. Inducible and constitutive transcription factors in the mammalian nervous system: control of gene expression by Jun, Fos and Krox, and CREB/ATF proteins. Brain Res Brain Res Rev. 1998;28:370–490. doi: 10.1016/s0165-0173(98)00018-6. [DOI] [PubMed] [Google Scholar]
- Hope B, Kosofsky B, Hyman SE, Nestler EJ. Regulation of immediate early gene expression and AP-1 binding in the rat nucleus accumbens by chronic cocaine. Proc Natl Acad Sci U S A. 1992;89:5764–5768. doi: 10.1073/pnas.89.13.5764. [DOI] [PMC free article] [PubMed] [Google Scholar]
- Hope BT, Simmons DE, Mitchell TB, Kreuter JD, Mattson BJ. Cocaine-induced locomotor activity and Fos expression in nucleus accumbens are sensitized for 6 months after repeated cocaine administration outside the home cage. Eur J Neurosci. 2006;24:867–875. doi: 10.1111/j.1460-9568.2006.04969.x. [DOI] [PubMed] [Google Scholar]
- Hyder F, Behar KL, Martin MA, Blamire AM, Shulman RG. Dynamic magnetic resonance imaging of the rat brain during forepaw stimulation. J Cereb Blood Flow Metab. 1994;14:649–655. doi: 10.1038/jcbfm.1994.81. [DOI] [PubMed] [Google Scholar]
- Hyder F, Rothman DL, Shulman RG. Total neuroenergetics support localized brain activity: implications for the interpretation of fMRI. Proc Natl Acad Sci U S A. 2002;99:10771–10776. doi: 10.1073/pnas.132272299. [DOI] [PMC free article] [PubMed] [Google Scholar]
- Hyman SE, Nestler EJ. Principles of molecular biology. In: Charney DS, Nestler EJ, editors. Neurobiology of mental illness. New York: Oxford University Press; 2004. pp. 76–86. [Google Scholar]
- Iaizzo PA. The effects of halothane and isoflurane on intracellular Ca2+ regulation in cultured cells with characteristics of vascular smooth muscle. Cell Calcium. 1992;13:513–520. doi: 10.1016/0143-4160(92)90019-o. [DOI] [PubMed] [Google Scholar]
- Kaczmarek L, Siedlecki JA, Danysz W. Proto-oncogene c-fos induction in rat hippocampus. Brain research. 1988;427:183–186. doi: 10.1016/0169-328x(88)90064-2. [DOI] [PubMed] [Google Scholar]
- Kalisch R, Salome N, Platzer S, Wigger A, Czisch M, Sommer W, Singewald N, Heilig M, Berthele A, Holsboer F, Landgraf R, Auer DP. High trait anxiety and hyporeactivity to stress of the dorsomedial prefrontal cortex: a combined phMRI and Fos study in rats. NeuroImage. 2004;23:382–391. doi: 10.1016/j.neuroimage.2004.06.012. [DOI] [PubMed] [Google Scholar]
- Kindler CH, Eilers H, Donohoe P, Ozer S, Bickler PE. Volatile anesthetics increase intracellular calcium in cerebrocortical and hippocampal neurons. Anesthesiology. 1999;90:1137–1145. doi: 10.1097/00000542-199904000-00029. [DOI] [PubMed] [Google Scholar]
- Kreuter JD, Mattson BJ, Wang B, You ZB, Hope BT. Cocaine-induced Fos expression in rat striatum is blocked by chloral hydrate or urethane. Neuroscience. 2004;127:233–242. doi: 10.1016/j.neuroscience.2004.04.047. [DOI] [PubMed] [Google Scholar]
- Kufahl PR, Li Z, Risinger RC, Rainey CJ, Wu G, Bloom AS, Li SJ. Neural responses to acute cocaine administration in the human brain detected by fMRI. Neuroimage. 2005;28:904–914. doi: 10.1016/j.neuroimage.2005.06.039. [DOI] [PubMed] [Google Scholar]
- Lawrence J, Stroman PW, Bascaramurty S, Jordan LM, Malisza KL. Correlation of functional activation in the rat spinal cord with neuronal activation detected by immunohistochemistry. NeuroImage. 2004;22:1802–1807. doi: 10.1016/j.neuroimage.2004.04.001. [DOI] [PubMed] [Google Scholar]
- Lee SP, Silva AC, Ugurbil K, Kim SG. Diffusion-weighted spin-echo fMRI at 9.4 T: microvascular/tissue contribution to BOLD signal changes. Magn Reson Med. 1999;42:919–928. doi: 10.1002/(sici)1522-2594(199911)42:5<919::aid-mrm12>3.0.co;2-8. [DOI] [PubMed] [Google Scholar]
- Lin YJ, Koretsky AP. Manganese ion enhances T1-weighted MRI during brain activation: an approach to direct imaging of brain function. Magn Reson Med. 1997;38:378–388. doi: 10.1002/mrm.1910380305. [DOI] [PubMed] [Google Scholar]
- Lindauer U, Villringer A, Dirnagl U. Characterization of CBF response to somatosensory stimulation: model and influence of anesthetics. The American journal of physiology. 1993;264:H1223–H1228. doi: 10.1152/ajpheart.1993.264.4.H1223. [DOI] [PubMed] [Google Scholar]
- Liu ZM, Schmidt KF, Sicard KM, Duong TQ. Imaging oxygen consumption in forepaw somatosensory stimulation in rats under isoflurane anesthesia. Magn Reson Med. 2004;52:277–285. doi: 10.1002/mrm.20148. [DOI] [PMC free article] [PubMed] [Google Scholar]
- Lu H, Patel S, Luo F, Li SJ, Hillard CJ, Ward BD, Hyde JS. Spatial correlations of laminar BOLD and CBV responses to rat whisker stimulation with neuronal activity localized by Fos expression. Magn Reson Med. 2004;52:1060–1068. doi: 10.1002/mrm.20265. [DOI] [PubMed] [Google Scholar]
- Lu H, Xi ZX, Gitajn L, Rea W, Yang Y, Stein EA. Cocaine-induced brain activation detected by dynamic manganese-enhanced magnetic resonance imaging (MEMRI) Proc Natl Acad Sci U S A. 2007;104:2489–2494. doi: 10.1073/pnas.0606983104. [DOI] [PMC free article] [PubMed] [Google Scholar]
- Mandeville JB, Jenkins BG, Chen YC, Choi JK, Kim YR, Belen D, Liu C, Kosofsky BE, Marota JJ. Exogenous contrast agent improves sensitivity of gradient-echo functional magnetic resonance imaging at 9.4 T. Magn Reson Med. 2004;52:1272–1281. doi: 10.1002/mrm.20278. [DOI] [PubMed] [Google Scholar]
- Mandeville JB, Jenkins BG, Kosofsky BE, Moskowitz MA, Rosen BR, Marota JJ. Regional sensitivity and coupling of BOLD and CBV changes during stimulation of rat brain. Magn Reson Med. 2001;45:443–447. doi: 10.1002/1522-2594(200103)45:3<443::aid-mrm1058>3.0.co;2-3. [DOI] [PubMed] [Google Scholar]
- Mandeville JB, Marota JJ, Kosofsky BE, Keltner JR, Weissleder R, Rosen BR, Weisskoff RM. Dynamic functional imaging of relative cerebral blood volume during rat forepaw stimulation. Magn Reson Med. 1998;39:615–624. doi: 10.1002/mrm.1910390415. [DOI] [PubMed] [Google Scholar]
- Marota JJ, Mandeville JB, Weisskoff RM, Moskowitz MA, Rosen BR, Kosofsky BE. Cocaine activation discriminates dopaminergic projections by temporal response: an fMRI study in Rat. NeuroImage. 2000;11:13–23. doi: 10.1006/nimg.1999.0520. [DOI] [PubMed] [Google Scholar]
- Massott M, Longo VG. alpha-Chloralose and the central dopaminergic system. J Pharm Pharmacol. 1978;30:667. doi: 10.1111/j.2042-7158.1978.tb13359.x. [DOI] [PubMed] [Google Scholar]
- Melzer P, Steiner H. Stimulus-dependent expression of immediate-early genes in rat somatosensory cortex. J Comp Neurol. 1997;380:145–153. doi: 10.1002/(sici)1096-9861(19970331)380:1<145::aid-cne11>3.0.co;2-z. [DOI] [PubMed] [Google Scholar]
- Moratalla R, Vickers EA, Robertson HA, Cochran BH, Graybiel AM. Coordinate expression of c-fos and jun B is induced in the rat striatum by cocaine. J Neurosci. 1993;13:423–433. doi: 10.1523/JNEUROSCI.13-02-00423.1993. [DOI] [PMC free article] [PubMed] [Google Scholar]
- Morgan JI, Curran T. Immediate-early genes: ten years on. Trends Neurosci. 1995;18:66–67. [PubMed] [Google Scholar]
- Morgan JI, Curran T. Role of ion flux in the control of c-fos expression. Nature. 1986;322:552–555. doi: 10.1038/322552a0. [DOI] [PubMed] [Google Scholar]
- Neisewander JL, Baker DA, Fuchs RA, Tran-Nguyen LT, Palmer A, Marshall JF. Fos protein expression and cocaine-seeking behavior in rats after exposure to a cocaine self-administration environment. J Neurosci. 2000;20:798–805. doi: 10.1523/JNEUROSCI.20-02-00798.2000. [DOI] [PMC free article] [PubMed] [Google Scholar]
- Nishikawa K, Jenkins A, Paraskevakis I, Harrison NL. Volatile anesthetic actions on the GABAA receptors: contrasting effects of alpha 1(S270) and beta 2(N265) point mutations. Neuropharmacology. 2002;42:337–345. doi: 10.1016/s0028-3908(01)00189-7. [DOI] [PubMed] [Google Scholar]
- Patel S, Hillard CJ. Cannabinoid-induced Fos expression within A10 dopaminergic neurons. Brain research. 2003;963:15–25. doi: 10.1016/s0006-8993(02)03797-6. [DOI] [PubMed] [Google Scholar]
- Paxinos G, Watson C. The Rat Brain in Stereotaxic Coordinates. San Diego, CA: Academic Press; 1998. [Google Scholar]
- Ryabinin AE, Wang YM, Bachtell RK, Kinney AE, Grubb MC, Mark GP. Cocaine- and alcohol-mediated expression of inducible transcription factors is blocked by pentobarbital anesthesia. Brain Res. 2000;877:251–261. doi: 10.1016/s0006-8993(00)02681-0. [DOI] [PubMed] [Google Scholar]
- Sagar SM, Sharp FR, Curran T. Expression of c-fos protein in brain: metabolic mapping at the cellular level. Science. 1988;240:1328–1331. doi: 10.1126/science.3131879. [DOI] [PubMed] [Google Scholar]
- Samaha AN, Mallet N, Ferguson SM, Gonon F, Robinson TE. The rate of cocaine administration alters gene regulation and behavioral plasticity: implications for addiction. J Neurosci. 2004;24:6362–6370. doi: 10.1523/JNEUROSCI.1205-04.2004. [DOI] [PMC free article] [PubMed] [Google Scholar]
- Schwarz AJ, Zocchi A, Reese T, Gozzi A, Garzotti M, Varnier G, Curcuruto O, Sartori I, Girlanda E, Biscaro B, Crestan V, Bertani S, Heidbreder C, Bifone A. Concurrent pharmacological MRI and in situ microdialysis of cocaine reveal a complex relationship between the central hemodynamic response and local dopamine concentration. NeuroImage. 2004;23:296–304. doi: 10.1016/j.neuroimage.2004.05.001. [DOI] [PubMed] [Google Scholar]
- Silva AC, Lee SP, Yang G, Iadecola C, Kim SG. Simultaneous blood oxygenation level-dependent and cerebral blood flow functional magnetic resonance imaging during forepaw stimulation in the rat. J Cereb Blood Flow Metab. 1999;19:871–879. doi: 10.1097/00004647-199908000-00006. [DOI] [PubMed] [Google Scholar]
- Stark JA, Davies KE, Williams SR, Luckman SM. Functional magnetic resonance imaging and c-Fos mapping in rats following an anorectic dose of m-chlorophenylpiperazine. NeuroImage. 2006;31:1228–1237. doi: 10.1016/j.neuroimage.2006.01.046. [DOI] [PubMed] [Google Scholar]
- Steward CA, Marsden CA, Prior MJ, Morris PG, Shah YB. Methodological considerations in rat brain BOLD contrast pharmacological MRI. Psychopharmacology (Berl) 2005;180:687–704. doi: 10.1007/s00213-005-2213-7. [DOI] [PubMed] [Google Scholar]
- Storer RJ, Butler P, Hoskin KL, Goadsby PJ. A simple method, using 2-hydroxypropyl-beta-cyclodextrin, of administering alpha-chloralose at room temperature. J Neurosci Methods. 1997;77:49–53. doi: 10.1016/s0165-0270(97)00110-6. [DOI] [PubMed] [Google Scholar]
- Torres G, Rivier C. Cocaine-induced expression of striatal c-fos in the rat is inhibited by NMDA receptor antagonists. Brain Res Bull. 1993;30:173–176. doi: 10.1016/0361-9230(93)90055-g. [DOI] [PubMed] [Google Scholar]
- Torres G, Rivier C, Weiss F. A ketamine mixture anesthetic inhibits neuroendocrine and behavioral consequences of cocaine administration. Brain Res. 1994;656:33–42. doi: 10.1016/0006-8993(94)91363-3. [DOI] [PubMed] [Google Scholar]
- Tsukada H, Nishiyama S, Kakiuchi T, Ohba H, Sato K, Harada N, Nakanishi S. Isoflurane anesthesia enhances the inhibitory effects of cocaine and GBR12909 on dopamine transporter: PET studies in combination with microdialysis in the monkey brain. Brain research. 1999;849:85–96. doi: 10.1016/s0006-8993(99)02018-1. [DOI] [PubMed] [Google Scholar]
- Ueki M, Mies G, Hossmann KA. Effect of alpha-chloralose, halothane, pentobarbital and nitrous oxide anesthesia on metabolic coupling in somatosensory cortex of rat. Acta anaesthesiologica Scandinavica. 1992;36:318–322. doi: 10.1111/j.1399-6576.1992.tb03474.x. [DOI] [PubMed] [Google Scholar]
- Younes M, Heger B, Wilhelm KP, Siegers CP. Enhanced in vivo-lipid peroxidation associated with halothane hepatotoxicity in rats. Pharmacol Toxicol. 1988;63:52–56. doi: 10.1111/j.1600-0773.1988.tb00909.x. [DOI] [PubMed] [Google Scholar]
- Young ST, Porrino LJ, Iadarola MJ. Cocaine induces striatal c-fos-immunoreactive proteins via dopaminergic D1 receptors. Proc Natl Acad Sci U S A. 1991;88:1291–1295. doi: 10.1073/pnas.88.4.1291. [DOI] [PMC free article] [PubMed] [Google Scholar]