

Abstract
EphA2 gene silencing has been shown to result in anti-tumor efficacy. Here we considered whether silencing additional targets downstream of EphA2 would further enhance the therapeutic effect. EphA2 targeted siRNA was tested in combination with either FAK or Src targeted siRNA using DOPC nanoliposomes in orthotopic models of ovarian carcinoma. The effects of therapy were determined by changes in tumor weight, proliferation (Ki-67), and microvessel density (CD31). In our initial in vivo study, EphA2 plus FAK silencing resulted in the greatest reduction in tumor growth (by 73%, p < 0.005) as compared to control siRNA alone. In the SKOV3ip1 and HeyA8 ovarian cancer models, EphA2 siRNA-DOPC treatment resulted in a 50 to 67% decrease in tumor growth (p < 0.02, for both), and FAK siRNA-DOPC resulted in a 61 to 62% decrease in tumor growth (p < 0.009, p < 0.05, respectively). EphA2 plus FAK siRNA-DOPC treatment resulted in a significant reduction (SKOV3ip1: 76%, p < 0.007, HeyA8: 90%, p < 0.003) in tumor growth compared to control siRNA-DOPC. Combination treatment with EphA2 + FAK siRNA-DOPC resulted in significant decreases in tumor cell proliferation (p < 0.001) and microvessel density compared to control siRNA-DOPC (80%; p < 0.001), or the monotherapy groups (p values <0.001). These data suggest that the anti-tumor efficacy of in vivo EphA2 targeting is enhanced in combination with FAK silencing. Dual targeting of EphA2 and FAK may have therapeutic implications for ovarian cancer management.
Keywords: EphA2, FAK, ovarian cancer, siRNA therapy
Introduction
Ovarian cancer is the leading cause of death in women from gynecologic malignancies in the United States.1 Despite the effectiveness of surgery and chemotherapy for primary disease, recurrence is both common and deadly. Thus, new therapeutic targets and anti-tumor agents are urgently needed.
An emerging target of interest for novel therapeutic strategies is EphA2, a receptor tyrosine kinase (RTK) that belongs to the ephrin family. As part of the largest encoded family of tyrosine kinases, EphA2 plays a role in neuronal migration during development. However, it is largely absent in normal adult tissues.2-7 EphA2 is reported to be overexpressed in most cancers including lung, breast, ovary, prostate, colorectal, skin and esophagus.8-14 We have previously demonstrated that EphA2 is overexpressed in 76% of ovarian cancers.15 Moreover, EphA2 overexpression promotes tumor growth in ovarian carcinoma.16 Our group has also shown that targeting EphA2 inhibits ovarian cancer growth in orthotopic mouse models of ovarian carcinoma.12,17
Among the molecules downstream of EphA2, FAK and Src hold great importance in tumor progression and metastasis. Src is a nonreceptor tyrosine kinase, which has increased activation in a majority of ovarian cancers and it regulates intracellular signaling cascades responsible for critical tumor cell functions.18 FAK is also a non-receptor tyrosine kinase that is found localized to contact sites in focal adhesions.19,20 Overexpression of FAK protein has been reported in many human cancers including colorectal, breast, thyroid and prostate.21-25 Recently, FAK overexpression has also been reported in ovarian carcinoma, and this overexpression was associated with aggressive tumor features leading to shorter overall survival.26 Our group has additionally demonstrated that in vivo silencing of FAK with liposomal siRNA enhances the therapeutic efficacy of chemotherapy against ovarian carcinoma.27 In this study, we sought to examine whether dual targeting of EphA2 gene along with its downstream targets (FAK or Src) would result in greater anti-tumor activity in orthotopic mouse models of ovarian cancer.
Results
Effects of EphA2 targeted therapy
We have previously demonstrated that targeting EphA2 has anti-tumor activity in vivo using siRNA incorporated into neutral liposomes.17 Given that EphA2 has been shown to signal through either Src or FAK, we asked whether EphA2-targeting combinations might be more effective. HeyA8 bearing nude mice were randomly assigned to either of the following groups: Control siRNA-DOPC, EphA2 siRNA-DOPC, EphA2 plus FAK siRNA-DOPC and EphA2 plus Src siRNA-DOPC. In this preliminary study, treatment was only given for two weeks and mice were sacrificed. Among the treatment groups, EphA2 plus FAK siRNA-DOPC treatment resulted in the greatest reduction (by 73%, p < 0.005) in tumor growth compared to the control siRNA-DOPC group or the monotherapy groups (Fig. 1).
Figure 1.

EphA2 targeting in combination with FAK or Src gene silencing inhibits tumor growth in an orthotopic mouse model of ovarian carcinoma. HeyA8 cells were injected i.p. into female nude mice. Seven days later, treatment was started with twice weekly i.p. injections of control siRNA-DOPC, EphA2 siRNA-DOPC, EphA2 + FAK siRNA-DOPC or EphA2 + Src siRNA-DOPC. After two weeks of therapy, mice were sacrificed and tumor weights were recorded.
On the basis of these preliminary results, we performed additional experiments (4–5 weeks duration) targeting both EphA2 and FAK genes in vivo using two well established and highly aggressive ovarian cancer mouse models (HeyA8 and SKOV3ip1). Seven days after tumor cell injection, mice (n = 10 per group) were treated according to the following groups: control siRNA, EphA2 siRNA, FAK siRNA, or EphA2 plus FAK siRNA incorporated into neutral liposomes (DOPC). Immunohistochemistry was performed (Suppl. Fig. 1) to validate EphA2 and FAK silencing at the protein level in tumor tissues from mice that were treated with EphA2 or FAK siRNA-DOPC. In the HeyA8 model, EphA2 siRNA-DOPC resulted in a 67% (p < 0.02) and FAK siRNA-DOPC in a 62% (p < 0.05) decrease in tumor growth, while the combined EphA2 + FAK siRNA-DOPC treatment resulted in a 90% reduction in tumor growth (p < 0.003) compared to the control siRNA-DOPC group. Moreover, in the SKOV3ip1 model, EphA2 and FAK siRNA-DOPC resulted in a 50 to 61% decrease in tumor growth (p < 0.04, p < 0.009) while the combination group showed a significantly greater reduction in tumor growth (76% reduction, p < 0.007) compared to the control siRNA-DOPC group (Fig. 2). The EphA2 combinatorial target approach proved remarkably effective, demonstrating a 67 to 70% further reduction in tumor weight compared to the EphA2 or FAK siRNA-DOPC monotherapy (p < 0.05, both) in the HeyA8 model and a 52% greater decrease in tumor growth than EphA2 siRNA-DOPC treatment alone in the SKOV3ip1 model (p < 0.02).
Figure 2.

Effect of EphA2 and FAK gene targeting using siRNA incorporated into DOPC nanoliposomes in two orthotopic mouse models of ovarian cancer: HeyA8 (A) and SKOV3ip1 (B). Tumor weights were recorded at the time of mice sacrifice.
To determine if dual targeting of EphA2 and FAK genes resulted in reduced tumor metastasis, we analyzed the number of metastatic nodules from mice that were treated with either control siRNA-DOPC, EphA2 siRNA-DOPC, FAK siRNA-DOPC, or EphA2 + FAK siRNA-DOPC. In both SKOV3ip1 (Fig. 3) and HeyA8 models (data not shown), EphA2 siRNA-DOPC resulted in significant reduction (47 to 70%; p < 0.05, 0.004, respectively) in the number of tumor nodules. FAK siRNA-DOPC also effectively reduced the number of tumor nodules by 52 to 66% (p < 0.02, 0.01 for both models, respectively). Furthermore, the combination of EphA2 and FAK siRNA-DOPC produced the most significant decreases in tumor metastasis (62 to 82% reduction; p < 0.02, 0.01, respectively). This was a 21 to 29% further reduction in nodule count compared to the FAK siRNA-DOPC or EphA2 siRNA-DOPC monotherapy, respectively. However, these were statistically at parity with either treatment alone.
Figure 3.

Effects of combined EphA2 and FAK targeted therapy on number of tumor nodules. Using two highly aggressive orthotopic mouse models of ovarian carcinoma, EphA2 and FAK genes were either silenced alone or in combination with each other. Mice were sacrificed and the number of tumor nodules were recorded (SKOV3ip1 shown here).
Effects of EphA2 targeted therapy on proliferation, angiogenesis and apoptosis
EphA2 and FAK play key roles in tumor angiogenesis and proliferation; therefore, we examined the effects of dual therapy on these parameters. Ki-67 staining was preformed on paraffin-embedded tumor sections for all treatment groups (Fig. 4A). EphA2 or FAK siRNA-DOPC therapy resulted in moderate reductions (EphA2: 32%, p < 0.001, FAK: 34%, p < 0.001) in proliferation. The combined targeting of both FAK and EphA2 resulted in a 51% reduction in tumor cell proliferation (p < 0.001) compared to control group and 26 to 28% further reduction compared to either treatment alone (EphA2 or FAK siRNA-DOPC; p < 0.001, both).
Figure 4.

Effect of combined EphA2 and FAK silencing on proliferation, angiogenesis and apoptosis. Tissues harvested following EphA2 and FAK targeted therapy were subjected to immunohistochemistry for Ki-67 staining (A). The number of cancer cell nuclei strongly positive for Ki-67 were counted and divided by the total number of cells. Fresh frozen tissues from the same model were also subjected to CD31 staining (B) to allow identification of endothelial cells. A lumen with positive CD31 staining was counted as a single microvessel. Using fresh frozen tissues from five animals per treatment group immunofluorescence staining (C) with TUNEL (green) for apoptosis and Hoechst (blue) for nuclei was performed. At least three random fields per slide were examined using fluorescence microscopy and the number of apoptotic bodies and nuclei were recorded and are presented in average percent apoptotic cells. Representative images taken at 200× are presented from each group. In vitro Effects of EphA2 silencing on FAK expression (D). EphA2 gene was successfully silenced using EphA2 targeted siRNA in HeyA8 ovarian cancer cells and non-specific (non-targeted) siRNA was used in the control treatment group. Expression of EphA2, phospho-FAK and total FAK was analyzed using western blot. Beta-actin was used to confirm equal loading.
On the basis of our previous work related to reduced angiogenesis with EphA2 silencing,12,28 we next asked whether the decreases seen in tumor growth and metastasis in the combination treatment groups were secondary to inhibition of tumor-associated angiogenesis (Fig. 4B). MVD decreased by about 60% in the EphA2 or FAK siRNA-DOPC monotherapy groups (p < 0.001). Importantly, we noted an 80% reduction in the number of CD31 positive cells with the combination treatment compared to the control groups (p < 0.001), which was a 48 to 53% further reduction compared to either EphA2 or FAK siRNA-DOPC monotherapy groups (p < 0.001). We also assessed the degree of apoptosis in tumors harvested from mice in all four treatment groups (Fig. 4C). FAK or EphA2 siRNA-DOPC treatment resulted in modest increases in apoptosis compared to the control siRNA-DOPC (p < 0.001, both), while the combination treatment resulted in substantially higher apoptosis compared to the control siRNA-DOPC treatment (Fig. 4C and p < 0.001). Additionally, the increase in apoptosis seen in the combination group is also significantly greater than EphA2 or FAK siRNA-DOPC treatment (p < 0.001).
Targeting EphA2 does not affect the endogenous FAK gene expression levels
In order to determine whether silencing EphA2 affects FAK expression and activity, we silenced the EphA2 gene in vitro with EphA2 specific siRNA in an ovarian cancer cell line known to have high expression of EphA2 (HeyA8).29 Lysates from these EphA2 silenced cells were probed for total and phospho-FAK levels (Fig. 4D). We did not observe any decrease in total or phospho-FAK levels compared to the control cells. These findings suggest that FAK may be activated by other pathways as well and the non-overlapping functions with EphA2 may explain the enhanced therapeutic efficacy with targeting both genes.
Effects of dual EphA2 and FAK targeting on downstream signaling
Reverse phase protein arrays (RPPA) were performed to determine the effects of dual targeting of EphA2 and FAK on key downstream proteins (Fig. 5 and Suppl. Table 1) using tumor tissues from all four treatment groups. Overall, there were 14 proteins that had no change in their expression from the baseline level in the EphA2 siRNA-DOPC monotherapy group. In contrast, in the EphA2 plus FAK siRNA-DOPC group, all of the 76 proteins analyzed demonstrated a change from the baseline (Fig. 5A–C). Total Src levels were increased with EphA2 or FAK silencing alone while the combination treatment with EphA2 and FAK siRNA-DOPC resulted in a significant reduction in total Src levels compared to FAK siRNA-DOPC treatment (p < 0.05). B-RAF-pS445 did not show any change with EphA2 targeting from the base line, however, it was significantly higher with FAK siRNA DOPC or the combination treatment (p < 0.05). ETV6 (Alias TEL) levels were also increased significantly with EphA2 or FAK siRNA-DOPC treatment compared to control siRNA-DOPC. These levels were further increased in the combination treatment group compared to EphA2 or FAK siRNA alone.
Figure 5.
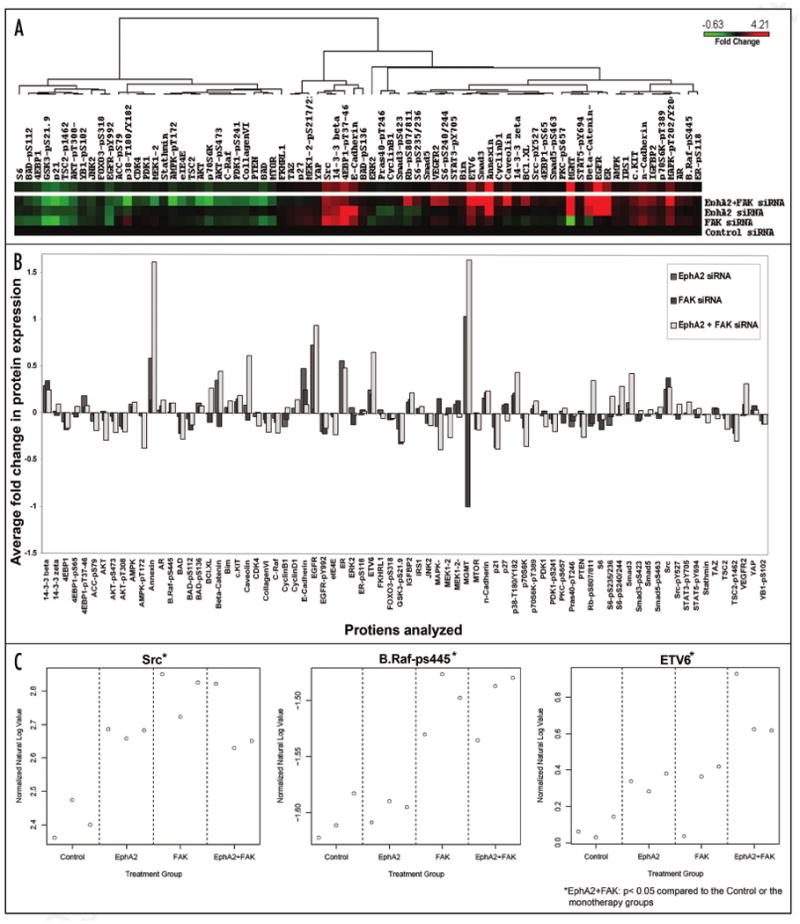
EphA2 signaling detected using Reverse Phase Protein Arrays (RPPA). Tumors from three mice each from the EphA2 siRNA-DOPC, FAK siRNA-DOPC and EphA2 + FAK siRNA-DOPC treated groups were collected and protein levels were compared with that of the Control siRNA-DOPC treatment group. RPPA Results are presented as average fold change in the levels of 76 different proteins analyzed. Using unsupervised clustering, heatmap (A) is presented as an average fold change in the protein levels tested from each treatment group. Average fold change (B) is presented in a bar graph format, and normalized natural Log values (C) are plotted for each of the four treatment groups for three selected proteins as an example.
Discussion
The key finding of this study is that EphA2 targeting when combined with FAK gene silencing results in substantively reduced in vivo ovarian cancer growth. In comparison to silencing of either target alone, the combination was superior in two aggressive orthotopic models, and demonstrates the “value-added” therapeutic potential of this strategy. While both FAK and Src operate downstream of EphA2, we saw no significant enhancement with EphA2 and Src combination when compared to EphA2 treatment alone. However, FAK and EphA2 gene silencing significantly reduced both tumor growth and metastasis; we postulate this effect is likely the result of observed substantial reductions in tumor cell proliferation and angiogenesis.
The Eph family was initially identified by Hirai et al. in the late 1980's30 which currently includes over 15 receptors and 9 ligands,6 and has been involved in many cell-signaling processes.31 Eph RTKs and their ligands were initially shown to be involved in the development of the nervous system where they guide axons and neural crest cell migration.6,32 However later studies link the Eph family receptors to cell positioning, cellular organization, vascular development and platelet aggregation.33 More recent studies show that ephrin signaling is implicated in pathologic vascular development, particularly in tumor angiogenesis.34
In this study, we asked whether the anti-tumor effects of EphA2 silencing in vivo can be enhanced by combining another target gene known to play a significant role in downstream oncogenic signaling. Targeting of the nonreceptor protein tyrosine kinase, FAK, resulted in the greatest reduction in tumor growth when combined with EphA2 silencing. FAK is known to play a critical role in tumor cell survival, migration and invasion.35-38 Recently, our group has shown successful knock-down of FAK gene using liposomal siRNA and demonstrated that FAK gene silencing resulted in reduced angiogenesis and tumor cell proliferation.27 Here, we show that the combined targeting of EphA2 and FAK enhances the efficacy of EphA2 targeted therapy in vivo using two highly aggressive orthotopic ovarian cancer models. Our findings confirm that targeting either EphA2 or FAK alone results in reduced angiogenesis.17,27 However, dual inhibition of FAK and EphA2 further decreases tumor microvessel density (angiogenesis), cell survival (increased apoptosis), tumor growth and metastasis. The improved anti-tumor efficacy we observed could be mediated by reduced levels of VEGF in the microenvironment.12 However, since FAK is a downstream target of EphA2 in some studies, it is possible that enhancement in the anti-tumor activity comes from enhanced regulation of this signaling pathway.
Others have shown that FAK, which is phosphorylated in response to EphA2 activation, may be activated by other stimuli.19 In this manner, EphA2-independent FAK activation may explain why targeting EphA2 alone can be enhanced by further regulation of FAK. This study demonstrates that dual targeting of EphA2 with FAK in vivo can significantly enhance the anti-tumor efficacy over EphA2 or FAK alone. These data suggest that although EphA2 activation can lead to increased FAK activation, other mediators likely activate FAK as well, and EphA2 blockade alone is not sufficient to ameliorate all the tumor-promoting effects of FAK. Our in vitro studies targeting EphA2 with siRNA did not show any effect on either total or phospho-FAK expression at the protein level. This suggests that FAK may not be directly activated by EphA2 in these cells. It is important to note that because both of these molecules play important roles in migration and angiogenesis, a more complex relationship between these proteins will likely exist in an in vivo setting than in vitro. Therefore, in vitro studies attempting to exploit this relationship will not fully define the importance of their synergy in vivo and in de novo cancers. Taken together, our findings highlight the benefit in targeting both genes concurrently, in that they not only have coordinated activity, but also have activity independent of one another.
In summary, this study provides further understanding of the complexity of tumor biology and how we can better hamper tumor growth and metastasis with combined targeted therapy against EphA2 and FAK. These findings may have therapeutic implications for ovarian caner management.
Materials and Methods
Cell culture and transfection
The ovarian cancer cell lines HeyA8 and SKOV3ip1s were maintained and propagated in vitro, as previously described.15,39 Briefly, HeyA8 and SKOV3ip1 cell lines were maintained in RPMI 1640 supplemented with 10% fetal bovine serum and 0.1% gentamicin sulfate (Gemini Bioproducts, Calabases, CA) in 5% CO2/95% air at 37°C. For in vitro experiments we used 70% confluency and transfections were done as previously described.39
Western blot analysis
Western blot analysis was performed as described previously.12 Briefly, lysates from cultured cells were prepared using modified RIPA buffer, the protein concentrations were determined using a BCA Protein Assay Reagent kit (Pierce Biotechnology, Rockford, IL). Lysates were loaded and separated on 8% sodium dodecyl sulfate—polyacrylamide gels. Proteins were transferred to a nitrocellulose membrane by semidry electrophoresis (Bio-Rad Laboratories, Hercules, CA) overnight, blocked with 5% milk and then incubated at 4°C with primary antibody (against EphA2, FAK or FAK(pY397) [BD Biosciences, San Jose, CA]), after washing with TBST, the membranes were incubated with 1 μg/mL horseradish peroxidase (HRP)—conjugated horse anti-mouse IgG (Amersham, Piscataway, NJ). HRP was visualized by use of an enhanced chemiluminescence detection kit (Pierce). To confirm equal sample loading, the blots were stripped and reprobed with an antibody specific for β-actin (0.1 μg/mL; Sigma).
Animals, orthotopic in vivo model and tissue processing
Female athymic nude mice were purchased from the National Cancer Institute, Frederick Cancer Research and Development Center (Frederick, MD). These animals were cared for according to guidelines set forth by the American Association for Accreditation of Laboratory Animal Care and the U.S. Public Health Service Policy on Human Care and Use of Laboratory Animals. All mouse studies were approved and supervised by the M.D. Anderson Cancer Center Institutional Animal Care and Use Committee. HeyA8 and SKOV3ip1 cells were trypsinized, washed and resuspended in Hanks' balanced salt solution (Gibco, Carlsbad, CA) and injected into mice (HeyA8: 5 × 10⁵ cells/animal, SKOV3ip1: 1.0 × 10⁶ cells/animal). Seven days after the tumor cell injection, mice were randomly divided and treated with siRNA incorporated in neutral nanoliposomes (intraperitoneal [IP] administration) according to the following groups (n = 10/group): control siRNA-DOPC, EphA2 siRNA-DOPC, EphA2 + FAK siRNA-DOPC and EphA2 + Src siRNA-DOPC. Twice weekly treatments continued for 3–4 weeks (HeyA8 and SKOV3ip1, respectively), at which point, all mice in the experiment were sacrificed and necropsied, and tumors were harvested. Tumor weights, number and location of tumor nodules, and presence of ascites were recorded. Tumor tissue was fixed in formalin for paraffin embedding, and frozen in optimal cutting temperature (OCT) media to prepare frozen slides, or snap frozen for lysate preparation as described above.
Small interfering RNA (siRNA) preparation
In order to downregulate EphA2, FAK and Src genes in vitro and in vivo, the respective siRNA was employed. Non-targeting, nonspecific sequence 5′-ATT TCT CCG AAC GTG TCA CGT-3′ was used as control, while previously well described specific sequences were utilized for EphA2 (5′-AAT GAC ATG CCG ATC TAC ATG-3′),17 FAK (5′-AAC CAC CTG GGC CAG TAT TAT-3′),39 and Src (5′-GGC UGA GGA GUG GUA UUU U-3′). These target specific siRNA's were purchased from Sigma-Aldrich and prepared as previously described.17,27 The lypophilized, DOPC incorporated siRNA was hydrated with PBS, and injected IP twice weekly following our previously published protocols40 at 5.0 μg siRNA/200 μL suspension per animal.
Immunohistochemistry (IHC)
IHC was performed as described previously.12,41 Briefly, tumor tissues were fixed in formalin and embedded with paraffin, or fixed and frozen in OCT. Slides were deparaffinized sequentially in xylene, 100% ethanol, 95% ethanol, 80% ethanol and PBS. Antigen retrieval was then performed by heating slides in a steam cooker for 10 minutes in 0.2 M Tris buffer, pH 9.0. CD31 was stained using frozen slides. These slides were fixed in cold acetone for 10 minutes and did not require antigen retrieval. Endogenous peroxide was blocked by adding 3% H2O2 in methanol for 8 minutes, and after washing, the nonspecific proteins were blocked using 5% normal horse serum and 1% normal goat serum in PBS for 15 minutes at room temperature. For Ki-67, EphA2, FAK or CD 31 staining, slides were incubated with primary antibody to Ki-67, EphA2, FAK or CD31 (PECAM-1, rat IgG, Pharmingen, San Diego, CA) in blocking solution overnight at 4°C. After washing with PBS, the appropriate HRP-conjugated secondary antibody in blocking solution was added for 1 hour at room temperature. Slides were stained with DAB substrate (Phoenix Biotechnologies, Huntsville, AL) and counterstained with Gil No.3 hematoxylin (Sigma). The intensity of protein expression was evaluated using OPTIMAS 6.5 software. To quantify MVD, the microvessels within five randomly selected 0.159-mm2 fields at ×100 were counted for each sample, a single microvessel was defined as a discrete cluster or at least 3 cells which stained positive for CD31 (CD31+). Ki-67, EphA2 and FAK staining was similarly quantified at ×100 in five randomly selected fields. Proliferation index was calculated by subtracting the number of Ki-67 positive (brown) nuclei from the negative (blue) nuclei and divided by the total number of cells.
Immunofluorescence staining
Terminal deoxynucleotidyl transferase-mediated deoxyuridine triphosphate nick-end labeling (TUNEL) staining was performed on fresh frozen tumor tissue (n = 5 per group) using Promega Kit (Promega, Medison, WI) as described previously.42 To quantify apoptotic cells, the number of TUNEL positive (green) cells were counted (and divided by the total number of cells in each field and multiplied by 100) in at least 3 random fields at 200× magnification, thus reported as percent TUNEL positive cells.
EPhA2 signaling detection by reverse phase protein arrays (RPPA)
Fresh frozen tumor tissues of 3 animals each from the Control siRNA-DOPC, EphA2 siRNA-DOPC, FAK siRNA-DOPC and EphA2 plus FAK siRNA-DOPC treatment groups were homogenized using a digital homogenizer in the following lysis buffer: 1% Triton X-100, 50 nM HEPES, pH 7.4, 150 mM MgCl2, 1 mM EGTA, 100 mM Naf, 10 mM Na pyrophosphate, 1 mM Na3VO4, 10% glycerol and freshly added protease and phosphatase inhibitors. Denaturing of cellular proteins was done using 1% SDS and five 2-fold serial dilutions were performed in lysis buffer containing 1% SDS (dilution buffer). These diluted lysates were arrayed on nitrocellulose-coated FAST slides (Whatman, Inc.,) using Aushon 2470 Arrayer (Aushon BioSystems). Slides were probed with 76 validated primary antibodies (Suppl. Table 1) and a biotin-conjugated secondary antibody. DakoCytomation-catalyzed system (Dako) was used to amplify the signal. DAB colorimetric reaction was used for visualization. Slides were then scanned, analyzed and quantified with the use of customized-software Microvigene (VigeneTech Inc.,) and spot intensity was generated. A logistical model (“Supercurve Fitting” developed by the Department of Bioinformatics and computational Biology at the M.D. Anderson Cancer Center, http://bioinformatics.mdanderson.org/OOMPA) was used to generate fitted curve for each dilution. For both observed and fitted, the fitted curve was then plotted with the signal intensities on y-axis and log2-concentration of proteins on the x-axis. From each slide, the protein concentrations were normalized using median polish. This was corrected across samples using linear expression values and the median expression levels of all antibody experiments and calculated a loading correction factor for each sample. All data presented is in fold-change compared to the baseline (control siRNA-DOPC treatment) values in Figure 5A and B. Positive fold-change was calculated by dividing each linear value (>1.0) with average control linear value for each antibody tested, while negative fold-change (for linear values <1.0) was also calculated (using the following formula: [-1/linear fold-change]) and plotted in a bar graph (Fig. 5B).
Statistical analyses
Differences in continuous variables were analyzed using Student's t test. A two tailed p value of <0.05 was considered statistically significant. Two-way ANOVA was performed to compare differences in all treatment groups for RPPA analysis. The Statistical Package for the Social Sciences (SPSS, SPSS Inc.,) was used for all statistical analyses.
Supplementary Material
Acknowledgments
M.M.S. is supported by the GCF-Molly Cade ovarian cancer research grant and the NIH/NICHD Baylor WRHR scholarship grant (HD050128). A.M.N. and R.L.S. are supported by a grant from the NCI (T32 training grant CA 101642). This research was funded in part by a Program Project Development Grant from the Ovarian Cancer Research Fund, Inc., the Zarrow Foundation, NIH grants (CA109298 and CA110793), the Marcus Foundation, the U.T.M.D. Anderson Cancer Center SPORE in Ovarian Cancer (P50 CA083639), and the Betty Ann Asche Murray Distinguished Professorship. The authors thank Dr. Robert Langley for helpful discussions, Donna Reynolds for assistance with immunohistochemistry and the functional RPPA Core (a core grant by the NCI [CA16672]) for assistance with RPPA.
Abbreviations
- FAK
focal adhesion kinase
- FBS
fetal bovine serum
- MVD
microvessel density
- VEGF
vascular endothelial growth factor
Footnotes
Note: Supplementary materials can be found at: www.landesbioscience.com/supplement/ShazadCBT8-11-Sup.pdf
References
- 1.Cancer Facts and Figures Atlanta. GA: American Cancer Society; 2007. [Google Scholar]
- 2.Unified nomenclature for Eph family receptors and their ligands, the ephrins. Eph Nomenclature Committee. Cell. 1997;90:403–4. doi: 10.1016/s0092-8674(00)80500-0. [DOI] [PubMed] [Google Scholar]
- 3.Chen J, Nachabah A, Scherer C, Ganju P, Reith A, Bronson R, et al. Germ-line inactivation of the murine Eck receptor tyrosine kinase by gene trap retroviral insertion. Oncogene. 1996;12:979–88. [PubMed] [Google Scholar]
- 4.Flanagan JG, Vanderhaeghen P. The ephrins and Eph receptors in neural development. Annu Rev Neurosci. 1998;21:309–45. doi: 10.1146/annurev.neuro.21.1.309. [DOI] [PubMed] [Google Scholar]
- 5.Gale NW, Holland SJ, Valenzuela DM, Flenniken A, Pan L, Ryan TE, et al. Eph receptors and ligands comprise two major specificity subclasses and are reciprocally compartmentalized during embryogenesis. Neuron. 1996;17:9–19. doi: 10.1016/s0896-6273(00)80276-7. [DOI] [PubMed] [Google Scholar]
- 6.Gale NW, Yancopoulos GD. Ephrins and their receptors: a repulsive topic? Cell Tissue Res. 1997;290:227–41. doi: 10.1007/s004410050927. [DOI] [PubMed] [Google Scholar]
- 7.Lindberg RA, Hunter T. cDNA cloning and characterization of eck, an epithelial cell receptor protein-tyrosine kinase in the eph/elk family of protein kinases. Mol Cell Biol. 1990;10:6316–24. doi: 10.1128/mcb.10.12.6316. [DOI] [PMC free article] [PubMed] [Google Scholar]
- 8.Andres AC, Reid HH, Zurcher G, Blaschke RJ, Albrecht D, Ziemiecki A. Expression of two novel eph-related receptor protein tyrosine kinases in mammary gland development and carcinogenesis. Oncogene. 1994;9:1461–7. [PubMed] [Google Scholar]
- 9.D'Amico TA, Aloia TA, Moore MB, Conlon DH, Herndon JE, 2nd, Kinch MS, et al. Predicting the sites of metastases from lung cancer using molecular biologic markers. Ann Thorac Surg. 2001;72:1144–8. doi: 10.1016/s0003-4975(01)02979-4. [DOI] [PubMed] [Google Scholar]
- 10.Duxbury MS, Ito H, Zinner MJ, Ashley SW, Whang EE. EphA2: a determinant of malignant cellular behavior and a potential therapeutic target in pancreatic adenocarcinoma. Oncogene. 2004;23:1448–56. doi: 10.1038/sj.onc.1207247. [DOI] [PubMed] [Google Scholar]
- 11.Kataoka H, Igarashi H, Kanamori M, Ihara M, Wang JD, Wang YJ, et al. Correlation of EPHA2 overexpression with high microvessel count in human primary colorectal cancer. Cancer Sci. 2004;95:136–41. doi: 10.1111/j.1349-7006.2004.tb03194.x. [DOI] [PMC free article] [PubMed] [Google Scholar]
- 12.Landen CN, Jr, Lu C, Han LY, Coffman KT, Bruckheimer E, Halder J, et al. Efficacy and antivascular effects of EphA2 reduction with an agonistic antibody in ovarian cancer. J Natl Cancer Inst. 2006;98:1558–70. doi: 10.1093/jnci/djj414. [DOI] [PubMed] [Google Scholar]
- 13.Walker-Daniels J, Coffman K, Azimi M, Rhim JS, Bostwick DG, Snyder P, et al. Overexpression of the EphA2 tyrosine kinase in prostate cancer. Prostate. 1999;41:275–80. doi: 10.1002/(sici)1097-0045(19991201)41:4<275::aid-pros8>3.0.co;2-t. [DOI] [PubMed] [Google Scholar]
- 14.Zelinski DP, Zantek ND, Stewart JC, Irizarry AR, Kinch MS. EphA2 overexpression causes tumorigenesis of mammary epithelial cells. Cancer Res. 2001;61:2301–6. [PubMed] [Google Scholar]
- 15.Thaker PH, Deavers M, Celestino J, Thornton A, Fletcher MS, Landen CN, et al. EphA2 expression is associated with aggressive features in ovarian carcinoma. Clin Cancer Res. 2004;10:5145–50. doi: 10.1158/1078-0432.CCR-03-0589. [DOI] [PubMed] [Google Scholar]
- 16.Lu C, Shahzad MM, Wang H, Landen CN, Kim SW, Allen J, et al. EphA2 overexpression promotes ovarian cancer growth. Cancer Biol Ther. 2008;7:1098–103. doi: 10.4161/cbt.7.7.6168. [DOI] [PMC free article] [PubMed] [Google Scholar]
- 17.Landen CN, Jr, Chavez-Reyes A, Bucana C, Schmandt R, Deavers MT, Lopez-Berestein G, et al. Therapeutic EphA2 gene targeting in vivo using neutral liposomal small interfering RNA delivery. Cancer Res. 2005;65:6910–8. doi: 10.1158/0008-5472.CAN-05-0530. [DOI] [PubMed] [Google Scholar]
- 18.Ishizawar R, Parsons SJ. c-Src and cooperating partners in human cancer. Cancer Cell. 2004;6:209–14. doi: 10.1016/j.ccr.2004.09.001. [DOI] [PubMed] [Google Scholar]
- 19.Schaller MD. Biochemical signals and biological responses elicited by the focal adhesion kinase. Biochim Biophys Acta. 2001;1540:1–21. doi: 10.1016/s0167-4889(01)00123-9. [DOI] [PubMed] [Google Scholar]
- 20.Schaller MD, Borgman CA, Cobb BS, Vines RR, Reynolds AB, Parsons JT. pp125FAK a structurally distinctive protein-tyrosine kinase associated with focal adhesions. Proc Natl Acad Sci USA. 1992;89:5192–6. doi: 10.1073/pnas.89.11.5192. [DOI] [PMC free article] [PubMed] [Google Scholar]
- 21.Ayaki M, Komatsu K, Mukai M, Murata K, Kameyama M, Ishiguro S, et al. Reduced expression of focal adhesion kinase in liver metastases compared with matched primary human colorectal adenocarcinomas. Clin Cancer Res. 2001;7:3106–12. [PubMed] [Google Scholar]
- 22.Cance WG, Harris JE, Iacocca MV, Roche E, Yang X, Chang J, et al. Immunohistochemical analyses of focal adhesion kinase expression in benign and malignant human breast and colon tissues: correlation with preinvasive and invasive phenotypes. Clin Cancer Res. 2000;6:2417–23. [PubMed] [Google Scholar]
- 23.Owens LV, Xu L, Craven RJ, Dent GA, Weiner TM, Kornberg L, et al. Overexpression of the focal adhesion kinase (p125FAK) in invasive human tumors. Cancer Res. 1995;55:2752–5. [PubMed] [Google Scholar]
- 24.Owens LV, Xu L, Dent GA, Yang X, Sturge GC, Craven RJ, et al. Focal adhesion kinase as a marker of invasive potential in differentiated human thyroid cancer. Ann Surg Oncol. 1996;3:100–5. doi: 10.1007/BF02409059. [DOI] [PubMed] [Google Scholar]
- 25.Tremblay L, Hauck W, Aprikian AG, Begin LR, Chapdelaine A, Chevalier S. Focal adhesion kinase (pp125FAK) expression, activation and association with paxillin and p50CSK in human metastatic prostate carcinoma. Int J Cancer. 1996;68:164–71. doi: 10.1002/(sici)1097-0215(19961009)68:2<169::aid-ijc4>3.0.co;2-w. [DOI] [PubMed] [Google Scholar]
- 26.Sood AK, Coffin JE, Schneider GB, Fletcher MS, DeYoung BR, Gruman LM, et al. Biological significance of focal adhesion kinase in ovarian cancer: role in migration and invasion. Am J Pathol. 2004;165:1087–95. doi: 10.1016/S0002-9440(10)63370-6. [DOI] [PMC free article] [PubMed] [Google Scholar]
- 27.Halder J, Kamat AA, Landen CN, Jr, Han LY, Lutgendorf SK, Lin YG, et al. Focal adhesion kinase targeting using in vivo short interfering RNA delivery in neutral liposomes for ovarian carcinoma therapy. Clin Cancer Res. 2006;12:4916–24. doi: 10.1158/1078-0432.CCR-06-0021. [DOI] [PMC free article] [PubMed] [Google Scholar]
- 28.Frisch SM, Ruoslahti E. Integrins and anoikis. Curr Opin Cell Biol. 1997;9:701–6. doi: 10.1016/s0955-0674(97)80124-x. [DOI] [PubMed] [Google Scholar]
- 29.Merritt WM, Thaker PH, Landen CN, Jr, Deavers MT, Fletcher MS, Lin YG, et al. Analysis of EphA2 expression and mutant p53 in ovarian carcinoma. Cancer Biol Ther. 2006;5:1357–60. doi: 10.4161/cbt.5.10.3225. [DOI] [PubMed] [Google Scholar]
- 30.Hirai H, Maru Y, Hagiwara K, Nishida J, Takaku F. A novel putative tyrosine kinase receptor encoded by the eph gene. Science. 1987;238:1717–20. doi: 10.1126/science.2825356. [DOI] [PubMed] [Google Scholar]
- 31.Murai KK, Pasquale EB. ‘Eph’ective signaling: forward, reverse and crosstalk. J Cell Sci. 2003;116:2823–32. doi: 10.1242/jcs.00625. [DOI] [PubMed] [Google Scholar]
- 32.Cheng N, Brantley DM, Liu H, Lin Q, Enriquez M, Gale N, et al. Blockade of EphA receptor tyrosine kinase activation inhibits vascular endothelial cell growth factor-induced angiogenesis. Mol Cancer Res. 2002;1:2–11. [PubMed] [Google Scholar]
- 33.Nakamoto M, Bergemann AD. Diverse roles for the Eph family of receptor tyrosine kinases in carcinogenesis. Microsc Res Tech. 2002;59:58–67. doi: 10.1002/jemt.10177. [DOI] [PubMed] [Google Scholar]
- 34.Brantley DM, Cheng N, Thompson EJ, Lin Q, Brekken RA, Thorpe PE, et al. Soluble Eph A receptors inhibit tumor angiogenesis and progression in vivo. Oncogene. 2002;21:7011–26. doi: 10.1038/sj.onc.1205679. [DOI] [PubMed] [Google Scholar]
- 35.Hsia DA, Mitra SK, Hauck CR, Streblow DN, Nelson JA, Ilic D, et al. Differential regulation of cell motility and invasion by FAK. J Cell Biol. 2003;160:753–67. doi: 10.1083/jcb.200212114. [DOI] [PMC free article] [PubMed] [Google Scholar]
- 36.Kohno M, Hasegawa H, Miyake M, Yamamoto T, Fujita S. CD151 enhances cell motility and metastasis of cancer cells in the presence of focal adhesion kinase. Int J Cancer. 2002;97:336–43. doi: 10.1002/ijc.1605. [DOI] [PubMed] [Google Scholar]
- 37.Schaller MD. The focal adhesion kinase. J Endocrinol. 1996;150:1–7. doi: 10.1677/joe.0.1500001. [DOI] [PubMed] [Google Scholar]
- 38.Sieg DJ, Hauck CR, Ilic D, Klingbeil CK, Schaefer E, Damsky CH, et al. FAK integrates growth-factor and integrin signals to promote cell migration. Nat Cell Biol. 2000;2:249–56. doi: 10.1038/35010517. [DOI] [PubMed] [Google Scholar]
- 39.Halder J, Landen CN, Jr, Lutgendorf SK, Li Y, Jennings NB, Fan D, et al. Focal adhesion kinase silencing augments docetaxel-mediated apoptosis in ovarian cancer cells. Clin Cancer Res. 2005;11:8829–36. doi: 10.1158/1078-0432.CCR-05-1728. [DOI] [PMC free article] [PubMed] [Google Scholar]
- 40.Landen CN, Jr, Lin YG, Armaiz Pena GN, Das PD, Arevalo JM, Kamat AA, et al. Neuroendocrine modulation of signal transducer and activator of transcription-3 in ovarian cancer. Cancer Res. 2007;67:10389–96. doi: 10.1158/0008-5472.CAN-07-0858. [DOI] [PubMed] [Google Scholar]
- 41.Lu C, Shen Q, DuPre E, Kim H, Hilsenbeck S, Brown PH. cFos is critical for MCF-7 breast cancer cell growth. Oncogene. 2005;24:6516–24. doi: 10.1038/sj.onc.1208905. [DOI] [PubMed] [Google Scholar]
- 42.Thaker PH, Yazici S, Nilsson MB, Yokoi K, Tsan RZ, He J, et al. Antivascular therapy for orthotopic human ovarian carcinoma through blockade of the vascular endothelial growth factor and epidermal growth factor receptors. Clin Cancer Res. 2005;11:4923–33. doi: 10.1158/1078-0432.CCR-04-2060. [DOI] [PubMed] [Google Scholar]
Associated Data
This section collects any data citations, data availability statements, or supplementary materials included in this article.