

Abstract
Background
Magnetic resonance microscopy (MRM), magnetic resonance imaging (MRI) at microscopic levels, provides unprecedented opportunities to aid in defining the full spectrum of ethanol’s insult to the developing brain. This is the first in a series of reports that, collectively, will provide an MRM-based atlas of developmental stage-dependent structural brain abnormalities in a Fetal Alcohol Spectrum Disorders (FASD) mouse model. The ethanol exposure time and developmental stage examined for this report is gestational day (GD) 8 in mice, when the embryos are at early neurulation stages; stages present in humans early in the fourth week postfertilization.
Methods
For this study, pregnant C57Bl/6J mice were administered an ethanol dosage of 2.8 g/kg intraperitoneally at 8 days, 0 hour and again at 8 days, 4 hours postfertilization. On GD 17, fetuses that were selected for MRM analyses were immersion fixed in a Bouin’s/Prohance solution. Control fetuses from vehicle-treated dams were stage-matched to those that were ethanol-exposed. The fetal mice were scanned ex vivo at 7.0 T and 512 · 512 · 1024 image arrays were acquired using 3-D spin warp encoding. The resulting 29 lm (isotropic) resolution images were processed using ITK-SNAP, a 3-D segmentation/visualization tool. Linear and volume measurements were determined for selected brain, head, and body regions of each specimen. Comparisons were made between control and treated fetuses, with an emphasis on determining (dis)proportionate changes in specific brain regions.
Results
As compared with controls, the crown-rump lengths of stage-matched ethanol-exposed GD 17 fetuses were significantly reduced, as were brain and whole body volumes. Volume reductions were notable in every brain region examined, with the exception of the pituitary and septal region, and were accompanied by increased ventricular volumes. Disproportionate regional brain volume reductions were most marked on the right side and were significant for the olfactory bulb, hippocampus, and cerebellum; the latter being the most severely affected. Additionally, the septal region and the pituitary were disproportionately large. Linear measures were consistent with those of volume. Other dysmorphologic features noted in the MR scans were choanal stenosis and optic nerve coloboma.
Conclusions
This study demonstrates that exposure to ethanol occurring in mice at stages corresponding to the human fourth week postfertilization results in structural brain abnormalities that are readily identifiable at fetal stages of development. In addition to illustrating the utility of MR microscopy for analysis of an FASD mouse model, this work provides new information that confirms and extends human clinical observations. It also provides a framework for comparison of structural brain abnormalities resulting from ethanol exposure at other developmental stages and dosages.
Keywords: Magnetic Resonance Microscopy, Fetal Alcohol Spectrum Disorders, Brain, Development, Mouse
The impact of prenatal alcohol exposure on the brain is becoming increasingly evident (Abel, 2006; May et al., 2006). Indeed, within Fetal Alcohol Spectrum Disorder (FASD, the umbrella term encompassing the spectrum of ethanol-related developmental abnormalities), which is estimated to occur in at least 1% of all births, central nervous system (CNS) abnormalities predominate. In spite of its prevalence, much remains to be learned regarding the structural and functional damage to the brain caused by maternal alcohol use; knowledge that can be applied to diagnosis, treatment and prevention.
The application of magnetic resonance imaging (MRI) to clinical FASD assessments is of great importance in filling the gaps in our understanding of alcohol-induced CNS dysmorphology. Results of MRI analyses of individuals with fullblown Fetal Alcohol Syndrome (FAS) were first reported in the early 1990s (Mattson et al., 1992, 1994; Riley et al., 1995).
Reductions in the size of the basal ganglia, the corpus callosum, and lobules I–V of the cerebellar vermis were observed. In addition to abnormal corpora callosa Swayze and colleagues (1997) found that patients diagnosed with FAS may also exhibit other midline brain abnormalities, such asseptum cavi pellucidi and cavum vergae. Another MRI-based study of the corpus callosum illustrated that changes occur in the shape of this fiber tract even in individuals without the facial features of FAS (Bookstein et al., 2002). Children exposed prenatally (either with or without a diagnosis of full FAS) have also been shown to have hypoplastic cerebellar vermis and hemispheres, as well as small hippocampi (Autti-Rämö et al., 2002). In MRI studies by Cortese and colleagues (2006), deficiencies involving the caudate nucleus have been documented in the absence of the full FAS phenotype. Recently, MRI studies of children with heavy prenatal alcohol exposure have also illustrated abnormal cortical thickness in temporal, parietal, and frontal cortical regions (Sowell et al., 2008).
Although human imaging studies continue to increase our knowledge of the range and pattern of ethanol-induced defects in humans, they cannot readily provide the controlled, rapid, and comprehensive analyses allowed by application of advanced imaging methodologies to studies of experimental animal models. Johnson and colleagues were the first to observe the utility of magnetic resonance microscopy (MRM) for studying anatomy in fixed tissues using MRI at microscopic levels (Johnson et al., 1993). These methods have recently been used to acquire a complete atlas of the mouse at gestational day (GD) 10.5 – postnatal day (PD) 32 (Petiet et al., 2008). Others have recently shown that a powerful use of MRM at a resolution of 25.4 · 25.4 · 26 lm is for high throughput, phenotype-driven screens for developmental malformations in mouse models of human birth defects (Schneider et al., 2004). This approach has, for example, provided sufficient detail to visualize and characterize abnormal cardiovascular anatomy in fetal mice, without the need for labor intensive histological sectioning. Herein, we present the results of a similar approach to the study of alcohol-induced structural brain abnormalities in an FASD model.
Numerous studies of FASD animal models have collectively illustrated that alcohol induces CNS abnormalities in a developmental-stage and dosage-dependent manner [National Institute on Alcohol Abuse and Alcoholism (NIAAA), 2000; Randall, 1987]. Major structural abnormalities, including those of the brain, are typically the result of insult during embryonic stages of development. Consequently, this developmental period has been initially targeted for MRI investigations. This work employs a C57Bl/6J mouse model that, following acute maternal ethanol administration at selected embryonic stages, has previously been shown to present with CNS abnormalities and all of the salient craniofacial features of FAS, as well as other stage-dependent abnormalities in other organ systems (Cook and Sulik, 1986; Cook et al., 1987; Daft et al., 1986; Dunty et al., 2001; Gage and Sulik, 1991; Kotch and Sulik, 1992; Kotch et al., 1992; Schambra et al., 1990; Sulik, 1984; Sulik and Johnston, 1982; Sulik et al., 1981; Webster et al.,1983). Importantly, the presence of externally visible anomalies of the face and eyes has previously been shown to be indicative of concurrent CNS insult in this acute exposure FASD model (Cook et al., 1987; Sulik, 2005; Sulik and Johnston, 1983).
Toward the long-term goal of identifying the full range of structural CNS defects that prenatal ethanol exposure can cause, we have initiated MRM analyses of animals that are expected to exhibit the severe end of the spectrum of insult. Identification of vulnerable brain regions in severely affected animals will, undoubtedly, provide clues that will facilitate discovery of more subtle manifestations of ethanol’s insult. This approach is similar to selecting children with known physical features of FAS for subsequent CNS studies.
Even though C57Bl/6J mice are inbred, an acute maternal dose of ethanol commonly yields considerable intra-litter variability with respect to degree of effect. For example, among a litter whose mother is given ethanol on just day 7 of her pregnancy, it is common for some pups to present with apparently normal craniofacies, while others have the typical facies of FAS, or of holoprosencephaly (Sulik and Johnston, 1982). That within a single litter (even among controls), there is a range of embryonic stages representing as much as 12 hours of development, probably explains a great deal of this phenotypic variability.
Frequently, the most severely affected pups in an ethanolexposed litter die (most likely, due to non-CNS-related defects) or are cannibalized by their mothers shortly after birth. With the hope of identifying even the most severe ethanol-induced structural brain abnormalities, it is, therefore, necessary to conduct prenatal examinations. Pilot feasibility studies utilizing a 7.0 T magnet have illustrated that GD 17, 2–3 days before birth, is an optimal time for MRM analyses of fetal mouse brains (Petiet et al., 2007). At this stage, the fetuses can be noninvasively fixed by immersion in a contrast-enhancing solution (Petiet et al., 2007) that affords very high-resolution (29 lm) imaging. Importantly, the imaging procedure is such that the scans are isotropic, thus allowing accurate 3-D reconstruction and subsequent volume assessments.
For this report, which is the first in a series that, collectively, is designed to provide an MRM-based atlas of developmental stage-dependent structural brain abnormalities in a FASD mouse model, the ethanol exposure time examined is GD 8. At this time of development, the embryos are at early neurulation stages; stages present in humans early in the fourth week postfertilization. Ex vivo MRM was conducted on developmental stage-matched control and ethanol-exposed GD 17 fetuses. The degree of brain development on GD 17 in mice corresponds approximately to that in weeks 12–13 in human fetuses (Clancy et al., 2007); a time when prenatal diagnostic imaging is feasible and is becoming increasingly common. The images acquired for this study were utilized to provide both linear and volumetric measures and to define the ethanol-induced collection of structural brain abnormalities.
Animal Maintenance
C57Bl/6J mice were purchased from The Jackson Laboratory (Bar Harbor, ME) and housed on a 12/12 hours light/dark cycle in a temperature and humidity controlled, AAALAC-approved environment. The mice were maintained on an ad lib diet of standard laboratory chow and water before and after treatment. Female mice were bred for a 2 hours period by placing 1–2 females with 1 male. Gestational day 0 was defined as the beginning of the breeding period in which a copulation plug was found.
Maternal Treatment Paradigm
On day 8 of pregnancy, mice were randomly assigned to either an ethanol or control group. The mice in the ethanol group were administered 2 intraperitoneal doses of 23.7% (v/v) ethanol (2.8 g/kg – each dose) on GD 8, 0 hour and GD 8, 4 hours. Control dams were administered volumes of Ringer’s solution (vehicle) equivalent to that given to the experimental group. To ascertain the peak blood ethanol concentration (BEC) achieved with this exposure regimen, a separate group of 6 mice were administered ethanol on their 8th day of pregnancy, utilizing the previously described paradigm. Thirty minutes after the last ethanol injection (Webster et al., 1983), 35 ll of tail blood was obtained from each dam and analyzed using an Analox Alcohol Analyser (Model AM1, Analox Instruments USA Inc., Lunenburg, MA). The average BEC was 381 ± 13 mg/dl ± SEM. All animal treatment protocols were approved by the University of North Carolina at Chapel Hill, Division of Laboratory Animal Medicine.
Fetal Specimen Preparation
At the beginning of GD 17, dams were anesthetized via CO2 asphyxiation, followed by cervical dislocation. Following laparotomy, the uteri were removed and the fetuses were immediately dissected free of decidua in ice-cold phosphate-buffered-saline (PBS). The fetuses were examined for the presence of grossly-detectable abnormalities, including ocular defects. For the ethanol group, selection for MRM scanning was based on identifiable ocular dysmorphology, a characteristic that is correlative with ethanol-induced CNS deficits in this mouse model (Cook et al., 1987; Sulik, 2005; Sulik and Johnston, 1983). Twenty-nine fetuses from 4 different litters were examined, and the 6 most severely affected (based on ocular abnormalities) were selected for the ethanol-exposed group. For the 6 fetuses (from 4 litters) in the control group, selection for MRM scanning was based on developmental stage-matching with the ethanol-exposed specimens. Staging was based on degree of limb, skin, and hair follicle development (Theiler, 1989). To avoid confounding variables, no more than 2 fetuses from each litter were selected. After taking photographs to document ocular abnormalities, the fetuses were fixed for 9 hours in a 20:1 solution of Bouin’s fixative (Sigma-Aldrich, St. Louis, MO) containing Prohance (Bracco Diagnostics Inc., Princeton, NJ) (Petiet et al., 2007). Following fixation, the specimens were rinsed briefly in PBS, and then placed in a holding solution of 200:1 PBS:Prohance. Typically, fetuses were imaged within 48 hours after fixation.
Magnetic Resonance Microscopy
All imaging was performed on a Magnex 7.0T/210 mm bore magnet interfaced to a GE EXCITE console (Epic 12.0) modified for MR microscopy. Specimens were placed in acrylic holders and surrounded with fomblin, a perfluorocarbon used to limit dehydration and reduce susceptibility artifacts. Images were acquired in a 20 mm diameter solenoid radiofrequency coil using a radiofrequency refocused spin echo sequence (TR=100ms, TE=6.2ms). Images were acquired with asymmetric partial Fourier sampling (Johnson et al., 2007) into a 512 · 512 · 1024 array resulting in Nyquist limited spatial resolution of 29 lm (voxel volumes of 25 pl). The total scan time was 4.1 hours for each specimen. Linear Measurements In order to ensure accurate orientation, each MRM scan was re-aligned in the horizontal, coronal, and sagittal plane using Image J (Version 1.38·, NIH; http://rsbweb.nih.gov/ij/). This program was also employed for ascertainment of linear measures. For each fetus, the following were determined: crown rump length, total head length (anterior to posterior), midsagittal brain length, frontothalamic distance, brain width (biparietal diameter), olfactory bulb length and width, ocular diameter, width of the third ventricle, septal region and pituitary gland, and transverse cerebellar distance (Fig. 1). With the exception of the optic globes, olfactory bulbs, pituitary and cerebellar diameters, the measurements were taken at the level of the anterior commissure. All other regions were measured at their widest level. In order to control for the overall ethanol-induced growth retardation of the brain, the measurements of specific neuroanatomical structures were normalized to the midsagittal brain length.
Fig. 1.

MRM scans illustrating sites of linear measurements made for GD 17 mouse fetuses. On the sagittal view shown in (A) the vertical line is placed at the location of the crown-rump measures, while the lines labeled b–e are at the sites of the corresponding horizontal scan images. The line in (B) is at the site used for cerebellar diameter determinations. In (C) the lines depict the following sites of measurement: third ventricle width (line #1); septal width (line #2); brain width (biparietal diameter) (line #3); frontothalamic distance (line #4); midsagittal brain length (line #5); head length (line #6). The lines in (D) illustrate sites of olfactory bulb width and length measures, and in (E) the line is located at the site of measurement for the optic globe diameter. Bar in (A) = 2 mm; bars in (B–E) = 1 mm.
Volume Measurements
Total body volume for each fetus was computed using the automatic segmentation feature of ITK-Snap, a software program originally developed at the University of North Carolina, Chapel Hill (Yushkevich et al., 2006; http://www.itksnap.org). Regional brain volumes for each specimen were also obtained using ITK-Snap. Selected regions were traced on the MRI slices via a computer mouse by a single expert trained on fetal mouse neuroanatomy. Horizontal, coronal, and sagittal planes were used to ensure anatomical accuracy (Fig. 2). Segmentation boundaries were based on existing fetal mouse atlases (Kaufman, 1992; Schambra, 2008; Schambra et al., 1992). For the following structures separate volume measurements were made: the right and left cortex, right and left striatum, right and left hippocampus, septal region, right and left olfactory bulb, diencephalon, mesencephalon, pons/medulla, cerebellum, pituitary gland, lateral ventricles, third ventricle, mesencephalic and fourth ventricle, right and left globe of the eye, and right and left lens. Volume measurements were automatically calculated via multiplication of the voxel number in each region by the voxel volume (29 lm3). Total brain volume was determined by summing the cumulative volumes of all brain regions. Intra-rater reliability was assessed following repeated segmentation of each of the selected structures in 1 control and 1 ethanol-exposed fetus.
Fig. 2.
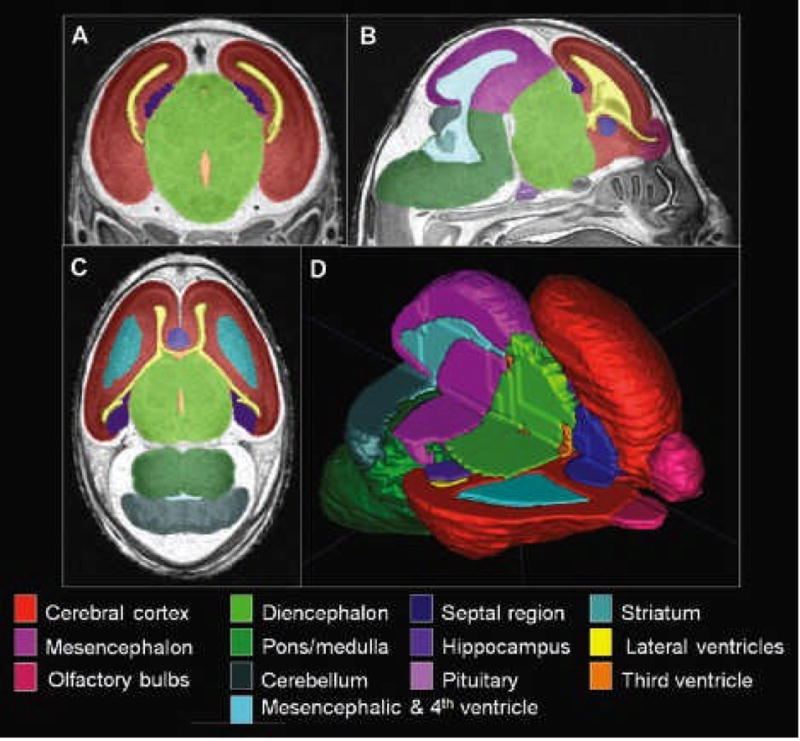
Regional segmentation of MRM scans. Images in A, B, and C are representative coronal, sagittal, and horizontal scans, respectively. Illustrated are color-coded regions that were manually segmented for each of the brains examined for this study. Computer-generated 3-D reconstruction of these regions provides a basis for volume determinations and for visualization of normal and abnormal morphology. Illustrated in (D) is a brain reconstruction with the upper portion of the right side removed, allowing visualization of interior structures.
Statistics
Crown-rump length and whole brain and body volume data were each analyzed using 2-tailed t-tests. Linear measurements and regional volumes were analyzed using repeated-measures ANOVAs. When applicable, post hoc analyses were performed using Fisher’s protected least significant difference. Intra-rater reliability was analyzed using intraclass correlation coefficients (ICC). All a levels were set at 0.05.
RESULTS
Linear Measurements
Average crown-rump lengths for the 6 GD 17 ethanolexposed fetuses and 6 developmentally stage-matched controls were 15.28 ± 0.53 [mean ± standard error of the mean (SEM)] and 16.65 ± 0.36, respectively; illustrating an 8.2% reduction in the crown-rump lengths for the experimental group (p < 0.05). The linear brain regional measurements were reduced to a degree corresponding to that of overall brain length, with the exception of transverse cerebellar distance and width of the third ventricle (Table 1). Following ethanol exposure, the cerebellum was disproportionately narrow, while the third ventricle was too wide. Ocular measures were consistent with gross anatomical assessments; those eyes that were determined at the dissecting microscopic level to be dysmorphic had cross-sectional globe and lens diameters that were abnormally small. The ocular defects ranged from anophthalmia to slightly aberrant pupil shape and/or size.
Table 1.
Data are reported as a percentage of the head length as measured anterioposteriorly and are ± the standard error of the mean. Range of measurements in each region and group is indicated in parentheses.
| Measurement | Control | EtOH-Exposed |
|---|---|---|
| Mid-sagittal brain length | 81.7 ± 0.8 (80.2–85.2) | 82.9 ± 0.8 (79.0–84.6) |
| Cortical brain width | 55.0 ± 0.6 (52.5–57.1) | 54.8 ± 0.5 (53.4–56.8) |
| Frontothalamic distance | 39.4 ± 0.2 (38.7–40.8) | 39.9 ± 0.6 (37.6–41.7) |
| Transverse cerebellar distance | 50.3 ± 0.4 (48.5–51.1) | 48.4 ± 0.2 (48.0–49.1)* |
| Olfactory bulb length | ||
| Right | 11.5 ± 0.3 (10.7–12.3) | 11.0 ± 0.4 (9.7–12.4) |
| Left | 11.5 ± 0.3 (10.4–12.3) | 10.7 ± 0.2 (9.9–11.3) |
| Olfactory bulb width | ||
| Right | 10.0 ± 0.1 (9.7–10.4) | 10.1 ± 0.3 (8.9–10.9) |
| Left | 10.1 ± 0.3 (9.3–11.1) | 10.5 ± 0.2 (10.0–11.3) |
| Septal region width | 13.5 ± 0.1 (13.2–13.9) | 14.1 ± 0.3 (13.2–14.8) |
| Pituitary gland width | 14.4 ± 0.4 (12.9–15.5) | 15.3 ± 0.2 (14.3–16.1) |
| Third ventricle width | 2.1 ± 0.001 (1.7–2.6) | 3.0 ± 0.002 (2.6–3.7)* |
| Ocular diameter | ||
| Right | 14.1 ± 0.1 (13.7–14.4) | 10.8 ± 2.3 (0–14.2) |
| Left | 14.1 ± 0.2 (13.1–14.8) | 13.8 ± 0.5 (11.5–15.1) |
= significant difference between ethanol-treated and controls. n = 6 specimens in each group.
Volume Measurements
Intra-rater reliability measurements were performed using intraclass correlation coefficients (ICC). The lowest ICC value over all regions was 0.990, with most of the brain regional ICC values above 0.995, thus demonstrating consistent MRI manual segmentation for all regions.
Total body volume was reduced by 25% in the ethanolexposed, as compared with the control fetuses (ethanol, 486 ± 33 mm3; control, 650 ± 44 mm3). As expected, based on linear and total body volume measures, the whole brain of each ethanol-exposed fetus was smaller than the stage matched controls. This volume reduction averaged 19.5% (p < 0.0001) and was reflected in significantly smaller volumes of the majority of individual brain regions assessed (p < 0.05). The exceptions were the septal region and pituitary, which had volumes similar to those in the control specimens, and the ventricles, which were larger than their control counterparts.
To control for the general ethanol-induced growth retardation, each separate region was normalized to its own total brain volume. This approach has the advantage of being able to ascertain selective regional vulnerability. After normalization, the repeated measures ANOVA showed a significant main effect of treatment [F(1, 200) = 25.99, p = 0.0005] and region [F(20, 200) = 4074.37, p < 0.0001] with a significant interaction between the two [F(20, 200) = 4.55, p < 0.0001]. Further post hoc analyses demonstrated that the right olfactory bulb, right hippocampus, and cerebellum were significantly smaller in the ethanol-exposed as compared with control fetuses, with the largest change being present in the cerebellum (Fig. 3). While reductions were noted in other brain regions as well, they did not reach statistical significance. In addition, the sizes of both ocular globes and lenses were reduced in the ethanol-exposed animals, with the right eyes being more severely affected than the left. These analyses also demonstrated that relative to overall brain volume, the septal region, pituitary, and ventricles were significantly larger as compared with the control group.
Fig. 3.
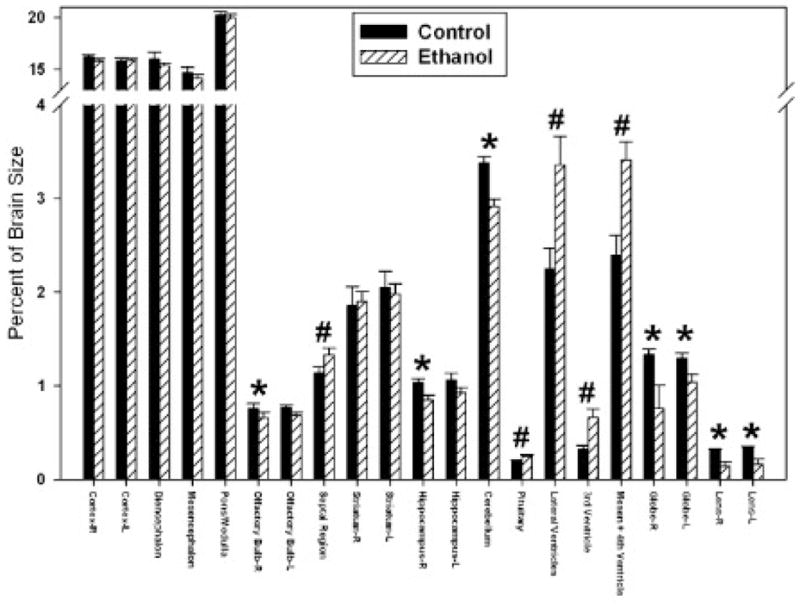
Graphic illustration of ethanol-induced proportional volume changes in GD 17 fetal mouse brain regions. Significant average volume reductions are indicated by (*), while increases are indicated by (#).
Morphology
Results of examinations of the 3-D reconstructions of the segmented brain regions are consistent with those for linear and volumetric measures. In addition, they have provided new insights as exemplified in Fig. 4. Images from a control (A–D) and an ethanol exposed (E–H) fetus include dorsal and ventral views of the whole brain, as well as ventral and posterior views of the ventricular system. Apparent in the brain of the ethanol-exposed fetus are distinctly separate cerebral hemispheres that, from a dorsal view, appear virtually the same as those of the control. However, from a ventral perspective, more of the septal region can be seen in the ethanolexposed specimen than in the control (arrow in F). Both the dorsal and ventral views show that the right olfactory bulb of the ethanol-exposed specimen is abnormally small.
Fig. 4.
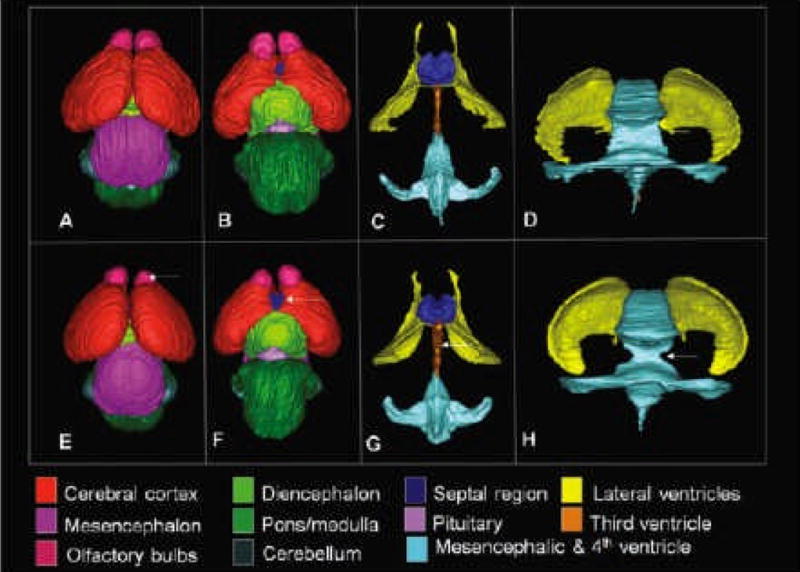
3-D reconstructions of control and ethanol-exposed GD 17 fetal mouse brain regions. As compared to the images of a normal brain (A–D), those from a fetus that had been acutely exposed to ethanol on GD 8 (E–F) illustrate a visibly small right olfactory bulb (arrow in E) and excessive space between the bulbs, a relatively large ventral midline view of the septal region (arrow in F); notable enlargement of the third ventricle (arrow in G) as observed from a ventral view of the reconstructed ventricular system; and narrowing of the cerebral aqueduct (arrow in H) as observed in a posterior view of the ventricular system.
The reconstructed images also greatly facilitate examination of the complex morphology of the ventricular system. Consistent with the volumetric analyses, as shown in Fig. 4G and 4H, all of the ventricular spaces in the ethanol-exposed fetus appear larger than in the control. This is particularly evident for the third ventricle, which is wider in the ethanolexposed specimens than in the control brains. This finding is also clearly shown in horizontal MRI scans (Fig. 5). Finally, a feature that, most likely, would not have been detected by examining individual scans or by using conventional morphological assessment methodologies is abnormal narrowing at the junction of the mesencephalic and fourth ventricle, as indicated by an arrow in Fig. 4H. This abnormality was present in 3 of the 6 ethanol-exposed fetuses. In addition to brain anomalies, in this study, MRI has provided new information regarding abnormalities in other cranial structures. Because the darkly pigmented eyes of the GD 17 fetal mice can be seen through the skin of the eyelids, structural anomalies can be ascertained at the dissecting microscopic level (Fig. 6B). Indeed, as previously noted, for the current investigation the presence of ocular abnormalities provided a basis for selection as a study subject. Among the 6 ethanol-exposed fetuses, 6 had readily notable unilateral and 5 had bilateral eye defects. These included 2 right eye colobomas, 2 left eye colobomas, and 1 mouse that was anophthalmic on the right. The right eyes in all of the ethanol-exposed specimens were at least slightly microphthalmic, whereas 5 of the 6 left eyes were at least slightly microphthalmic. The MRM findings were consistent with our gross visual assessments.
Fig. 5.
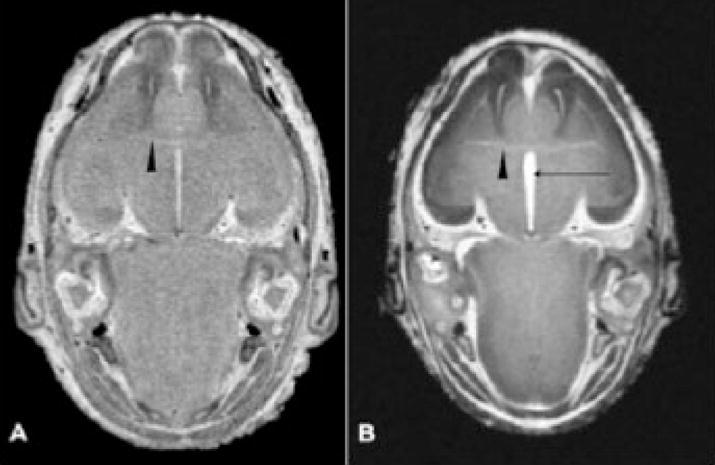
Horizontal MRM scans illustrate abnormalities in an ethanol exposed fetal brain (B) as compared with that of a control (A). At the level of the anterior commissure (arrowheads in A and B), the third ventricle (arrow in B) is notably larger in the ethanol-exposed fetus. Also notable is the abnormal right olfactory bulb.
Fig. 6.

Optic abnormalities and choanal stenosis in alcohol-exposed fetuses. Microphthalmia and irideo-retinal coloboma (arrow in B) are evident in GD 17 ethanol-exposed fetuses. [Compare the affected left eye in (B) to the normal left eye of a control GD 17 fetus in (A).] Additionally, MRM revealed an optic nerve coloboma in the right eye of an ethanol-exposed fetus (arrow in D). Of particular note is unilateral choanal stenosis in an alcohol-exposed fetus. A coronal MRM scan (C) at the level indicated by the line in (B) illustrates a pinhole-like opening (arrow), representing the extreme narrowing of the right choana. A horizontal scan (E) of the fetus in (C) illustrates the simple contours of the small right nasal cavity (arrow). This fetus also presented with anophthalmia on its right side.
In addition, MRM allowed detection of a coloboma extending along the optic nerve, all of the way to the optic chiasm (Fig. 6D). Although craniofacial defects, other than those involving the eyes, were not grossly notable in any of the fetuses examined, MRM revealed a very severe reduction in the size of the nasal cavity in 1 of the 6 ethanol-exposed fetuses examined. Sequential coronal scans of this fetus’ head showed extreme stenosis of the nasal passageway, with only a pinpoint opening at the location shown in Fig. 6C. The lateral walls of this small nasal cavity were simple and the nasal septum was deviated toward the small side (Fig. 6E).
DISCUSSION
Focusing on insults resulting from acute maternal ethanol exposure on GD 8 in mice, this report is the first in a series designed to provide MRM-based discovery and documentation of developmental stage-dependent structural brain abnormalities. As well as confirming an expected overall ethanol-induced growth retardation, these MRM-based linear and volumetric analyses have illustrated disproportionate reductions in the olfactory bulbs, hippocampus, and cerebellum; with the cerebellum being the most severely diminished. These regional size reductions are accompanied by increased ventricular volumes and a disproportionately large septal region and pituitary. In addition to quantitative data, MRM made possible the discovery of dysmorphology in the brains, as well as in other cranial structures, in ethanol-exposed fetuses.
As discussed below, the noted combination of defects is consistent with known human patterns/associations of birth defects and is informative for clinical diagnosis.
As illustrated here, MRM is remarkably effective for comprehensive structural analyses. Even though (because of the cost, the time required for scanning and manual segmentation along with the limited number of adequate MRM facilities and the expertise required to operate them), it remains impractical to analyze large numbers of animals with this technique, each animal can provide a vast amount of data. For the current work, by taking care to stage-match the control and experimental groups of fetuses, along with utilization of readily identifiable (ocular) defects as a screening mechanism for affected fetuses, the number of animals required for discovery of severe structural brain changes was minimized.
That ocular defects result from ethanol exposure at early developmental stages in mice is well documented (Cook and Sulik, 1986; Cook et al., 1987; Parnell et al., 2006). Indeed, insult occurring just as the developing eyes begin to form from the diencephalon has previously been shown to concurrently involve both the brain and eyes (Dunty et al., 2001). Noteworthy is that the eyes of individual fetuses are frequently asymmetrically affected and the results of this study suggest that the side on which the eye was most dysmorphic was consistent with that for the brain. This supports the use of ocular defects as an indicator of coexisting GD 8 ethanolinduced brain dysmorphology. Importantly, it also supports the premise that the reduced palpebral fissure length, a hallmark of full-blown FAS, is an indicator of reduced globe size (Parnell et al., 2006) and also reflects brain damage.
The results of previous studies that have explored the genesis of GD 8 ethanol exposure-induced defects support the current MRM-based findings. Sulik and colleagues (1986) and Kotch and Sulik (1992) utilized scanning electron microscopy to examine both the face and forebrain of mouse embryos following GD 8 insult. The pattern of defects observed in GD 10 embryos is illustrated in Fig. 7. In both of the affected embryos shown, as compared to a like-staged control, the medial nasal prominences are abnormally positioned, being directed away from the lateral nasal prominences and allowing full view of the developing vomeronasal organs. In addition, as compared with control, the interior of the forebrain in each of the affected embryos appears hypoplastic, with the degree of effect being consistent with that for the face. Excessive mesenchymal (esp. neural crest) and median forebrain cell death noted in these previous reports are expected to be major contributors to the dysmorphogenesis observed in the current study. Among the facial defects that have been reported to follow this insult in mice is cleft lip (Kotch and Sulik, 1992), a finding that would be expected based on the abnormal proximity of the medial and lateral nasal prominences. These facial prominences must unite in order for normal lip closure to occur. In addition, recognizing that acute ethanol exposure on GD 8 also causes a spectrum of heart, great vessel and thymic abnormalities (Daft et al., 1986), it was previously suggested that the pattern of defects is consistent with that in the DiGeorge sequence (Sulik et al., 1986). This sequence (OMIM #188400) can result from genetic (22q11 deletion) or environmental causes and has been associated with maternal ethanol use in humans (Ammann et al., 1982). As in FASD, mild to moderate learning difficulties are common in individuals affected with DiGeorge, as are a variety of structural brain anomalies including a small cerebellar vermis, decreased right cerebellar tissue volume, enlarged ventricles, and midline anomalies (esp. cavum septum pellucidum) (Shashi et al., 2004).
Fig. 7.
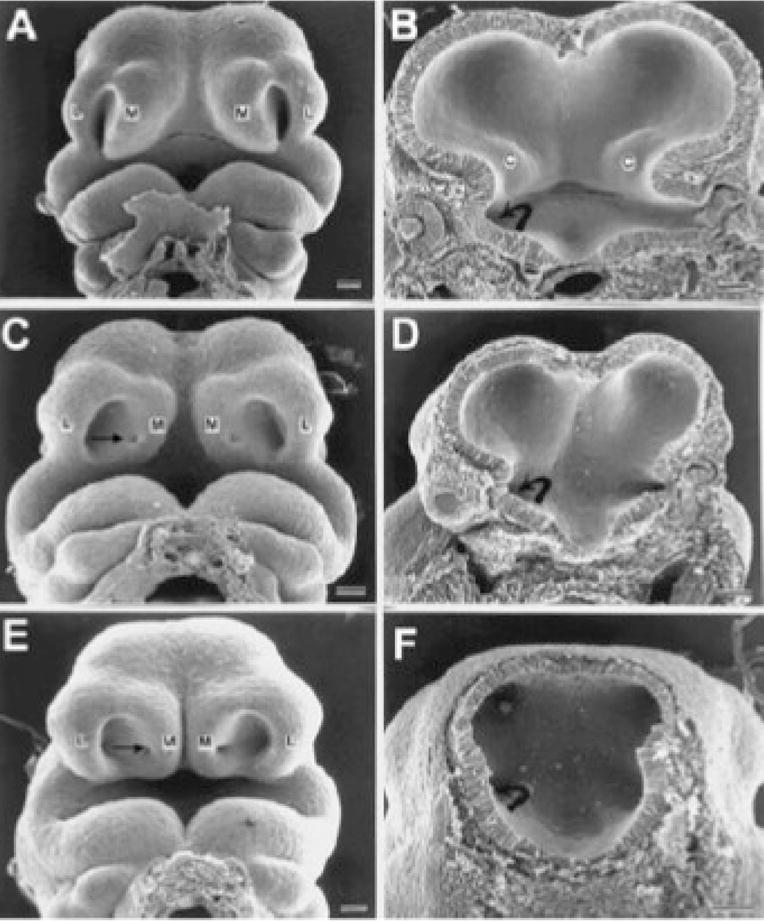
Scanning electron micrographs illustrate face and brain defects in GD 10 embryos following GD 8 maternal ethanol treatment. Comparison to a control embryo (A, B) illustrates abnormal upper midface and forebrain contours in the 2 affected embryos shown (C–F). In both affected embryos the medial nasal prominences (M) are abnormally positioned, being directed away from the lateral nasal prominences (L) and allowing full view of the developing vomeronasal organs (arrow). As compared with control, the interior of the forebrain in each of the affected embryos appears hypoplastic, with the degree of affect being consistent with that for the face. C = corpus striatum, curved arrow = optic stalk. Bars = 100 lm (modified from Sulik et al., 1986).
In the current study, observation of nasal cavity narrowing/choanal stenosis in concert with ocular abnormalities (esp. irido-retinal and optic nerve coloboma), and CNS defects provide additional important diagnostic perspectives. This combination of abnormalities is consistent with the CHARGE association/syndrome, which consists of ocular coloboma (C), heart anomaly (H), atresia of choanae (A), retarded mental and somatic growth or development (R), genital hypoplasia (G), and ear anomalies and/or hearing impairment (E) (OMIM #214800). In addition to mental retardation, structural abnormalities of the brain are present in the majority of CHARGE cases (Lin et al. 1990) and include ventricular dilatation, absence/hypoplasia of the olfactory bulbs and tracts, dysgenesis/hypoplasia of the frontal lobe and optic nerve, holoprosencephaly, and agenesis of the corpus callosum and septum pellucidum. Overall, the similarity between the teratogenic endpoints following GD 8 ethanol exposure in mice, as illustrated in the current and previous analyses, and the features of both the CHARGE association and DiGeorge sequence is striking. Recognition of these features as part of the spectrum of defects that prenatal ethanol exposure can cause promises to aid in both pre- and postnatal diagnosis.
In addition to providing information regarding regional vulnerabilities, the results of the current study have highlighted the sensitivity of very early stages of CNS development to ethanol-mediated teratogenesis. While to date the vast majority of research exploring ethanol’s teratogenic effects on the cerebellum has focused on insult occurring during relatively late (perinatal) stages of its development, the results of the current study have shown diminished cerebellar size following acute early (GD 8) ethanol exposure. Identification, in the current study, of ethanol-induced insult to the hippocampus is similar in that the GD 8 effect is much earlier than has been commonly expected or examined by others (Bonthius and West, 1991; Pierce and West, 1987). GD 8 in mice, the time of acute ethanol exposure for this study, corresponds to the fourth week postfertilization in humans. Clearly, this is a time when ethanol can cause major structural defects. Since many pregnancies are unplanned and pregnancy commonly remains unrecognized in the fourth week, strong support has been provided for FASD prevention directed efforts that stress prepregnancy counseling and education.
In conclusion, MRM technology has made comprehensive structural analyses, as presented herein, possible. Additionally, it has enabled the work required in order to complete a similar survey of ethanol-induced structural insults following exposure at multiple other developmental stages. While it is premature to conclude that the collection of abnormalities observed in fetuses following GD 8 exposure constitutes a developmental stage-specific pattern, preliminary results from MRI-based analyses of defects resulting from GD 7 as well as GD 9 exposure times (Myers et al., 2008; Parnell et al., 2008) differ from those reported herein. This supports the probability that a unique GD 8-specific pattern of ethanol-induced dysmorphology exists.
Acknowledgments
SOURCES OF SUPPORT
This work was supported by NIH grants AA11605 and U01AA017124, NCRR NCI grants P41 RR05959 and U24 CA092656, and the UNC Neurodevelopmental Disorders Research Center HD 03110.
References
- Abel EL. Fetal alcohol syndrome: a cautionary note. Curr Pharm Des. 2006;12:1521–1529. doi: 10.2174/138161206776389886. [DOI] [PubMed] [Google Scholar]
- Ammann AJ, Wara DW, Cowan MJ, Barrett DJ, Stiehm ER. The DiGeorge syndrome and the fetal alcohol syndrome. Am J Dis Child. 1982;136:906–908. doi: 10.1001/archpedi.1982.03970460036008. [DOI] [PubMed] [Google Scholar]
- Autti-Rämö I, Autti T, Korkman M, Kettunen S, Salonen O, Valanne L. MRI findings in children with school problems who had been exposed prenatally to alcohol. Dev Med Child Neurol. 2002;44:98–106. doi: 10.1017/s0012162201001748. [DOI] [PubMed] [Google Scholar]
- Bonthius DJ, West JR. Permanent neuronal deficits in rats exposed to alcohol during the brain growth spurt. Teratology. 1991;44:147–163. doi: 10.1002/tera.1420440203. [DOI] [PubMed] [Google Scholar]
- Bookstein FL, Sampson PD, Connor PD, Streissguth AP. Midline corpus callosum is a neuroanatomical focus of fetal alcohol damage. Anat Rec. 2002;269:162–174. doi: 10.1002/ar.10110. [DOI] [PubMed] [Google Scholar]
- Clancy B, Kersh B, Hyde J, Darlington RB, Anand KJS, Finlay BL. Web-based method for translating neurodevelopment from laboratory species to humans. Neuroinformatics. 2007;5:79–94. doi: 10.1385/ni:5:1:79. [DOI] [PubMed] [Google Scholar]
- Cook CS, Nowotny AZ, Sulik KK. Fetal alcohol syndrome. Eye malformations in a mouse model. Arch Ophthalmol. 1987;105:1576–1581. doi: 10.1001/archopht.1987.01060110122045. [DOI] [PubMed] [Google Scholar]
- Cook CS, Sulik KK. Sequential scanning electron microscopic analyses of normal and spontaneously occurring abnormal ocular development in C57B1/6J mice. Scan Electron Microsc. 1986;1986(Pt 3):1215–1227. [PubMed] [Google Scholar]
- Cortese BM, Moore GJ, Bailey BA, Jacobson SW, Delaney-Black V, Hannigan JH. Magnetic resonance and spectroscopic imaging in prenatal alcohol-exposed children: preliminary findings in the caudate nucleus. Neurotoxicol Teratol. 2006;28:597–606. doi: 10.1016/j.ntt.2006.08.002. [DOI] [PubMed] [Google Scholar]
- Daft PA, Johnston MC, Sulik KK. Abnormal heart and great vessel development following acute ethanol exposure in mice. Teratology. 1986;33:93– 104. doi: 10.1002/tera.1420330112. [DOI] [PubMed] [Google Scholar]
- Dunty WC, Jr, Chen SY, Zucker RM, Dehart DB, Sulik KK. Selective vulnerability of embryonic cell populations to ethanol-induced apoptosis: implications for alcohol-related birth defects and neurodevelopmental disorder. Alcohol Clin Exp Res. 2001;25:1523–1535. [PubMed] [Google Scholar]
- Gage JC, Sulik KK. Pathogenesis of ethanol-induced hydronephrosis and hydroureter as demonstrated following in vivo exposure of mouse embryos. Teratology. 1991;44:299–312. doi: 10.1002/tera.1420440307. [DOI] [PubMed] [Google Scholar]
- Johnson GA, Ali-Sharief A, Badea A, Brandenburg J, Cofer G, Fubara B, Gewalt S, Hedlund LW, Upchurch L. High-throughput morphologic phenotyping of the mouse brain with magnetic resonance histology. Neuroimage. 2007;37:82–89. doi: 10.1016/j.neuroimage.2007.05.013. [DOI] [PMC free article] [PubMed] [Google Scholar]
- Johnson GA, Benveniste H, Black RD, Hedlund LW, Maronpot RR, Smith BR. Histology by magnetic resonance microscopy. Magn Reson Q. 1993;9:1–30. [PubMed] [Google Scholar]
- Kaufman MH. The Atlas of Mouse Development. Academic Press; San Diego: 1992. [Google Scholar]
- Kotch LE, Dehart DB, Alles AJ, Chernoff N, Sulik KK. Pathogenesis of ethanol-induced limb reduction defects in mice. Teratology. 1992;46:323–332. doi: 10.1002/tera.1420460403. [DOI] [PubMed] [Google Scholar]
- Kotch LE, Sulik KK. Experimental fetal alcohol syndrome: proposed pathogenic basis for a variety of associated facial and brain anomalies. Am J Med Genet. 1992;44:168–176. doi: 10.1002/ajmg.1320440210. [DOI] [PubMed] [Google Scholar]
- Lin AE, Siebert JR, Graham JM., Jr Central nervous system malformations in the CHARGE association. Am J Med Genet. 1990;37:304–310. doi: 10.1002/ajmg.1320370303. [DOI] [PubMed] [Google Scholar]
- Mattson SN, Riley EP, Jernigan TL, Ehlers CL, Delis DC, Jones KL, Stern C, Johnson KA, Hesselink JR, Bellugi U. Fetal alcohol syndrome: a case report of neuro-psychological, MRI and EEG assessment of two children. Alcohol Clin Exp Res. 1992;16:1001–1003. doi: 10.1111/j.1530-0277.1992.tb01909.x. [DOI] [PubMed] [Google Scholar]
- Mattson SN, Riley EP, Jernigan TL, Garcia A, Kaneko WM, Ehlers CL, Jones KL. A decrease in the size of the basal ganglia following prenatal alcohol exposure: a preliminary report. Neurotoxicol Teratol. 1994;16:283– 289. doi: 10.1016/0892-0362(94)90050-7. [DOI] [PubMed] [Google Scholar]
- May PA, Fiorentino D, Phillip Gossage J, Kalberg WO, Eugene Hoyme H, Robinson LK, Coriale G, Jones KL, del Campo M, Tarani L, Romeo M, Kodituwakku PW, Deiana L, Buckley D, Ceccanti M. Epidemiology of FASD in a province in Italy: prevalence and characteristics of children in a random sample of schools. Alcohol Clin Exp Res. 2006;30:1562–1575. doi: 10.1111/j.1530-0277.2006.00188.x. [DOI] [PubMed] [Google Scholar]
- Myers EA, Parnell SE, Dehart DB, Johnson GA, Sulik KK. Analysis of ethanol-induced abnormalities in the medial forebrain of fetal mice. Toxicologist CD – An Official. J Soc Toxicol. 2008;102:1530. [Google Scholar]
- NIAAA (National Institute on Alcohol Abuse and Alcoholism) Underlying mechanisms of alcohol-induced damage to the fetus. In: Armstrong C, Gardner MB, Eckardt M, Miller DW, Warren KR, editors. Tenth Special Report to the U.S. Congress on Alcohol and Health. U.S. Department of Health and Human Services; Bethesda, MD: 2000. pp. 300–322. [Google Scholar]
- Parnell SE, Dehart DB, Sulik KK, Chen S-Y. Dose-dependent reduction of ethanol-induced ocular abnormalities in mice through the dietary administration of N-Acetylcysteine. Alcohol Clin Exp Res. 2008;32(S1):138A. doi: 10.1016/j.alcohol.2010.05.006. [DOI] [PMC free article] [PubMed] [Google Scholar]
- Parnell SE, Dehart DB, Wills TA, Chen SY, Hodge CW, Besheer J, Waage- Baudet HG, Charness ME, Sulik KK. Maternal oral intake mouse model for fetal alcohol spectrum disorders: ocular defects as a measure of effect. Alcohol Clin Exp Res. 2006;30:1791–1798. doi: 10.1111/j.1530-0277.2006.00212.x. [DOI] [PubMed] [Google Scholar]
- Petiet A, Hedlund LW, Johnson GA. Staining methods for magnetic resonance microscopy of the rat fetus. J Magn Reson Imaging. 2007;25:1192– 1198. doi: 10.1002/jmri.20932. [DOI] [PMC free article] [PubMed] [Google Scholar]
- Petiet AE, Kaufman MH, Goddeeris MM, Brandenburg J, Elmore SA, Johnson GA. High-resolution magnetic resonance histology of the embryonic and neonatal mouse: a 4D atlas and morphologic database. Proc Natl Acad Sci USA. 2008;105:12331–12336. doi: 10.1073/pnas.0805747105. [DOI] [PMC free article] [PubMed] [Google Scholar]
- Pierce DR, West JR. Differential deficits in regional brain growth induced by postnatal alcohol. Neurotoxicol Teratol. 1987;9:129–141. doi: 10.1016/0892-0362(87)90089-4. [DOI] [PubMed] [Google Scholar]
- Randall CL. Alcohol as a teratogen: a decade of research in review. Alcohol Alcohol Suppl. 1987;1:125–132. [PubMed] [Google Scholar]
- Riley EP, Mattson SN, Sowell ER, Jernigan TL, Sobel DF, Jones KL. Abnormalities of the corpus callosum in children prenatally exposed to alcohol. Alcohol Clin Exp Res. 1995;19:1198–1202. doi: 10.1111/j.1530-0277.1995.tb01600.x. [DOI] [PubMed] [Google Scholar]
- Schambra UB. Prenatal Mouse Brain Atlas. Springer Science+Business Media; New York: 2008. [Google Scholar]
- Schambra UB, Lauder JM, Petrusz P, Sulik KK. Development of neurotransmitter systems in the mouse embryo following acute ethanol exposure: a histological and immunocytochemical study. Int J Dev Neurosci. 1990;8:507–522. doi: 10.1016/0736-5748(90)90043-2. [DOI] [PubMed] [Google Scholar]
- Schambra UB, Lauder JM, Silver J. Atlas of the Prenatal Mouse Brain. Academic Press; San Diego: 1992. [DOI] [PubMed] [Google Scholar]
- Schneider JE, Böse J, Bamforth SD, Gruber AD, Broadbent C, Clarke K, Neubauer S, Lengeling A, Bhattacharya S. Identification of cardiac malformations in mice lacking Ptdsr using a novel high-throughput magnetic resonance imaging technique. BMC Dev Biol. 2004;4:16–27. doi: 10.1186/1471-213X-4-16. [DOI] [PMC free article] [PubMed] [Google Scholar]
- Shashi V, Muddasani S, Santos CC, Berry MN, Kwapil TR, Lewandowski E, Keshavan MS. Abnormalities of the corpus callosum in nonpsychotic children with chromosome 22q11 deletion syndrome. Neuroimage. 2004;21:1399– 1406. doi: 10.1016/j.neuroimage.2003.12.004. [DOI] [PubMed] [Google Scholar]
- Sowell ER, Mattson SN, Kan E, Thompson PM, Riley EP, Toga AW. Abnormal cortical thickness and brain-behavior correlation patterns in individuals with heavy prenatal alcohol exposure. Cereb Cortex. 2008;18:136–144. doi: 10.1093/cercor/bhm039. [DOI] [PMC free article] [PubMed] [Google Scholar]
- Sulik KK. Craniofacial defects from genetic and teratogen-induced deficiencies in presomite embryos. Birth Defects Orig Artic Ser. 1984;20:79–98. [PubMed] [Google Scholar]
- Sulik KK. Genesis of alcohol-induced craniofacial dysmorphism. Exp Biol Med (Maywood) 2005;230:366–375. doi: 10.1177/15353702-0323006-04. [DOI] [PubMed] [Google Scholar]
- Sulik KK, Johnston MC. Embryonic origin of holoprosencephaly: interrelationship of the developing brain and face. Scan Electron Microsc. 1982;1982(Pt 1):309–322. [PubMed] [Google Scholar]
- Sulik KK, Johnston MC. Sequence of developmental alterations following acute ethanol exposure in mice: craniofacial features of the fetal alcohol syndrome. Am J Anat. 1983;166:257–269. doi: 10.1002/aja.1001660303. [DOI] [PubMed] [Google Scholar]
- Sulik KK, Johnston MC, Daft PA, Russell WE, Dehart DB. Fetal alcohol syndrome and DiGeorge anomaly: critical ethanol exposure periods for craniofacial malformations as illustrated in an animal model. Am J Med Genet Suppl. 1986;2:97–112. doi: 10.1002/ajmg.1320250614. [DOI] [PubMed] [Google Scholar]
- Sulik KK, Johnston MC, Webb MA. Fetal alcohol syndrome: embryogenesis in a mouse model. Science. 1981;214:936–938. doi: 10.1126/science.6795717. [DOI] [PubMed] [Google Scholar]
- Swayze VW, II, Johnson VP, Hanson JW, Piven J, Sato Y, Giedd JN, Mosnik D, Andreasen NC. Magnetic resonance imaging of brain anomalies in fetal alcohol syndrome. Pediatrics. 1997;99:232–240. doi: 10.1542/peds.99.2.232. [DOI] [PubMed] [Google Scholar]
- Theiler K. The House Mouse: Atlas of Embryonic Development. Springer-Verlag; New York: 1989. [Google Scholar]
- Webster WS, Walsh DA, McEwen SE, Lipson AH. Some teratogenic properties of ethanol and acetaldehyde in C57BL/6J mice: implications for the study of the fetal alcohol syndrome. Teratology. 1983;27:231–243. doi: 10.1002/tera.1420270211. [DOI] [PubMed] [Google Scholar]
- Yushkevich PA, Piven J, Hazlett HC, Smith RG, Ho S, Gee JC, Gerig G. User-guided 3Dactive contour segmentation of anatomical structures: significantly improved efficiency and reliability. Neuroimage. 2006;31:1116–1128. doi: 10.1016/j.neuroimage.2006.01.015. [DOI] [PubMed] [Google Scholar]