

Abstract
BARS (DiMatteo, Genovese, and Kass 2001) uses the powerful reversible-jump MCMC engine to perform spline-based generalized nonparametric regression. It has been shown to work well in terms of having small mean-squared error in many examples (smaller than known competitors), as well as producing visually-appealing fits that are smooth (filtering out high-frequency noise) while adapting to sudden changes (retaining high-frequency signal). However, BARS is computationally intensive. The original implementation in S was too slow to be practical in certain situations, and was found to handle some data sets incorrectly. We have implemented BARS in C for the normal and Poisson cases, the latter being important in neurophysiological and other point-process applications. The C implementation includes all needed subroutines for fitting Poisson regression, manipulating B-splines (using code created by Bates and Venables), and finding starting values for Poisson regression (using code for density estimation created by Kooperberg). The code utilizes only freely-available external libraries (LAPACK and BLAS) and is otherwise self-contained. We have also provided wrappers so that BARS can be used easily within S or R.
Keywords: curve-fitting, free-knot splines, nonparametric regression, peri-stimulus time histogram, Poisson process
1. Introduction
Figure 1 displays a normalized histogram (called a peri-stimulus time histogram, or PSTH, in the neuroscience literature) of neuronal spiking events across time. This histogram may be considered an estimate of a Poisson process intensity function. Overlaid on the histogram is a Gaussian kernel density estimate (the dotted wiggly line) with bandwidth selected by unbiased cross-validation (Venables and Ripley 2002), which smooths the histogram. From a neurophysiological point of view, it is reasonable to expect the intensity function to vary slowly throughout much of its domain, but perhaps rapidly in a relative short interval. In this situation, the kernel density estimate oversmooths the rapid jump in the intensity, while undersmoothing the portion involving slow variation. It would be preferable to use a method of estimating the intensity function that adapts to functional variation across time.
Figure 1.

Histogram and fits using a Gaussian kernel density estimator (dotted line), logspline (thin line), and BARS (thick line). Units are in spiking events per second, the usual units for intensity functions based on neuronal spiking events. The data come from a neuron in inferotemporal cortex recorded during 16 replications (in physiological jargon, 16 trials) of an experiment described by Baker et al. (2002).
For a Poisson process, when the events are put into small time bins, as in Figure 1, the data form a sequence of Poisson-distributed counts and estimation of the Poisson process intensity function becomes a Poisson regression problem. This problem motivated development of BARS (Bayesian adaptive regression splines, DiMatteo et al. 2001), which uses regression splines with knot sets determined adaptively via Markov chain Monte Carlo (MCMC). A substantial literature has documented the effectiveness of spline-based nonparametric regression and its generalizations, with the knots being determined empirically. See Hansen and Kooperberg (2002) and the accompanying discussion. The fits by BARS (represented by the thick smooth line) and another popular free-knot spline approach (thin line), logspline (Stone, Hansen, Kooperberg, and Truong 1997), are displayed in Figure 1 and represent marked improvements over the Gaussian kernel density estimate. DiMatteo et al. (2001) showed in several examples that BARS could perform dramatically better than two closely-related methods, which themselves were better in many examples than competitors such as wavelet-based methods.
BARS has been used in variety of applications in neurophysiology, imaging, genetics, and EEG analysis (see DiMatteo et al. 2001; Kass, Ventura, and Cai 2003; Kass and Wallstrom 2002; Zhang, Roeder, Wallstrom, and Devlin 2003; Wallstrom, Kass, Miller, Cohn, and Fox 2004). Furthermore, preliminary results have indicated that, with reasonable sample sizes, posterior credible regions produced by BARS have very close to the correct frequentist coverage probabilities. For example, simulating from a curve based on the firing-rate function displayed in Figure 1, the coverage of the 95% posterior credible region for location of the peak was 95.9%, with two-digit accuracy (simulation SE = .005, based on 7,600 simulated data sets).
The original implementation of DiMatteo et al. (2001) was in S (Insightful Corp. 2003). It was very slow, and also su ered from bugs that caused occasional very poor fits. We wished to improve the implementation. In addition, in order to study frequentist coverage probabilities we had to use a parallel array of multiple processors, and therefore needed self-contained code. This article discusses a relatively fast, self-contained, and, we believe, careful BARS implementation in C with S and R wrappers. We give an overview of BARS in Section 2 and an overview of the code in Section 3. Section 4 describes the S and R wrappers and Section 5 gives pseudo-code for the C implementation.
2. Overview of BARS
Consider the problem of making inferences about a function f(t), where t lies in an interval [A, B], based on data y = y1, . . . , yn obtained at t = t1, . . . , tn, with each Yj assumed to depend probabilistically on f(tj) (and, following the usual convention, yj represents the observed value of the random variable Yj). To solve this problem BARS fits the spline-based generalized nonparametric regression model for data Yj depending on a variable t,
| (1) |
with f being a linear combination of splines having unknown sets of knot locations. Model (1) includes a vector of nuisance parameters ζ to indicate generality, though in the Poisson case there are no nuisance parameters. Writing f(t) in terms of basis functions bξ,h(t) as f(t) = Σh bξ,h(t)βξ,h the function evaluations f(t1), . . . , f(tn) may be collected into a vector (f(t1), . . . , f(tn))⊺ = Xξβξ, where Xξ is the design matrix and βξ is the coefficient vector. For a given knot set ξ = (ξ1, . . . , ξk) model (1) poses a relatively easy estimation problem; for exponential-family responses (such as Poisson) it becomes a generalized linear model. Selecting the interval [A, B] can be difficult in some problems due to spline boundary conditions (see Hansen and Kooperberg 2002, and the accompanying discussion), but in many problems such as the neuronal spiking problem, it is rarely an issue because data are often available outside of the time interval of interest, [A, B]. The hard part of the problem is determining the knot set ξ, and using the data to do so provides the ability to fit a wide range of functions (as reviewed by Hansen and Kooperberg 2002). BARS is an MCMC-based algorithm that samples from a suitable approximate posterior distribution on the knot set ξ. This, in turn, produces samples from the posterior on the space of splines. In practice, cubic splines and the natural spline basis have been used in most applications. BARS could be viewed as a powerful engine for searching for an “optimal” knot set, but because it generates a posterior on the space of splines it produces an improved spline estimate based on model averaging (e.g., Kass and Raftery 1995) and it also provides uncertainty assessments.
2.1. MCMC in BARS
Key features of the MCMC implementation of BARS include (i) a reversible-jump chain on ξ after integrating the marginal density
| (2) |
(where y = (y1, . . . , yn)), the integration being performed exactly for normal data and approximately, by Laplace’s method, otherwise, (ii) continuous proposals for ξ, and (iii) a locality heuristic for the proposals that attempts to place potential new knots near existing knots. For notational convenience here we are supressing the dependence of the knot set ξ on the number of knots k but BARS explores the space of generalized regression models defined by ξ and k and the prior on k can, in some cases, control the algorithm in important ways (see DiMatteo et al. 2001; Hansen and Kooperberg 2002; Kass and Wallstrom 2002).
The essential idea of using reversible-jump MCMC to select knots was suggested by Denison, Mallick, and Smith (1998), following the lead of Green (1995), who discussed the special case of change-point problems. However, aspects of BARS outlined in (i)-(iii) distinguish it from (and improve upon) the method of Denison et al. (1998) (see Kass and Wallstrom 2002). The first implementation feature, item (i) above, introduces an analytical step within the MCMC partly to simplify the problem of satisfying detailed balance and partly for the sake of MCMC efficiency (which is generally increased when parameters are integrated; see Liu, Wong, and Kong 1994). In addition, BARS takes advantage of the high accuracy of Laplace’s method in this context. In doing so the “unit-information” prior discussed by Kass and Wasserman (1995) and Pauler (1998) has been used (as π in (2)), and this gives the interpretation that the algorithm is essentially using BIC to define a Markov chain on the knot sets. The importance of performing the integral (2), at least approximately, has been stressed by Kass and Wallstrom (2002). Continuous proposals and the locality heuristic (items (ii) and (iii)) together allow knots to be placed close to one another, which is advantageous when there is a sudden jump in the function.
For each draw ξ(g) from the posterior distribution of ξ, a draw is obtained from the conditional posterior of βξ, conditionally on ξ(g). The conditional posterior of βξ often may be assumed normal, but in some cases the normal approximation is not very good. DiMatteo et al. (2001) described an importance reweighting scheme to improve upon the normal approximation. In the code discussed here, if the normal approximation seems poor, we instead use a conditional Metropolis update.
From we obtain fitted values for selected and these, in turn, may be used to produce a draw ϕ(g) from the posterior distribution of any characteristic ϕ = ϕ(f) (such as the value at which the maximum of f(t) occurs). Thus, the key output of BARS is the set of vectors for MCMC iterates g = 1, . . . , G, each being a vector of fits along a grid that suitably covers the interval [A, B]. The user may sample from the posterior distribution of any functional ϕ simply by evaluating . For instance, a sample from the posterior distribution of the location of the maximum of f(t) is obtained by finding the location of the maximum of for each g. This latter computation is performed in a suitable post-processing environment such as S or R. MCMC convergence may be assessed by standard methods (Gelman, Carlin, Stern, and Rubin 2004, Section 11.6) though this remains a topic of general research interest (Fan, Brooks, and Gelman 2006).
2.2. Normal and Poisson implementations of BARS
We have implemented two versions of BARS. One implementation, barsN uses a normal model in (1). The second, barsP uses a Poisson model. Our choices were based on the general interest in ordinary curve-fitting (the normal case) and our deep and continuing interest in fitting neuronal data (the Poisson case).
The two implementations differ not only through the change of likelihood, and the resulting Laplace approximation to (2) implemented with BIC for the Poisson case, but also in the selection of starting values for the MCMC algorithm. Starting values are very important: poor choices of initial knot sets result in extremely long burn-in periods to achieve apparent stationarity. In the Poisson case we have taken advantage of the closely-related algorithm logspline (see Hansen and Kooperberg 2002) and have incorporated Charles Kooperberg’s C implementation of it for density estimation.
Our ability to use Kooperberg’s implementation for density estimation rests on the duality of fitting Poisson process intensity functions and fitting probability densities: the inhomogeneous Poisson likelihood for an intensity function λ = λ(t) based on a sequence of event times t1, t2, . . . , tn in an interval (0, T] is
Here the number of events N is a Poisson random variable with expectation . Conditionally on the number of events N = n the probability density becomes
If we set
then it becomes clear that estimation of λ(t) amounts to estimation of the probability density f(t), together with estimation of . We use N = n as an estimate of , and apply logspline to estimate f(t). logspline returns a set of knots for a cubic spline, and these are used as initial values for BARS in the Poisson case.
logspline is a carefully-implemented version of forward knot addition followed by backward elimination of knots. In the normal case we have simply begun with a large set of knots (defaulted to equally-spaced in the current version) and then performed backward elimination using BIC, until BIC fails to increase as knots are eliminated. Because logspline is itself an effective algorithm, we believe the Poisson version of our code is likely to be more efficient than the normal version in the sense that short MCMC run lengths can be used with Poisson. We have set the defaults for Poisson at 500 burn-in iterations and 2,000 run iterations, while for the normal these have been set to 5,000 and 20,000.
We describe below the code and wrappers for the Poisson versions. The normal versions omit statements involving logspline, and they also omit the regression step used to approximate the integral in (2). In describing the Poisson regressions we take the Poisson parameter to be μ. Thus, at time points t1, . . . , tn we have corresponding mean values μ1, . . . , μn. (In the neuronal setting with m repeated trials, for the histogram bin centered at tj, the expected number of spiking events is μj = mwλ(tj) where w is the bin width in seconds and λ(t) is in units of spiking events per second.)
3. Overview of code
Our normal and Poisson BARS implementations proceed through the following general steps (see Figure 3):
Read user-defined parameters.
Read data, and normalize function argument (e.g., time) to interval (0, 1).
Find initial knot set.
- Run MCMC. For g = 1, . . . , Gb, where Gb is the number of burn-in iterations, do steps (a) and (b) only; subsequently do all of (a)-(e):
- Take knot step: addition, deletion, or relocation. This produces ξ(g).
- Evaluate integral in (2), exactly in normal case, approximately in Poisson case.
- Generate β(g).
- Using β(g), obtain fits and also BIC, loglikelihood, maximum, location of the maximum, and number of interior knots.
- Update modal knot set (if appropriate).
Obtain mean and modal estimates of function values, both on a grid and at all observed argument values, and of the maximum and location of maximum.
Obtain confidence intervals for the maximum and location of maximum.
Write the results.
We next elaboarate on each of these steps. At the end of this section we discuss briefly the additional publicly-available subroutines that are used by BARS.
3.1. User-defined parameters
The user may set various parameters by specifying their values in the optional parameters file. The following parameters are allowed.
burn-in_iterations: The number of burn-in MCMC iterations. Default value = 0.
sample_iterations: The number of sample MCMC iterations. Default value = 2000.
Use_Logspline: true or false to indicate whether Logspline is used for the initial knots. If Logspline is not used, evenly spaced knots are used. Default value = true.
initial_number_of_knots: The number of initial interior knots used. This only has an affect if Logspline is not used. Default value = 3.
beta_iterations: Number of iterations for the independence chain on beta for a particular set of knots. It only runs a chain if the initial beta variate is suspect. In this case, the independence chain is run starting from the mle and only the last variate is used. If no beta candidates were accepted, no beta is used although the knot set is not rejected. Default value = 3.
beta_threshhold: Threshhold for determining whether the initial beta variate is suspect. It is suspect if the log acceptance probability is less than the threshhold. Default value = -10.0.
prior_form: This is the prior on the number of knots k. Possible values: Uniform, Poisson, User (for user-defined). Default value = Uniform. Uniform refers to a uniform distribution on the interval (L, U). For User, see discussion following list of parameters.
Uniform_parameter_L: Default value = 1.
Uniform_parameter_U: Default value = MAXKNOTS = 60.
Poisson_parameter_lambda: Default value = 6.0.
For k ∼ Uniform(L, . . . , U)
SET prior_form = Uniform
SET Uniform_parameter_L = L
SET Uniform_parameter_U = U
For k ∼ Poisson(M)
SET prior_form = Poisson
SET Poisson_parameter_lambda = M
proposal_parameter_tau: Parameter τ that controls the spread for the knot proposal distribution. A candidate knot is generated by first selecting a current knot t, 0 < t < 1, and then selecting candidate knot ∼ beta(tτ, (1-t)τ). Default value = 50.
reversible_jump_constant_c: Parameter that controls the probability of birth and death candidates. It may be at most 0.5. Larger values increase the probability for birth death candidates. Smaller values increase the probability for knot relocation. Default value = 0.40.
confidence_level: The confidence level for parameter intervals. Default value = 0.95.
number_of_grid_points: The number of evenly spaced points for the grid along which fitted values will be obtained. Default value = 500.
verbose: true or false to indicate verbose output. Default value = false.
User-defined prior on number of knots
The prior on the number of knots k is defaulted to a uniform distribution. However, as discussed by DiMatteo et al. (2001), Hansen and Kooperberg (2002), Kass and Wallstrom (2002), this prior can serve usefully to control fitting. A user may specify the prior by specifying its pdf values on a set of positive integers. This is done in a file. For example, the file
2 0.05
3 0.15
4 0.30
5 0.30
6 0.10
7 0.10
indicates that P(k = 2) = 0.05, . . . , P(k = 7) = 0.10. All zero probabilities that appear between the smallest k having non-zero probability and the largest k having non-zero probability are changed to an ε > 0. The probabilities are then scaled to sum to one. Note that very low prior probabilites may make it difficult for the chain to explore some posterior regions that have high posterior probability. For example, consider P(k = 2) = P(k = 4) = 0.499999, P(k = 3) = 0.000002. The resulting chain would generally get stuck in either the k = 2 region of the posterior, or the k = 4 region of the posterior.
3.2. Read data
The data take the form of (x, y) pairs where x = t in the notation of Section 2.
3.3. Find initial knot set
By default, as discussed in Section 2, in the Poisson case the initial knot set is found using logspline. In the normal case evenly-spaced knots are placed and then backward elimination is used. Currently, an option to use evenly-spaced knots is also included for the Poisson case. (A planned improvement is to use every k-th value of tj in the data for both cases.)
3.4. Run MCMC
It is important to recognize that the Markov chain is on the knot sets ξ (after exact or approximate integration of (2)). As described by DiMatteo et al. (2001), the algorithm randomly selects as a proposal (in the Metropolis sense) either a new knot (a“birth” step), removal of a knot (a“death” step), or a relocation of a knot. Birth and relocation steps begin by randomly selecting a knot, with equal probabilities, from among all knots in the current knot set. If the proposal involves a birth step, then a location for the potential new knot is randomly selected by first randomly selecting an existing knot and then drawing from a beta distribution centered at that knot. This beta distribution is typically quite tight around its center (with spread controlled by an optional user-defined parameter τ) in order to propose knots that are close to existing knots (as mentioned in Section 2). The same beta distribution is used to propose a knot relocation (the distribution being centered on the knot to be potentially relocated). As usual, the proposal to add, delete, or relocate is evaluated, and possibly accepted, via the Metropolis-Hastings ratio.
Approximation of the integral in (2), in the Poisson case, is accomplished via BIC. This is obtained from the Poisson regression based on the proposed set of knots. This regression also produces the MLE and observed information matrix, needed in (c).
In the normal case, is produced by a draw from the relevant multivariate normal distribution of the posterior of βξ conditionally on ξ = ξ(g), obtained analytically. In the Poisson case, for sufficiently large samples, the normal approximation to the posterior based on the MLE and observed information may be used. The algorithm always attempts to draw from this approximating normal distribution. However, if the acceptance ratio is extremely small, a short MCMC run is used instead. We have found this to be quite important because in many of our applications a Poisson mean at some time t may be very small and thus may produce a highly skewed posterior distribution.
After is drawn from the conditional posterior, fits may be obtained. In our applications we are often interested in maxima and their locations. Therefore, by default, we compute these.
If BIC for the newly-obtained, current ξ(g) is larger than BIC for all preceding knot sets then the current ξ(g) is retained as the current modal knot set. The MLE (in the normal case, the least-squares estimate) is also retained so that modal fits can be produced for the final modal knot set.
3.5. Obtain estimates
Ater MCMC terminates, the iterations are used to find posterior mean and modal fits. The fits are obtained both at all tj values and on a user-specified grid. In addition, the mean and modal values of the function maximum and its location are computed.
3.6. Obtain posterior intervals
Based on the set of draws from the posteriors that are used to form estimates, quantiles are computed via partial sorting. By default the .025 and .975 quantiles form the 95% posterior (“credible”) intervals. Currently, confidence intervals are only obtained for the function maximum and location of the maximum. Other intervals may be obtained easily from the draws from the posterior in the output.
3.7. Write results
Results are written into a series of files
sampled_knots_file
The name of the output file for the sampled knot locations. Format is [iteration number] [number of interior knots] [knots . . .] Note that the number of entries per line will vary. Use none to indicate no file. Default value = none.
sampled_mu_file
The name of the output file for sampled fitted values (μ) at the observed argument points t1, . . . , tn. Use none to indicate no file. Default value = samp_mu.
sampled_mu-grid_file
The name of the output file for sampled fitted values (μ) on the evenly spaced grid points. Use none to indicate no file. Default value = none.
sampled_params_file
The name of the output file for sampled values of various parameters. The parameters given are iteration number, BIC, log likelihood, location of peak, height at peak, number of interior knots. Use none to indicate no file. Default value = samp_params.
summary_mu_file
The name of the output file for summary fitted values (μ) at the observed argument points t1, . . . , tn. Three rows are given with the t values, posterior mean, and posterior mode, respectively. Use none to indicate no file. Default value = summ_mu.
summary_mu-grid_file
The name of the output file for summary fitted values (μ) on the evenly spaced grid points. Three rows are given with the t values, posterior mean, and posterior mode, respectively. Use none to indicate no file. Default value = none.
summary_params_file
The name of the output file for summary values of certain parameters. The first row is for the location of the peak, and the second is for the height, and the third is for the number of interior knots. The first two columns are quantiles giving a confidence interval for the specified confidence level (see parameter confidence_level). The third column is the posterior mean, and the fourth is the posterior mode. Use none to indicate no file. Default value = summ_params.
3.8. External subroutines for BARS
In addition to incorporating the logspline code, we have used routines for manipulating B-splines written by Bates and Venables (included in the release of R, see R Development Core Team 2006) and for random number generation obtained from Ranlib (Brown and Lovato 1996). These are part of the BARS code.
BARS also calls linear algebra subroutines from LAPACK and BLAS. These are available at http://www.netlib.org/lapack/ and http://www.netlib.org/blas/, respectively. They must be installed prior to compiling BARS. Information about these packages may be found in Anderson, Bai, Bischof, Blackford, Demmel, Dongarra, Du Croz, Greenbaum, Hammarling, McKenney, and Sorensen (1999); Dongarra, Croz, Hammarling, and Du (1990b,a).
4. R and S wrappers
Prior to using this wrapper, one must build a chapter using the file barsP.c. The shared library must be made available with the dyn.open(“S.so”) command. Also, the barsP.c program must be properly compiled, with the compiled program saved as barsP.out.
Note that due to the large amount of output generated by the program, it is desirable to save the results of the program into a variable, for example:out_barsP.fun(x, y, .....)
The wrapper performs the operation by writing the data and settings into the files bars_points and bars_params, respectively.
Following is the complete function call, including a description of its input and output.
barsP.fun(x, y, initial, iknots, prior, priorparam, burnin, sims, tau, c, fits, peak, conf, trials, bins)
- Required Input
-
-Variables
- x: a vector of the independent variable, in increasing order
- y: a vector of the dependent variable, in the form of count data
-
-
- Optional Input
-
-Initial knots settings
- initial: logspline, or even or equal for evenly spaced initial knots. Default value = logspline.
- iknots: the initial number of knots for the spline if using evenly spaced knots. Default value = 3.
-
-Settings on prior for knots
- prior: the type of prior being used for the knots. The only acceptable answers are Poisson, uniform, and user. Default value = uniform.
- priorparam: the parameter for the prior
- * if using Poisson, the choice for lambda = mean
- * if using uniform, a vector of length 2 which includes the minimum number of knots followed by the maximum number of knots. Default value = c(1,60).
- * if using user, a matrix with 2 columns. The first column should be the number of knots and the second column should be the probability of obtaining this number of knots.
-
-MCMC settings
- burnin: the desired length of the burn-in for the MCMC chain. Default value = 200.
- sims: the number of simulations desired for the MCMC chain. Default value = 2000.
- tau: parameter τ that controls the spread for the knot proposal distribution. Default value = 50.0.
- c: parameter that controls the probability of birth and death candidates. Default value = 0.4.
-
-Output settings
- fits: if T, the program will return the fitted values for each x-value for each run of the simulation. Default value = T. Please note that if the number of data points and/or simulations is large, there may be a lengthy delay as the necessary data is read.
- peak: if T, the program will return the location and height of the highest point on the fitted curve. Default value = F.
- conf: for use with peak. Sets the probability for the credible intervals for the location and height of the peak. Default value = 0.95 for 95% credible intervals.
-
-Other settings
- trials: the number of trials that are concatenated in the data. Default value = 1.
- bins: the number of bins the x-axis is divided into - used to handle unbinned data and calculate posterior modes. Default value = 150.
-
-
- Output
- postmeans: vector of the posterior means evaluated at the x values
- postmodes: vector of the posterior modes evaluated at the x values
- sims: vector of each simulation number, beginning at burnin + 1 and ending at burnin + sims
- no.knots: vector of the number of knots used at each iteration, excluding burning iterations
- sampknots: matrix containing the position of the knots at each iteration. Length of the matrix is equal to the number of iterations, excluding burnin iterations, with the width of the matrix equal to the maximum number of knots at any iteration. NAs are used to fill in the matrix at iteration numbers that have less than the maximum number of knots.
- sampBICs: vector of the calculated BIC at each iteration, excluding burning iterations
- sampllikes: vector of the calculated loglikelihood at each iteration, excluding burning iterations
- Optional Output
-
-Optional output if fits = T
- sampfits: matrix of fits for each iteration, excluding burning iterations, with the rows of the matrix corresponding to the individual iteration. The columns represent the fits at each value of x.
-
-Optional output if peak = T
- samplpeaks: vector of the x location of the highest point in the fitted curve for each iteration, excluding burning iterations
- samphpeaks: vector of the y value (height) of the highest point in the fitted curve for each iteration, excluding burning iterations
- peaklocationquantile: a credible interval for the x location of the highest peak; width of the interval is dependent upon the setting chosen for conf
- peaklocationmean: the mean x location for the highest peak
- peaklocationmode: the mode x location for the highest peak
- peakheightquantile: a credible interval for the y value (height) of the highest peak; width of the interval is dependent upon the setting chosen for conf
- peakheightmean: the mean y value (height) of the highest peak
- peakheightmode: the mode y value (height) of the highest peak
-
-
5. Pseudo-code
5.1. Function: BARS for Poisson count data
Read data: For Poisson count data, the data must take the form of pairs of bin midpoints and Poisson counts. The number of replicated data sets is also required. In neuron firing examples, this is the number of trials. In many other examples, the number of replicated data sets may be set to one.
Read user parameters: These include parameters that specify the form of the prior, prior parameters, mcmc parameters, and parameters that specify output variables and the destination files.
Normalize data: The bin midpoints are normalized to lie between 0 and 1, inclusive.
MCMC: See function description below.
Write summary output of desired parameters.
return
5.2. Function: MCMC
In the following, a modelM* contains information for an individual MCMC iteration. In particular, it contains
-
-
k*, the number of interior knots
-
-
ξ*, the set of interior knots
-
-
XD,*, the design basis, and XG,*, the grid basis. The design basis is based on the input bin midpoints. The grid basis is based upon a grid of evenly spaced points, the number of which is user defined.
-
-
statistical model fitting information, including parameter estimates, error estimates, and failure to fit.
-
-
β* ∼ π(β|k*, ξ*, Data)
-
-
μD,* = exp (XDβ*)
-
-
μG,* = exp (XGβ*)
-
-
The BIC and log likelihood for the full model with parameters (k*, ξ*, β*).
Declare models Mcurr, Mcand, and Mtemp.
Set initial knots in Mcurr. The initial knots may be user defined, equally spaced, or obtained via logspline.
- Calculate birth and death probabilities for each possible value of k, using the user-defined prior, as follows:
- if (k >= MAXKNOTS)
- birth probability = 0
- else
- birth probability = c min (1, π(k + 1)/π(k))
- if (k <= 1)
- death probability = 0
- else
- death probability = c min (1, π(k - 1)/π(k))
- comment:
- probability of knot relocation is 1 - (birth probability + death probability).
Define μ(0), used to start each iterative fitting process.
for i ← 0 to (n - 1)
Form the natural spline design basis for Mcurr → XD,curr
Fit the Poisson regression model for Mcurr. See function description below.
if (fit of Mcurr failed)
Remove knots through backwards elimination until a subset is found such that 1) the model fit does not fail, 2) the model has the greatest likelihood among the models with the same number of knots in which the fit does not fail, and 3) the knot subset has positive prior probability. If all models with a given number of knots fail to be fit, the model in which has the smallest condition number is selected, and the procedure continues by trying to remove an additional knot.
If backwards elimination fails to find a valid subset, the procedure tries to fit a model with the minimum number of knots that have positive prior probability, with the knots equally spaced. If the model fails to be fit, exit.
Set Mcurr to the resulting model.
maxBIC ← 0
total iterations ← burnin iterations + sampling iterations
for i ← 0 tototal iterations - 1
u ∼ U(0, 1)
if (u < birth probability)
s ∼ Discrete Uniform(ξcurr)
t ∼ beta(α = (sτ, β = (1 - s)τ)
ξcand ← (ξcurr ∪ {t}) ∖ {s}
kcand ← kcurr + 1
Form the natural spline design basis for Mcand → XD,cand
Fit the Poisson regression model for Mcand.
if (fit of Mcand failed) accept probability = 0
else
dens ← q(Mcand|Mcurr)kcurr = Σr∈ξcurrfbeta(t|α = rτ, β = (1 - r)τ)
accept probability = exp(ℓcand - ℓcurr + log(kcurr) - log(dens) - 0.5 log(n))
comment:ℓ* in the above equation is the profile likelihood, ℓ* = supβℓ(ξ*, k*, β)
else if (1 - u < death probability)
t ∼ Discrete Uniform(ξcurr)
ξcand ← ξcurr∖ {t}
kcand ← kcurr - 1
Form the natural spline design basis for Mcand → XD,cand
Fit the Poisson regression model for Mcand. See function description below.
if (fit of Mcand failed) accept probability = 0
else
dens ← q(Mcurr|Mcand)kcand = Σr∈ξcandfbeta(t|α = rτ, β = (1 - r)τ)
accept probability = exp(ℓcand - ℓcurr + log(kcand) - log(kdens) - 0.5 log(n))
else
s ∼ Discrete Uniform(ξcurr)
t ∼ beta(α = sτ, β = (1 - s)τ)
ξcand ← (ξcurr ∪ {t}) ∖ {s}
kcand ← kcurr
Form the natural spline design basis for Mcand → XD,cand
Fit the Poisson regression model for Mcand
if (fit of Mcand failed) accept probability = 0
else
dens1 ← q(Mcand|Mcurr)kcurr = fbeta(t|α = sτ, β = (1 - s)τ)
dens2 ← q(Mcand|Mcand)kcand = fbeta(s|α = sτ, β = (1 - t)τ)
accept probability = exp(ℓcand - ℓcurr + log(dens1) - log(dens2))
u ∼ U(0, 1)
if (u < accept probability)
comment: Candidate model accepted. Swap Mcurr and Mcand.
Mtemp ← Mcurr
Mcurr ← Mcand
Mcand ← Mtemp
if (i >= burnin iterations)
comment: Beyond the burn-in period.
Generate Random coefficient Vector for Mcurr. See function description below.
Calculate BICcurr and ℓcurr for the full model using parameter values (kcurr, ξcurr, curr).
μD,curr ← exp(XD,currβcurr)
Form the natural spline grid basis for Mcurr → XG,curr
μG,curr ← exp(XG,currβcurr)
comment: Find mode and the mean function evaluated at the mode. In neuron firing examples, it produces the location of the peak firing rate, and the peak firing rate.
Use μG, curr to form an interpolating spline.
Locate mode of interpolating spline → (xmode, μcurr (xmode))
Write desired parameters to a file.
Store desired parameters for later use.
comment: update posterior modal values, if appropriate
if ((BICcurr > maxBIC) or (i == burnin iterations))
maxBIC ← BICcurr
parameter modes ← current parameter values
Use partial sorting to form confidence intervals of desired stored parameters.
Calculate means of desired stored parameters.
return
5.3. Function: Fit Poisson regression model
- input:
- X, an n × p design matrix
- y, a vector of observed counts
- μ(0), a vector of starting values
- output:
- β̂, estimated coefficients
- U, a p × p upper triangular matrix that contains information on the estimated covariance matrix of β̂
- error, a boolean indicator of fit failure.
μ ← μ(0)
j ← 0
ℓ0 ← 0
error ← false
- repeat
- j ← j + 1
- z ← log μ + (y - μ)/μ.
- W ← Diag (μ)
- H ← WX. comment: Use known diagonal structure of W
- J ← H⊺X
- U ← Upper triangular matrix from the Cholesky decomposition of J = U⊺U if Cholesky decomposition fails
- error ← true
- exit ← true
- else
- β̂ ← Solution to Jβ = H⊺z. comment: Use Cholesky decomposition of Jif unable to solve equation
- error ← true
- exit ← true
- else
- η ← Xβ̂
- μ ← exp(η)
- ℓj ← Σi (yiηi - μi)
- exit ← (((|ℓj - ℓj-1| < ε) and (j > 1)) or (j > 20))
until (exit)
return
5.4. Function: Generate random coefficient vector
Generates β posterior distribution π(β|k, ξ, Data) or from the N (β̂, (X⊺WX)-1) approximation, as follows. One β is generated from the normal approximation. If β the appears to not be an outlier under the posterior distribution, the β variate is accepted and returned. If the β does appear to be an outlier, the routine takes a user-defined number of Metropolis-Hastings steps and returns the last sampled β. The β is identified as an outlier if its log Metropolis-Hastings acceptance probability is below a user-defined threshhold.
Let π* denote the density for the normal approximation. Note that the Cholesky decomposition of X⊺WX is already available from the last fitting iteration.
- input:
- β̂, the MLE of β.
- U, a p × p upper triangular matrix that contains information on the estimated covariance matrix of β̂.
- MHI, the number of Metropolis-Hastings iterations. This is a user-defined parameter.
- MHT, the threshhold used to determine whether (a) the initial β variate from the normal approximation should be kept as the resulting variate, or (b) MHI Metropolis-Hastings iterations are used. MHT is compared to the log of the acceptance probability. MHT is a user-defined parameter.
- output:
- error, a boolean indicator of failure
- β, the random variate. Only defined if not error.
βcurr ← β̂
- fori ← 0 toMHI - 1
- iter ← 0, error ← false, exit ← false
- repeat
- iter ← iter + 1
- z ∼ N(0,I)
- A ← Solution to U⊺A = z.
- error ← (unable to solve equation)
- exit ← ((noterror) or (iter ≥ 20))
- until (exit)
- if (error) exit
- else
- βcand ← + β̂ + A
- if ((i = 0) and (r > MHT))
- comment: Accept the initial variate. No additional Metropolis-Hastings steps.
- i ← MHI
- u ← r - 1.0
- else
- u ← U(0, 1)
- u ← log(u)
- if (u < r)
- comment: Accept the candidate β.
- βcurr ← βcand
beta ← βcurr.
return
Figure 2.
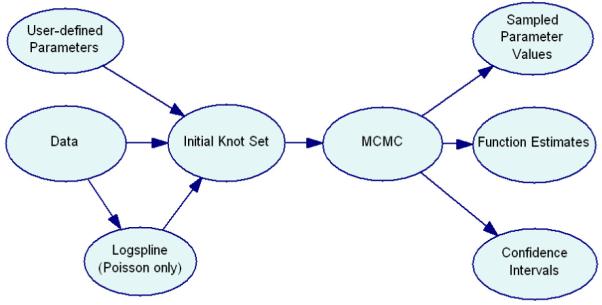
Diagram of our normal and Poisson BARS implementations. User-defined parameters and data are input and used to create the initial knot set. In the Poisson case, logspline may be used to create the initial knot set. The MCMC runs starting from the initial knot set and outputs sampled parameter values, function estimates and confidence intervals.
Acknowledgments
Support for the current work was provided by NIMH Program Project MH56193. The authors are grateful for helpful comments from the referees.
Contributor Information
Garrick Wallstrom, University of Pittsburgh.
Jeffrey Liebner, Carnegie Mellon University.
Robert E. Kass, Carnegie Mellon University
References
- Anderson E, Bai Z, Bischof C, Blackford S, Demmel J, Dongarra J, Du Croz J, Greenbaum A, Hammarling S, McKenney A, Sorensen D. LAPACK Users’ Guide. 3rd edition Society for Industrial and Applied Mathematics; Philadelphia, PA: 1999. [Google Scholar]
- Baker CI, Behrmann M, Olson CR. Impact of Learning on Representation of Parts and Wholes in Monkey Inferotemporal Cortex. Nature Neuroscience. 2002;5(11):1210–1216. doi: 10.1038/nn960. [DOI] [PubMed] [Google Scholar]
- Brown BW, Lovato J. Library of C Routines for Random Number Generation. 1996 URL http://www.stat.umn.edu/HELP/ranlib-docs/ranlib.c.chs.
- Denison DGT, Mallick BK, Smith AFM. Bayesian MARS. Statistics and Comping. 1998;8:337–346. [Google Scholar]
- DiMatteo I, Genovese CR, Kass RE. Bayesian Curve Fitting with Free-Knot Splines. Biometrika. 2001;88:1055–1073. [Google Scholar]
- Dongarra JJ, Croz JD, Hammarling S, Duff I. Algorithm 679: A Set of Level 3 Basic Linear Algebra Subprograms: Model Implementation and Test Programs. ACM Transactions on Mathematical Software. 1990a;16(1):18–28. [Google Scholar]
- Dongarra JJ, Croz JD, Hammarling S, Duff I. A Set of Level 3 Basic Linear Algebra Subprograms. ACM Transactions on Mathematical Software. 1990b;16(1):1–17. [Google Scholar]
- Fan Y, Brooks P, Gelman A. Output Assessment for Monte Carlo Simulations via the Score Statistic. Journal of Computational and Graphical Statistics. 2006;15:178–206. [Google Scholar]
- Gelman A, Carlin J, Stern H, Rubin D. Bayesian Data Analysis. 2nd edition Chapman & Hall/CRC; Boca Raton: 2004. [Google Scholar]
- Green PJ. Reversible Jump Markov Chain Monte Carlo Computation and Bayesian Model Determination. Biometrika. 1995;82:711–732. [Google Scholar]
- Hansen MH, Kooperberg C. Spline Adaptation in Extended Linear Models. Statistical Science. 2002;17:2–51. [Google Scholar]
- Insightful Corp . S-PLUS Version 6.2. Seattle, WA: 2003. URL http://www.insightful.com/ [Google Scholar]
- Kass RE, Raftery AE. Bayes Factors. Journal of the American Statistical Association. 1995;90:773–795. [Google Scholar]
- Kass RE, Ventura V, Cai C. Statistical Smoothing of Neuronal Data. Network: Computation in Neural Systems. 2003;14:5–15. doi: 10.1088/0954-898x/14/1/301. [DOI] [PubMed] [Google Scholar]
- Kass RE, Wallstrom G. Invited Comment on “Spline Adaptation in Extended Linear Models” by Mark H. Hansen and Charles Kooperberg. Statistical Science. 2002;17:24–29. [Google Scholar]
- Kass RE, Wasserman LA. A Reference Bayesian Test for Nested Hypotheses and its Relationship to the Schwarz Criterion. Journal of the American Statistical Association. 1995;90:928–934. [Google Scholar]
- Liu JS, Wong WH, Kong A. Covariance Structure of the Gibbs Sampler with Applications to the Comparisons of Estimators and Augmentation Schemes. Biometrika. 1994;81:27–40. [Google Scholar]
- Pauler DK. The Schwarz Criterion and Related Methods for Normal Linear Models. Biometrika. 1998;85:13–27. [Google Scholar]
- R Development Core Team . R: A Language and Environment for Statistical Computing. R Foundation for Statistical Computing; Vienna, Austria: 2006. ISBN 3-900051-07-0, URL http://www.R-project.org/ [Google Scholar]
- Stone CJ, Hansen M, Kooperberg C, Truong YK. The Use of Polynomial Splines and their Tensor Products in Extended Linear Modeling. The Annals of Statistics. 1997;25:1371–1470. [Google Scholar]
- Venables WN, Ripley BD. Modern Applied Statistics with S. 4th edition Springer-Verlag; New York: 2002. [Google Scholar]
- Wallstrom GL, Kass RE, Miller A, Cohn JF, Fox NA. Automatic Correction of Ocular Artifact in the EEG: A Comparison of Regression-Based and Component-Based Methods. International Journal of Psychophysiology. 2004;53:105–119. doi: 10.1016/j.ijpsycho.2004.03.007. [DOI] [PubMed] [Google Scholar]
- Zhang X, Roeder K, Wallstrom G, Devlin B. Integration of Association Statistics over Genomic Regions Using Bayesian Adaptive Regression Splines. Human Genomics. 2003;1:20–29. doi: 10.1186/1479-7364-1-1-20. [DOI] [PMC free article] [PubMed] [Google Scholar]