Abstract
Small animal PET scanners may be improved by increasing the sensitivity, improving the spatial resolution and improving the uniformity of the spatial resolution across the field of view. This may be achieved by using PET detectors based on crystal elements that are thin in the axial and transaxial directions and long in the radial direction, and by employing depth of interaction (DOI) encoding to minimize the parallax error. With DOI detectors, the diameter of the ring of the PET scanner may also be decreased. This minimizes the number of detectors required to achieve the same solid angle coverage as a scanner with a larger ring diameter and minimizes errors due to non-collinearity of the annihilation photons.
In this study, we characterize prototype PET detectors that are finely pixelated with individual LSO crystal element sizes of 0.5 mm × 0.5 mm × 20 mm and 0.7 mm × 0.7 mm × 20 mm, read out at both ends by position sensitive avalanche photodiodes (PSAPDs). Both a specular reflector and a diffuse reflector were evaluated. The detectors were characterized based on the ability to clearly resolve the individual crystal elements, the DOI resolution and the energy resolution.
Our results indicate that a scanner based on any of the four detector designs would offer improved spatial resolution and more uniform spatial resolution compared to present day small animal PET scanners. The greatest improvements to spatial resolution will be achieved when the detectors employing the 0.5 mm × 0.5 mm × 20 mm crystals are used. Monte Carlo simulations were performed to demonstrate that 2 mm DOI resolution is adequate to ensure uniform spatial resolution for a small animal PET scanner geometry using these detectors. The sensitivity of such a scanner was also simulated using Monte Carlo simulations and was shown to be greater than 10 % for a four ring scanner with an inner diameter of 6 cm, employing 20 detectors per scanner ring.
Keywords: PET, depth of interaction, high resolution
1. INTRODUCTION
Dedicated small animal PET scanners were first developed in the 1990s (Bloomfield et al., 1995; Lecomte et al., 1996; Cherry et al., 1997). Today, preclinical studies are performed in both academic and industrial settings. These studies may be enhanced by improving the spatial resolution, improving the sensitivity and improving the uniformity of the spatial resolution across the field of view. Employing finely pixelated depth-encoded gamma ray detectors is one of the possible ways to simultaneously improve all three of these parameters.
Improving the spatial resolution of the resulting images will enable users to identify smaller structures and regions of interest within the animal and will decrease partial volume effects thus improving quantification. Commercially available small animal PET scanners can achieve a spatial resolution of ~1.2 mm in the center of the field of view (Kim et al., 2007). This would result in partial volume effects occurring for structures smaller than 3.6 mm, three times the full width at half maximum (FWHM) of the reconstructed image resolution (Soret et al., 2007). It is difficult to quantify the tracer uptake in objects where significant partial volume effects are present, especially if the size of the object changes over time (e.g. longitudinal imaging of a tumor during treatment).
Increasing the sensitivity of the scanner has the potential to decrease the overall scan time, decrease the injected dose to the animal and improve the temporal resolution in dynamic studies. The duration of an imaging study using a small animal PET scanner is typically on the order of 10–30 minutes. With an improvement in sensitivity, the duration of the scan may be reduced without sacrificing image quality. Dynamic imaging requires good temporal resolution, specifically to determine the time-activity curve in the subject (Laforest et al., 2005). With improved sensitivity, shorter duration frames may be acquired improving the temporal resolution. Another advantage to improved sensitivity is that the duration of the imaging study could remain the same while the injected activity could be decreased without sacrificing image quality. This reduction in injected activity would reduce the radiation dose to the animal and would be advantageous when longitudinal imaging studies are performed on the same animal (Funk et al., 2004; Taschereau and Chatziioannou, 2007). In PET systems, sensitivity is increased by using thicker detectors and increasing the solid angle coverage of the object.
To improve the uniformity of the spatial resolution across the field of view depth of interaction (DOI) PET detectors may be used to eliminate the parallax error that occurs in current PET scanners. This error results in the spatial resolution of the image deteriorating as the distance from the center of field of view increases. With the development of DOI detectors the sensitivity of the system may be improved, as longer crystals may be employed. Additionally, the radius of the scanner may be decreased. The decrease in the radius of the scanner will result in fewer detectors needed to form a ring, decreasing the amount of scintillator material used and also decreasing the number of electronic channels required.
Several designs for DOI detectors exist that may be characterized as either providing discrete or continuous DOI information. One example of discrete DOI encoding is the phoswich detector in which the two layers of the detector are different scintillation materials with different characteristic decay times (Saoudi et al., 1999; Tsuda et al., 2004; Ziemons et al., 2005). In phoswich detectors, the resulting pulse shape is evaluated to determine in which layer the event occurred. Another form of discrete DOI detectors employ two or more layers of offset scintillation crystals and the layer in which the original event occurred is determined by examining the resulting flood histograms (Zhang et al., 2002). Continuous DOI encoding can be achieved by employing dual-ended readout detectors and the ratio of the signals from the near and far end of the detector indicates the depth at which the original interaction occurred and has been proposed for detectors with individual crystals (Moses et al., 1995; Shao et al., 2002). Using monolithic detectors continuous DOI may be determined by examining the spread of the light at the photodetector (Maas et al., 2009). To eliminate the parallax error completely, the required DOI resolution is on the order of the crystal width. Development of PET detectors with discrete DOI capability will improve the uniformity of the spatial resolution across the field of view but they do not hold the same potential to eliminate the parallax error that is presented by PET detectors with continuous DOI encoding.
With continuous and high resolution DOI encoding the parallax error is minimized and the spatial resolution across the field of view in the scanner improves and becomes more uniform. Previously, it has been shown that a DOI resolution of 2 mm can be achieved using a LSO array with crystal dimensions of 0.92 mm × 0.92 mm × 20 mm, read out by two position sensitive avalanche photodiodes (PSAPDs) (Yang et al., 2008). Work by Stickel and Cherry (Stickel and Cherry, 2005) shows that improvements in spatial resolution can be obtained by using smaller crystal elements achieving an intrinsic spatial resolution of 0.5 mm when detectors with 0.25 mm pixels are employed, provided that the individual pixel elements can be clearly resolved.
Encouraged by previous results (Stickel et al., 2007; Yang et al., 2006), we set out to develop dual-ended readout DOI PET detectors using very finely pixelated LSO arrays, with individual pixel element dimensions of 0.5 mm × 0.5 mm × 20 mmand 0.7 mm × 0.7 mm × 20 mm. This work improves on both of the previous studies mentioned. In the work by Stickel et al, the element size of 0.42 mm × 0.42 mm × 10 mm in the proposed detector would not result in a realizable improvement in spatial resolution in a practical small animal scanner without very good DOI encoding. The detector examined in the study had no DOI information. The very fine pixel sizes and small ring diameter would lead to significant parallax errors. These parallax errors could be reduced by increasing the scanner ring diameter, however, this would result in poor sensitivity (decrease in solid angle) and would also lead to unacceptable blurring due to photon non-colinearity. Compared with the study by Yang et al, the smaller pixel sizes used here offer the possibility of small animal PET studies where the resolution is dominated by positron and photon interaction physics rather than by detector dimensions.
To improve both the sensitivity and the spatial resolution of a small animal PET scanner, finely pixelated LSO arrays were constructed and read out at both ends using PSAPDs. Two different reflector films were examined in conjunction with unpolished crystal arrays. These two films were the enhanced specular reflector film manufactured by 3M (St. Paul, MN) and the white pigmented E20 film manufactured by Toray Plastics (North Kingstown, RI,). This is, to our knowledge, the first use of the Toray reflector in a DOI detector. Polished crystal arrays have previously been shown to not provide any significant level of DOI information (Shao et al., 2002) and were not studied.
For the reasons given above, sensitivity and spatial resolution are the two parameters that we have chosen to prioritize in this detector development. Energy resolution is seen as less critical as fewer photons are scattered in the subject when compared to whole body human imaging (Yang and Cherry, 2006). The goal of this work is to characterize and compare four PET detectors that have the potential to improve the sensitivity, spatial resolution and uniformity of the spatial resolution of small animal PET scanners. To characterize the gains achievable with these DOI detectors, Monte Carlo simulations using GATE were performed to determine the sensitivity and the image spatial resolution across the field of view for the measured DOI resolution.
2. MATERIALS AND METHODS
The PSAPDs used in this work were developed at Radiation Monitoring Devices, Inc. and have an active area of 8 × 8 mm2. These PSAPDs have been characterized previously (Shah et al., 2004). Each PSAPD has four anode signals and one cathode signal. The four anode signals are used for positioning of the event. The cathode signal is used for triggering the data acquisition.
The LSO arrays evaluated were constructed by Agile Engineering (Knoxville, TN) following the same technique described by Stickel et al. (Stickel et al., 2007). The LSO block is cut into parallel slices and a sheet of reflector is glued between the parallel slices of LSO. The solid LSO block is rotated 90 degrees and cut again, in parallel slices that are perpendicular to the previous cuts. Once this final set of cuts is made, reflector sheets are glued between the LSO slabs. The final step in the construction of the array is that four final sheets of reflector are glued to the outside of the LSO array.
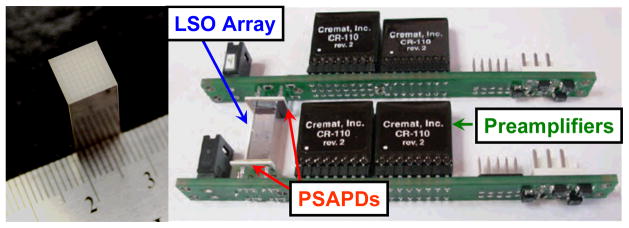
Four different LSO arrays were evaluated, with two different crystal element sizes and two different reflectors. The crystal element sizes were 0.5 mm × 0.5 mm × 20 mm arranged in an array of 13 × 13 crystals and 0.7 mm × 0.7 mm × 20 mm arranged in an array of 10 × 10 crystals. The reflectors evaluated were a 65 μm thick specular reflector (3M, St. Paul, MN, Vikuiti™ Enhanced Specular Reflector) and a 50 μm thick diffuse reflector (Toray Plastics (America), Inc. North Kingstown, RI, E20). For all of the arrays the LSO crystals were unpolished, allowing for the attenuation of light along the length of the crystal element. This attenuation of light is necessary for a continuous depth of interaction PET detector, as the measure of depth of interaction is dependent upon a difference in the ratio of the signal between the two opposing PSAPDs. The front and back ends of the LSO arrays were coupled to the PSAPDs using silicone optical grease (Saint-Gobain Crystals, Hiram, OH, BC-630). The detector design is shown in Figure 1. The electronics setup is similar to that described previously (Dokhale et al., 2004).
Figure 1.
A photograph of the 0.7 mm × 0.7 mm × 20 mm LSO array with the specular reflector (left) and the prototype detector module (right) in which the LSO array is sandwiched between two PSAPDs.
2.1 DETECTOR EVALUATION
The detectors were evaluated based on the ability to resolve individual pixel elements, the depth of interaction linearity, the depth of interaction resolution and the energy resolution. The timing resolution of these detectors will be dominated by the timing resolution achievable with the PSAPDs. This has been previously characterized (Yang et al., 2008) and was not repeated in this study.
(a) Crystal Identification
In singles mode, the detector was uniformly irradiated by a 22Na point source of activity 0.74 MBq (20 μCi) for 300 s, and the resulting flood histograms were evaluated. Only events that fell within the 511 keV photopeak were used to create the flood histograms. Every recorded event was assigned a position based on:
| (1.1) |
| (1.2) |
| (1.3) |
| (1.4) |
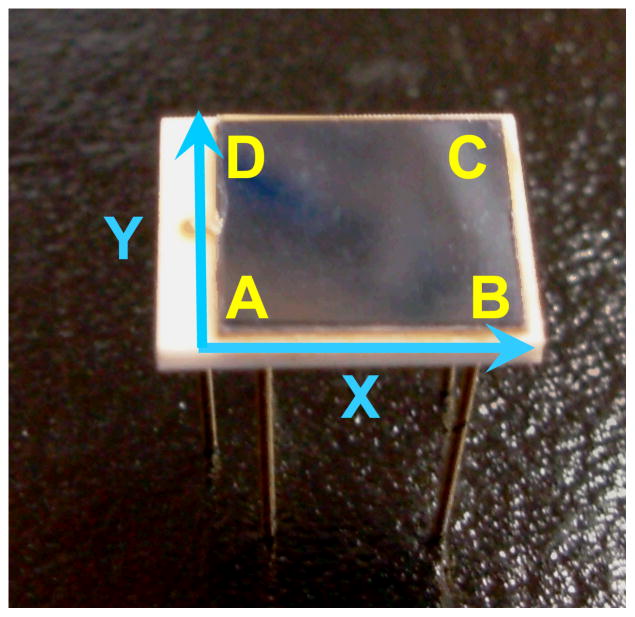
Here A1, B1, C1 and D1 are the amplitudes of the four anode signals from PSAPD1 and A2, B2, C2 and D2 are the amplitudes of the four anode signals from PSAPD2. The PSAPD coordinate system is illustrated in Figure 2. To create the final flood histograms, the information from both PSAPDs was averaged to calculate the x and y position of interaction, resulting in more robust flood histograms than if the crystal array was read out by only one PSAPD.
Figure 2.
A photograph of a PSAPD with the coordinate system labelled.
| (1.5) |
| (1.6 ) |
One property of avalanche photodiodes is that the noise decreases (for fixed APD gain) and the gain increases (for fixed bias) with decreasing temperature. To evaluate the improvement in crystal identification with decreasing temperature, flood histograms were acquired for all arrays at room temperature, 10°C, 0°C and −10°C. For these measurements the detector was placed in an 18.5 × 11.5 × 7.5 cm3 aluminum box (Bud Industries, Inc., Willoughby, OH). Nitrogen gas was passed through a copper tube that was submersed in liquid nitrogen. The cooled gas was then passed through the aluminum box to achieve cooling of the detectors. The temperature of the detectors was measured using a Type K thermocouple inside the aluminum box. For these measurements the detectors were irradiated face-on, as they would be when used in a completed scanner.
(b) DOI Resolution
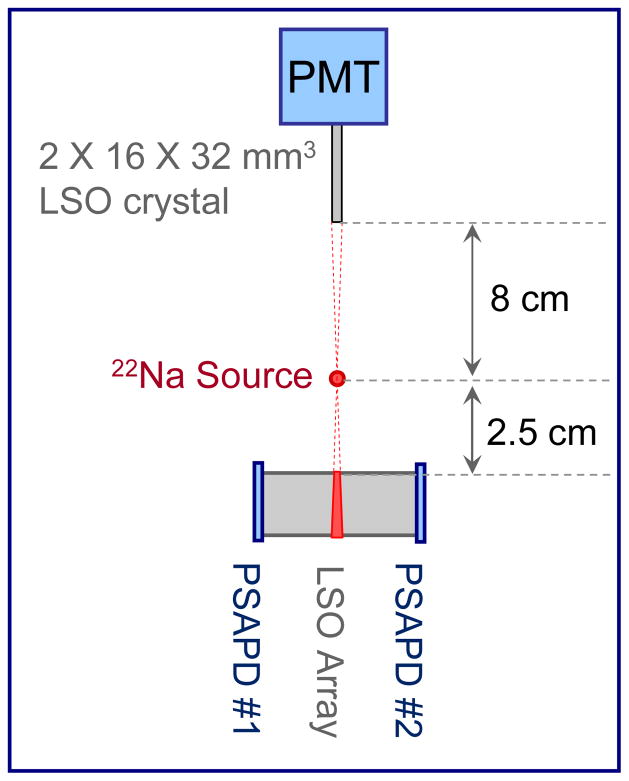
The DOI resolution was determined by placing the detector in coincidence with a slab detector consisting of a 32 mm × 16 mm × 2 mm LSO crystal on the face of a PMT (Hamamatsu, R580). A small (0.5 mm) 22Na point source of activity 0.74 MBq was used for these measurements and the detectors were irradiated side-on, as illustrated in Figure 3. To further collimate the incident gamma ray location, the 22Na source was placed at a distance of 8 cm from the slab detector and at a distance of 2.5 cm from the edge of the LSO array. The slab detector and point source were translated across the length of the array. To determine the linearity of the depth of interaction response short measurements of 120 seconds were taken at depth intervals of 1 mm. For the measurement of the DOI resolution, longer measurements of 1200 seconds were acquired, at depth intervals of 4 mm. The DOI resolution was determined for all crystals in the LSO arrays and the longer measurements were necessary to ensure that sufficient counts were acquired for all of the crystals in the array. For all of these measurements the detectors were maintained at a temperature of 0°C, using the cooling apparatus described above. The energy ratio, RE, was taken to be:
| (1.7) |
where E1 is the sum of the four anode signals from PSAPD1, and E2 is the sum of the four anode signals from PSAPD2.
Figure 3.
Illustration of the experimental set-up used to evaluate the DOI resolution. The slab detector (thin LSO crystal coupled to the PMT) and the 22Na source were mounted on a translation stage.
A look up table (LUT) with a one-to-one mapping of the crystal array to the summed images from the PSAPDs was created to define the crystal of interaction. The process for making the look up table was semi automated. The flood histograms were created and the peaks were automatically detected. From the detected peaks, a mask for the LUT was saved. This mask was modified (manually) to identify peaks that were not detected automatically. For all of the flood images, the edge crystals had to be manually identified on the mask. All of the above steps for creating the look up table were performed use Matlab (The Mathworks, Natick MA).
For every individual crystal, the histogram of the energy ratio for all events in that crystal at each depth was plotted. The energy ratios were fit to a Gaussian function and the DOI resolution was taken to be the full width at half maximum (FWHM) of the Gaussian fit. It should be noted that the source size was not accounted for in this measurement.
(c) Energy Resolution
The energy resolution was determined for every crystal in the LSO arrays. All of the measurements were taken in singles mode, with the detector irradiated from the front with a small (0.5 mm) 22Na point source of activity 0.74 MBq. The detectors were cooled to 0°C. A Gaussian function was fitted to the energy spectra after background subtraction and the energy resolution was taken to be the full width at half maximum of the Gaussian function divided by the energy (511 keV).
2.2 MONTE CARLO SIMULATIONS
All of the simulations were performed using GATE (Jan et al., 2004), a Monte Carlo simulation package based upon the well validated, multipurpose Monte Carlo package Geant4. GATE is designed to be flexible and user friendly to allow general users in the nuclear medicine community to model complex scanner geometries.
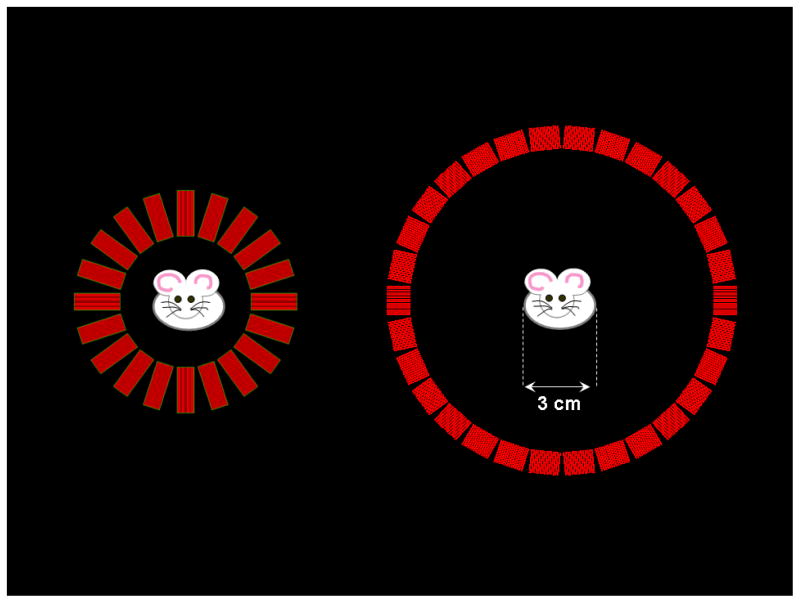
The simulated small animal PET scanner had an inner diameter of 6 cm and an outer diameter of 10 cm. There were 20 detectors in a ring and 4 rings in the scanner. The detectors in the simulation are based on the experimental detectors with 0.5 mm × 0.5 mm × 20 mm crystals in a 13 × 13 array of crystals. The energy resolution of the scanner was simulated to be 25 %, with a lower level discriminator setting of 250 keV and an upper level discriminator setting of 750 keV.
(a) Sensitivity
A positron source at the center of the field of view was simulated with the appropriate energy distribution of positrons emitted during the decay of 18F. The positron source was embedded in a water sphere of radius 0.5 cm. The sensitivity was taken to be the number of coincident events divided by the number of emitted positrons. To compare these results to an existing small animal scanner, the sensitivity of the microPET II scanner was also simulated. The measured sensitivity of the microPET II scanner is 2.3 % (Tai et al., 2003) at the center of the field of view, using a 250–750 keV energy window.
(b) Spatial Resolution
A positron point source of 18F (0.1 mm diameter sphere) inside a 10 mm × 10 mm × 10 mm water cube was simulated at the center of the field of view and at radial offsets of 5 mm, 10 mm and 15 mm from the center of the field of view, as per the NEMA protocol for the characterization of small animal PET scanners (NEMA, 2008). This point source was reconstructed using the simulated results using filtered back projection with a Shepp-Logan filter with a frequency cut-off of 1. The radial and tangential spatial resolutions were taken to be the full width at half maximum of the profiles of the reconstructed point sources, following the methodology in the NEMA protocol.
To demonstrate the effect of having good DOI resolution, the images were reconstructed with (a) no DOI information and (b) with a gaussian DOI blurring of 2 mm. For the DOI blurring of 2 mm, the true interaction point of the 511 keV photon in the detector was extracted from the simulation results and then blurred using a normal distribution with a FWHM of 2 mm as the blurring kernel, limited by the two ends of the detector crystals.
3. RESULTS
3.1 DETECTOR CHARACTERIZATION
(a) Crystal Identification
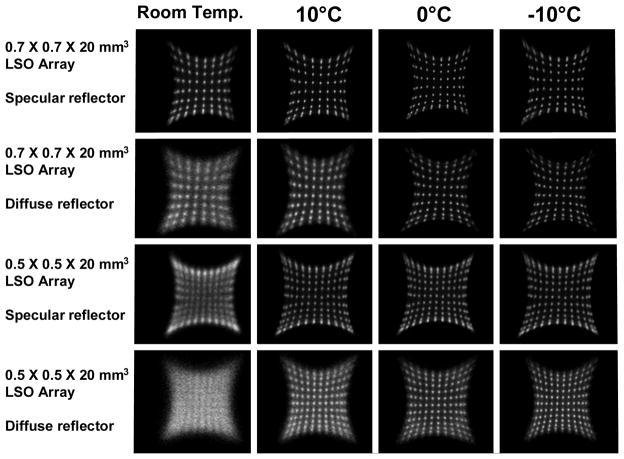
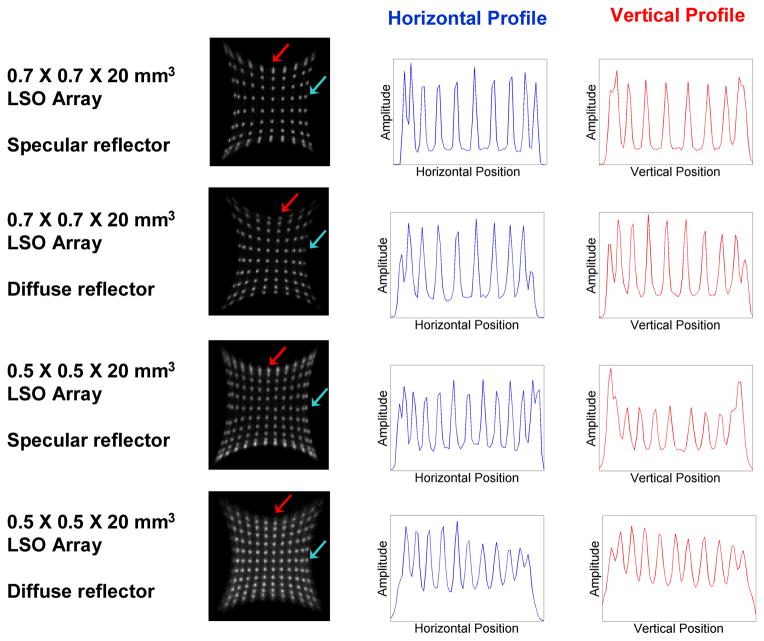
The resulting flood histograms for the four evaluated arrays at the four measured temperatures are shown in Figure 4. Horizontal and vertical profiles of the flood histograms at −10°C are shown in Figure 5, with the profile location indicated by an arrow. The peak-to-valley ratios of the profiles are reported in Table 1. In Figure 4, the effect of temperature on the flood histograms is shown. At 0°C, the flood histograms are superior to those at room temperature. This illustrates the need for efficient and reliable cooling of a system that would employ these detectors. The only detector in which all of the crystals are clearly identified is the 0.7 mm × 0.7 mm × 20 mm LSO array with the diffuse reflector at temperatures of 0°C and lower.
Figure 4.
The flood histograms for the four LSO arrays at room temperature, 10°C, 0°C and − 10°C.
Figure 5.
Horizontal and vertical profiles of the flood histograms for the cooled (−10°C) detectors. The blue arrows indicate the horizontal row evaluated and the red arrows indicate the vertical column evaluated.
Table 1.
The average peak-to-valley ratios of the flood histograms in the horizontal and vertical directions at −10°C.
| Crystal Size | Reflector | Peak-to-Valley Ratio | |
|---|---|---|---|
| Horizontal | Vertical | ||
| 0.7 mm × 0.7 mm × 20 mm | Specular | 5.5 | 4.0 |
| Diffuse | 4.0 | 3.6 | |
| 0.5 mm × 0.5 mm × 20 mm | Specular | 3.1 | 2.1 |
| Diffuse | 2.1 | 1.6 | |
(b) DOI Resolution
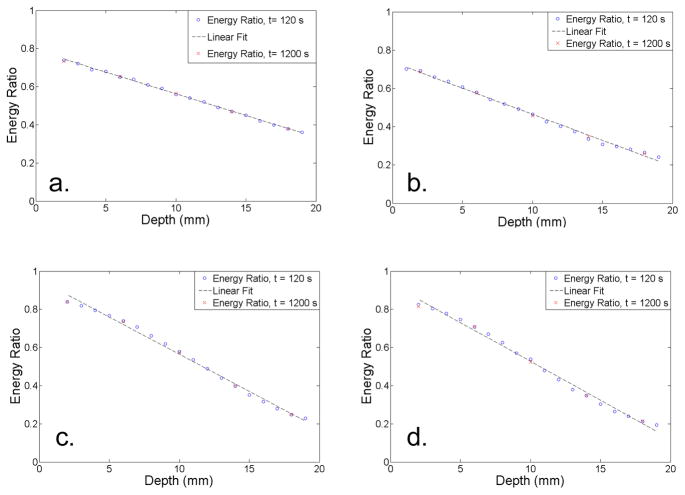
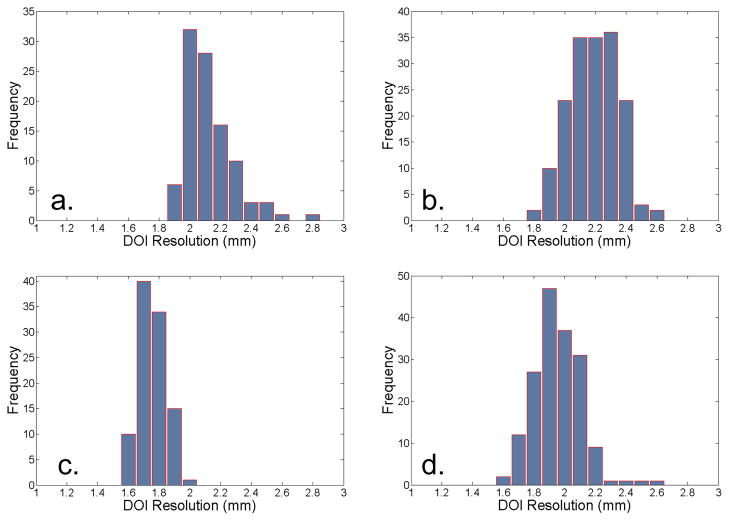
The energy ratio (RE) as a function of depth is shown in Figure 6. The energy ratio was found to be approximately linear with depth for the arrays made with the specular reflector. For the arrays constructed with the diffuse reflector, the energy ratio was sigmoidal in shape, but could be approximated as a linear function across most of the depth range. The two arrays that employed the diffuse reflector had the largest dynamic range. It should also be noted that the 120 s and 1200 s measurements yielded consistent results. The average DOI resolution for the four detectors ranged from 1.7 mm to 2.1 mm, and is summarized in Table 2. Histograms of the DOI resolution for all of the crystals in each array are shown in Figure 7. The detector with 0.7 mm × 0.7 mm × 20 mm crystals and the diffuse reflector had the best DOI resolution (1.7 mm) with the smallest standard deviation (0.1 mm).
Figure 6.
The energy ratio as a function of depth for (a) 0.7 mm × 0.7 mm × 20 mm LSO array with the specular reflector (b) 0.5 mm × 0.5 mm × 20 mm LSO array with the specular reflector (c) 0.7 mm × 0.7 mm × 20 mm LSO array with the diffuse reflector (d) 0.5 mm × 0.5 mm × 20 mm LSO array with the diffuse reflector.
Table 2.
Average DOI resolution and standard deviation for every crystal in the detectors at 0°C.
| Crystal Size | Reflector | DOI Resolution (mm) |
|---|---|---|
| 0.7 mm × 0.7 mm × 20 mm | Specular | 2.1 ± 0.2 |
| Diffuse | 1.7 ± 0.1 | |
| 0.5 mm × 0.5 mm × 20 mm | Specular | 2.1 ± 0.2 |
| Diffuse | 1.9 ± 0.2 |
Figure 7.
Histograms of the observed DOI resolutions for individual crystals in (a) 0.7 mm × 0.7 mm × 20 mm LSO array with the specular reflector (b) 0.5 mm × 0.5 mm × 20 mm LSO array with the specular reflector (c) 0.7 mm × 0.7 mm × 20 mm LSO array with the diffuse reflector (d) 0.5 mm × 0.5 mm × 20 mm LSO array with the diffuse reflector.
These values of DOI resolution do not account for the finite beam width. Geometrically, the beam width was estimated to be 0.8 mm. This calculation is based on the combination of the source size (0.5 mm) and the width of the slab detector projected on the LSO array (0.625 mm) combined in quadrature.
(c) Energy Resolution
The energy resolution was calculated for every crystal in each of the arrays. The reported energy resolutions, shown in Table 3, are averaged over all of the crystals and range from 29 % to 40%. The energy resolution obtained from the summed energy spectrum for the entire array was slightly worse than the individual crystal energy resolution.
Table 3.
Energy resolution for the entire array, and averaged across all individual crystals for detectors at 0°C
| Crystal Size | Reflector | Energy Resolution (%) | |
|---|---|---|---|
| Entire Array | Crystal Average | ||
| 0.7 mm × 0.7 mm × 20 mm | Specular | 35 | 29 ± 5 |
| Diffuse | 31 | 31 ± 9 | |
| 0.5 mm × 0.5 mm × 20 mm | Specular | 44 | 40 ± 8 |
| Diffuse | 44 | 37 ± 9 | |
3.2 MONTE CARLO SIMULATIONS
(a) Sensitivity
The sensitivity of the simulated scanner based on the 0.5 mm × 0.5 mm × 20 mm LSO arrays was 12.3 %, while the sensitivity of the simulated microPET II scanner was 2.1 %. The simulated sensitivity of the microPET II scanner was 10 % less than the reported sensitivity of the scanner. This discrepancy could be due to 511 keV photons being attenuated in the simulated phantom.
(b) Spatial Resolution
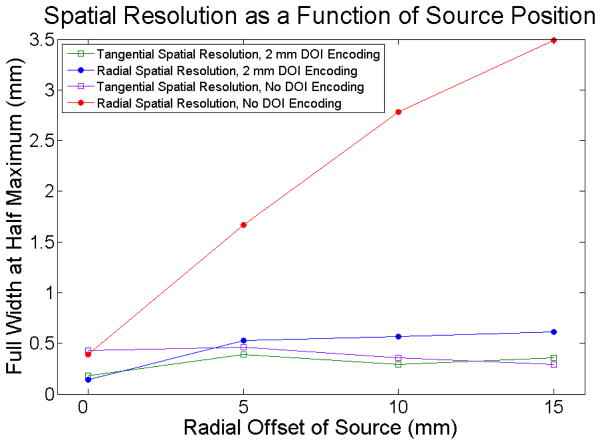
The tangential and radial spatial resolutions are shown in Figure 9. With a DOI resolution of 2 mm (roughly equivalent to that obtained experimentally with these detectors), the radial spatial resolution is uniform across the field of view. A scanner based on these very thin crystals with a small inner ring diameter would have to employ depth of interaction detectors to ensure uniform spatial resolution across the field of view.
Figure 9.
The spatial resolution across the field of view for the proposed scanner with 2 mm FWHM DOI resolution and without DOI encoding.
4. DISCUSSION AND CONCLUSIONS
For the crystal identification, in all of the arrays except for the 0.7 mm × 0.7 mm × 20 mm LSO array, it was difficult to uniquely identify all crystals at the edges of the arrays. For the arrays that used the specular reflector, it was possible to identify all of the crystals in one direction and not the other. By rotating the arrays with respect to the PSAPDs we were able to determine that this was a function of the arrays and not the PSAPDs. This “directionality” of the arrays has been observed previously (Stickel et al., 2007) and is caused by the manufacturing process in which the reflector applied in the first direction is cut as the pixels are defined in the second direction, leading to the possibility of some preferential light crosstalk through the corners of the crystals in one direction. For the detectors where it is difficult to uniquely identify the edge crystals, events may be incorrectly positioned in the detector by one crystal. The ultimate effect on system spatial resolution of some misidentification at the edges of the arrays are as yet unknown.
These results show that we can preserve DOI resolution of 2.1 mm or better when fabricating very finely pixelated detectors for use in PET. The energy resolution was poor, in part, because the location of the photopeak changes as a function of depth of interaction in the array. When implemented in a scanner, this effect could be minimized by using depth dependent energy windows.
The comparison of the two reflectors shows small differences in the flood histograms and the DOI resolution and energy resolution. When choosing a reflector, it is important to consider not only the reflectivity of the reflector, but the thickness of the reflector (which will effect the packing fraction) and the ease of use of the reflector (e.g. does it tear easily when it is being cut). The arrays fabricated with the diffuse reflector showed the greatest dynamic range in the DOI response and the crystal identification is similar for the two reflectors. The diffuse reflector would be a suitable choice for use in future generation small animal PET scanners.
Two variables that must be considered in the interpretation of the data are possible effects due to batch-to-batch variations in the LSO and inconsistencies in the manufacturing of the arrays. For these reasons all of the arrays were manufactured simultaneously from the same batch of LSO to ensure that differences between the evaluated detectors resulted from the differences in the detector design and not due to the material used or differences in the manufacturing process.
A scanner based on any of the four detector designs would offer improved spatial resolution and more uniform spatial resolution compared to present day small animal PET scanners. With a 2 cm detector thickness, the sensitivity also would be very good. The simulations show that a sensitivity of 12% would be expected with such detectors. The greatest improvements in spatial resolution will be obtained with the detectors that utilize the 0.5 mm × 0.5 mm × 20 mm LSO crystals. The difficulties in identifying the crystal in which the interaction occurred around the edge of the detector are likely outweighed by the superior sampling provided at the center of the detector. This is a question that would be best addressed with a Monte Carlo simulation study, in which varying degrees of crystal misidentification are modeled. The uniformity of the spatial resolution achieved using the 0.5 mm × 0.5 mm × 20 mm LSO arrays with 2 mm DOI encoding is clearly shown in the simulation results. It is also clear that employing a detector with DOI resolution that is ~ 4 times the crystal pitch is enough to minimize the parallax errors that would occur if no such encoding were employed.
As this is a novel detector design that has not yet been employed in PET scanners, the ultimate improvements to the sensitivity and spatial resolution of a PET system utilizing this detector can only be fully quantified when the final scanner geometry and image reconstruction techniques are optimized. Nonetheless, it is clear that with 20 mm thick detectors, 0.5 mm LSO elements that are largely resolvable and 2 mm DOI resolution, significant improvements in sensitivity, spatial resolution and resolution uniformity will be possible in comparison with currently available small animal PET scanners.
Figure 8.
An image of the simulated small animal PET scanner based on the 20 mm long DOI detectors (to scale) on the left with an image of the simulated microPET II scanner on the right. A cartoon mouse of width 3 cm is also included to demonstrate the available room for the subject.
Acknowledgments
Funding for this work was provided by NIH grants R01EB006109, R44 NS055377 and by DOE grant DE-FG02-08ER64677.
References
- Bloomfield PM, Rajeswaran S, Spinks TJ, Hume SP, Myers R, Ashworth S, Clifford KM, Jones WF, Byars LG, Young J. The design and physical characteristics of a small animal positron emission tomograph. Phys Med Biol. 1995;40:1105–26. doi: 10.1088/0031-9155/40/6/010. [DOI] [PubMed] [Google Scholar]
- Cherry SR, Shao Y, Silverman RW, Meadors K, Siegel S, Chatziioannou A, Young JW, Jones W, Moyers JC, Newport D, Boutefnouchet A, Farquhar TH, Andreaco M, Paulus MJ, Binkley DM, Nutt R, Phelps ME. MicroPET: a high resolution PET scanner for imaging small animals. Nuclear Science, IEEE Transactions on. 1997;44:1161–6. [Google Scholar]
- Dokhale PA, Silverman RW, Shah KS, Grazioso R, Farrell R, Glodo J, McClish MA, Entine G, Tran VH, Cherry SR. Performance measurements of a depth-encoding PET detector module based on position-sensitive avalanche photodiode read-out. Phys Med Biol. 2004;49:4293–304. doi: 10.1088/0031-9155/49/18/007. [DOI] [PubMed] [Google Scholar]
- Funk T, Sun M, Hasegawa BH. Radiation dose estimate in small animal SPECT and PET. Med Phys. 2004;31:2680–6. doi: 10.1118/1.1781553. [DOI] [PubMed] [Google Scholar]
- Jan S, Santin G, Strul D, Staelens S, Assie K, Autret D, Avner S, Barbier R, Bardies M, Bloomfield PM, Brasse D, Breton V, Bruyndonckx P, Buvat I, Chatziioannou AF, Choi Y, Chung YH, Comtat C, Donnarieix D, Ferrer L, Glick SJ, Groiselle CJ, Guez D, Honore PF, Kerhoas-Cavata S, Kirov AS, Kohli V, Koole M, Krieguer M, van der Laan DJ, Lamare F, Largeron G, Lartizien C, Lazaro D, Maas MC, Maigne L, Mayet F, Melot F, Merheb C, Pennacchio E, Perez J, Pietrzyk U, Rannou FR, Rey M, Schaart DR, Schmidtlein CR, Simon L, Song TY, Vieira JM, Visvikis D, Van de Walle R, Wieers E, Morel C. GATE: a simulation toolkit for PET and SPECT. Phys Med Biol. 2004;49:4543–61. doi: 10.1088/0031-9155/49/19/007. [DOI] [PMC free article] [PubMed] [Google Scholar]
- Kim JS, Lee JS, Im KC, Kim SJ, Kim SY, Lee DS, Moon DH. Performance measurement of the microPET Focus 120 scanner. J Nucl Med. 2007;48:1527–35. doi: 10.2967/jnumed.107.040550. [DOI] [PubMed] [Google Scholar]
- Laforest R, Sharp TL, Engelbach JA, Fettig NM, Herrero P, Kim J, Lewis JS, Rowland DJ, Tai Y-C, Welch MJ. Measurement of input functions in rodents: challenges and solutions. Nuclear Medicine and Biology. 2005;32:679–85. doi: 10.1016/j.nucmedbio.2005.06.012. [DOI] [PubMed] [Google Scholar]
- Lecomte R, Cadorette J, Rodrigue S, Lapointe D, Rouleau D, Bentourkia M, Yao R, Msaki P. Initial results from the Sherbrooke avalanche photodiode positron tomograph. Nuclear Science, IEEE Transactions on. 1996;43:1952–7. [Google Scholar]
- Maas MC, Schaart DR, van der Laan DJ, Bruyndonckx P, Lemaitre C, Beekman FJ, van Eijk CW. Monolithic scintillator PET detectors with intrinsic depth-of-interaction correction. Phys Med Biol. 2009;54:1893–908. doi: 10.1088/0031-9155/54/7/003. [DOI] [PubMed] [Google Scholar]
- Moses WW, Derenzo SE, Melcher CL, Manente RA. A room temperature LSO/PIN photodiode PET detector module that measures depth of interaction. Nuclear Science, IEEE Transactions on. 1995;42:1085–9. [Google Scholar]
- NEMA. Perfomance Measurements of Small Animal Positron Emission Tomographs. NEMA Standards Publication NU 4-2008. Rosslyn, Va: National Electrical Manufacturers Association; 2008. [Google Scholar]
- Saoudi A, Pepin CM, Dion F, Bentourkia M, Lecomte R, Andreaco M, Casey M, Nutt R, Dautet H. Investigation of depth-of-interaction by pulse shape discrimination in multicrystal detectors read out by avalanche photodiodes. Nuclear Science, IEEE Transactions on. 1999;46:462–7. [Google Scholar]
- Shah KS, Grazioso R, Farrell R, Glodo J, McClish M, Entine G, Dokhale P, Cherry SR. Position sensitive APDs for small animal PET imaging. Nuclear Science, IEEE Transactions on. 2004;51:91–5. [Google Scholar]
- Shao Y, Meadors K, Silverman RW, Farrell R, Cirignano L, Grazioso R, Shah KS, Cherry SR. Dual APD array readout of LSO crystals: optimization of crystal surface treatment. Nuclear Science, IEEE Transactions on. 2002;49:649–54. [Google Scholar]
- Soret M, Bacharach SL, Buvat I. Partial-volume effect in PET tumor imaging. J Nucl Med. 2007;48:932–45. doi: 10.2967/jnumed.106.035774. [DOI] [PubMed] [Google Scholar]
- Stickel JR, Cherry SR. High-resolution PET detector design: modelling components of intrinsic spatial resolution. Phys Med Biol. 2005;50:179–95. doi: 10.1088/0031-9155/50/2/001. [DOI] [PubMed] [Google Scholar]
- Stickel JR, Qi J, Cherry SR. Fabrication and characterization of a 0.5-mm lutetium oxyorthosilicate detector array for high-resolution PET applications. J Nucl Med. 2007;48:115–21. [PubMed] [Google Scholar]
- Tai YC, Chatziioannou AF, Yang Y, Silverman RW, Meadors K, Siegel S, Newport DF, Stickel JR, Cherry SR. MicroPET II: design, development and initial performance of an improved microPET scanner for small-animal imaging. Phys Med Biol. 2003;48:1519–37. doi: 10.1088/0031-9155/48/11/303. [DOI] [PubMed] [Google Scholar]
- Taschereau R, Chatziioannou AF. Monte Carlo simulations of absorbed dose in a mouse phantom from 18-fluorine compounds. Med Phys. 2007;34:1026–36. doi: 10.1118/1.2558115. [DOI] [PMC free article] [PubMed] [Google Scholar]
- Tsuda T, Murayama H, Kitamura K, Yamaya T, Yoshida E, Omura T, Kawai H, Inadama N, Orita N. A four-layer depth of interaction detector block for small animal PET. Nuclear Science, IEEE Transactions on. 2004;51:2537–42. [Google Scholar]
- Yang Y, Cherry SR. Observations regarding scatter fraction and NEC measurements for small animal PET. Nuclear Science, IEEE Transactions on. 2006;53:127–32. [Google Scholar]
- Yang Y, Dokhale PA, Silverman RW, Shah KS, McClish MA, Farrell R, Entine G, Cherry SR. Depth of interaction resolution measurements for a high resolution PET detector using position sensitive avalanche photodiodes. Phys Med Biol. 2006;51:2131–42. doi: 10.1088/0031-9155/51/9/001. [DOI] [PubMed] [Google Scholar]
- Yang Y, Wu Y, Qi J, St James S, Du H, Dokhale PA, Shah KS, Farrell R, Cherry SR. A Prototype PET Scanner with DOI-Encoding Detectors. J Nucl Med. 2008;49:1132–40. doi: 10.2967/jnumed.107.049791. [DOI] [PMC free article] [PubMed] [Google Scholar]
- Zhang N, Thompson CJ, Togane D, Cayouette F, Nguyen KQ. Anode position and last dynode timing circuits for dual-layer BGO scintillator with PS-PMT based modular PET detectors. Nuclear Science, IEEE Transactions on. 2002;49:2203–7. [Google Scholar]
- Ziemons K, Auffray E, Barbier R, Brandenburg G, Bruyndonckx P, Choi Y, Christ D, Costes N, Declais Y, Devroede O, Dujardin C, Fedorovd A, Heinrichs U, Korjik M, Krieguer M, Kuntner C, Largeron G, Lartizien C, Larue H, Lecoq P, Leonard S, Marteau J, Morel C, Mosset JB, Parl C, Pedrini C, Petrosyan AG, Pietrzyk U, Rey M, Saladino S, Sappey-Marinier D, Simon L, Streun M, Tavernier S, Vieira JM. The ClearPET(TM) project: development of a 2nd generation high-performance small animal PET scanner. Nuclear Instruments and Methods in Physics Research Section A: Accelerators, Spectrometers, Detectors and Associated Equipment. 2005;537:307–11. [Google Scholar]


