Abstract
We have determined transmembrane protein tyrosine phosphorylation (outside-in signaling) in cultured osteoclasts and macrophages in response to added native purified BSP (nBSP) and its dephosphorylated form (dBSP). There were selective/differential and potent inhibitory effects by dBSP and minimal effect by nBSP on intracellular tyrosine phosphorylation in macrophages and osteoclasts. Further studies on the down-stream gene expression effects led to identification of a large number of differentially expressed genes in response to nBSP relative to dBSP in both macrophages and osteoclasts. These studies were extended to bone resorption model using live mouse neonatal calvarial bone organ cultures stimulated by parathyroid hormone (PTH) to undergo bone resorption. Inclusion of nBSP in such cultures showed no effect on type I collagen telopeptide fragment release, hence overall bone resorption, whereas addition of dBSP abolished the PTH-induced bone resorption. The inhibition of bone resorption by dBSP was shown to be unique since in complementary experiments use of integrin receptor binding ligand, GRGDS peptide, offered only partial reduction on overall bone resorption. Quantitative RANKL analysis indicated that mechanistically the PTH-induced bone resorption was inhibited by dBSP via down-regulation of the osteoblastic RANKL production. This conclusion was supported by the RANKL analysis in cultured MC3T3-E1 osteoblast cells. Overall, these studies provided direct evidence for the involvement of covalently-bound phosphates on BSP in receptor mediated ‘outside-in’ signaling via transmembrane tyrosine phosphorylation with concurrent effects on down-stream gene expressions. The use of a live bone organ culture system augmented these results with further evidence that links the observed in vivo variable state of phosphorylation with bone remodeling.
Keywords: Bone sialoprotein, calvarial bone organ culture, osteoclasts, magrophages, tyrosine phosphorylation, downstream gene expression
There has been significant interest and conceptual developments in the area of extracellular matrix (ECM) component mediated influence on cellular function and behavior. ECM proteins have the capacity to play major roles in general tissue morphogenesis by imposing regulatory effect on cell growth and differentiation (1–6). Such biological processes are achieved in general through what is known as “outside-in” signaling via interactions between ECM proteins and cell surface receptors, in particular the integrins (7–9). One specific field in which the ECM non-collagenous phosphoproteins have been extensively studied is normally mineralizing tissues such as bone (10–19) and dentin (20–23). ECM phosphoproteins have been also found in the pathologically mineralizing tissues such as atherosclerotic plague (24), kidney stones (25), dental plaques (26) and breast and prostate tumors (27). Two most abundant and well known are bone sialoprotein (BSP) and osteopontin (OPN) that have been found to be synthesized by osteoblasts during bone formation (10–15, 28, 29). In addition to their involvement in biomineralization and its regulation (2–4, 6, 15, 18, 19, 30–32), bone ECM phosphoproteins are implicated in modulating cellular function and behavior of bone cells such as osteoblasts (6, 18, 19, 33–35) and osteoclasts (36–39), and other cells such as tumor and immune (40–42) via promoting cell adhesion, motility and transmembrane signaling. The involvement of both BSP and OPN in such biological functions have been predominantly linked to the presence of integrin receptor binding tripeptide RGD sequence in these proteins which interacts with cell surface integrins αvβ3, αvβ1, αvβ5 (36, 37, 43, 44). Other non-RGD domains of these proteins have also been found to participate in cell binding and additional integrins such as α9β1 and α4β1 (45, 46). Studies in vitro using BSP and OPN indicated that while BSP induce Ca-P apatite formation (6, 18, 31, 32, 47, 48), OPN lacks this property or is inhibitory (32, 6) except for highly phosphorylated milk OPN (49). Other studies indicated that BSP participates in bone degradation (38, 39, 41, 43, 44), whereas those using glucocorticoids, which increased expression of BSP, suggested its involvement in the anabolic-phase of bone remodeling (50). Furthermore, use of isolated osteoclasts and dead bone slices coated with BSP indicated effects of BSP on osteoclast acitivity in such pit formation assays (51). While above studies provided various evidence supporting the biological functions of BSP, in vivo implants of BSP-collagen composites in the calvarial critical defect bone repair and reparative dentinogenesis models (3–5) supported the role of BSP during biomineralization and new bone/dentin formation.
Based upon the above studies, there is considerable evidence accumulating that suggests an emerging “paradox” with respect to the biological functions of BSP in that, it has the capacity to participate in two major and opposing bone biology events, namely bone formation, i.e., an anabolic process, versus resorption, i.e., a catabolic process. Many of the biological functions of BSP and its effects on bone cells such as osteoblasts and osteoclasts detailed above have been linked to the presence of the RGD integrin binding region of this protein. However, non-RGD domains including the covalently-bound phosphates on BSP have been also shown to effect osteoclast cell attachment properties (51–54) and osteoclast activity. It was therefore a major interest to define at what cellular level and by which mechanisms BSP and its phosphorylation states impact bone resorption. In order to gain insights into these biological events we have utilized a series of interrelated biological studies and model systems to provide direct evidence for the effects of phosphorylation state of BSP on: (i) isolated and cultured macrophage and osteoclast cells by examining the “outside-in signaling” phenomenon involving intracellular protein tyrosine phosphorylation, (ii) down-stream gene expression in cultured macrophage and osteoclast cells, and (iii) PTH-induced osteoclast formation, differentiation and bone resorption activity using live mouse calvarial bone organ cultures which mimic closely the multicellular in vivo bone microenvironment.
MATERIALS AND METHODS
Osteoclast and macrophage cell cultures, and effects of added BSP and OPN forms on intracellular protein tyrosine phosphorylation
Primary mouse marrow macrophages were prepared from 5 week old male C3H/HeJ mice as described (55). Osteoclasts from primary mouse marrow macrophage were induced to differentiate by treatment for 6 days with M-CSF, RANKL, and TNF-α, while precursor cells (macrophages) were maintained for 6 days with M-CSF alone. Primary macrophages were cultured in α-MEM + 10% heat inactivated FBS with recombinant MCSF (R&D Systems) 20 ng/ml. Osteoclast cells were derived from primary macrophages cultured in α-MEM +10% heat inactivated FBS +20 ng/ml recombinant MCSF, plus 20 ng/ml recombinant RANKL (R&D Systems). Medium was changed after 3 days and replenished with α-MEM +10% FBS +20 ng/ml recombinant MCSF with RANKL and 10 ng/ml TNF-α (R&D Systems). The multinucleated osteoclasts generated were shown to be TRAP positive by fixation and staining for TRAP activity using the Leukocyte Acid Phosphatase kit (Sigma). They were also capable of resorption as assayed on dentine slices and expressd osteoclast specific genes (see gene arrays data). To evaluate the effects of added soluble BSP and OPN forms on intracellular protein tyrosine phosphorylation in osteoclasts and macrophages, such cultured cells were treated for 1.5 hr with soluble 5 µg/ml of native and dephosphorylated forms of bovine bone BSP and OPN. Control and treated cells were lysed in 10 mM Tris (pH 7.6), 500 mM NaCl, 1% TritonX-100, Protease inhibitor cocktail (Sigma), and 1 mM NaOrthovanadate (a known phosphatase inhibitor). Equal quantities of protein were separated on a 12% SDS PAGE gels and electroblotted on nitrocellulose. Western blots for protein tyrosine phosphorylation were carried out using anti-phosphotyrosine antibody (4G 10, Upstate Biotechnology) and visualized by ECL (Amersham).
Effects of native and dephosphorylated BSP on down-stream gene expressions in cultured macrophage and osteoclast cells
Mouse 1.2 dense cDNA arrays were purchased (Clontech, Palo Alto, CA) for cDNA expression profiling. Total RNA was isolated from cultured macrophage and osteoclasts, treated by soluble native and dephosphorylated BSP (described above), with Trizol reagent (GibcoBRL) and DNA contaminants were removed with RQl RNase free DNase (Promega). Probes were labeled by reverse transcription with 32PdCTP (NEN) and hybridized using Clontech reagents. Autoradiography was for 2 days (32P) and images were analyzed with Atlaslmage software (Clontech). Global normalization was used, which is based on the value of all genes expressed.
Enzymatic dephosphorylation of native bovine BSP
200 µg of native BSP (or OPN) was dephosphorylated by sequential phosphatase treatment. 6.25 units (0.12 ml) of agarose bead conjugated alkaline phosphatase was first used with BSP in 0.2 mls of 50 mM NH4HCO3, pH 8, at room temperature for 6 hrs. The beads with conjugated alkaline phosphatase were removed by centrifugation, samples dried and resuspended in 0.2 mls of 50 mM sodium acetate buffer, pH 5, and incubated with 15 units of acid phosphatase (from potato, Sigma CO) at 37°C for 6 hrs. At the end of phosphatase treatment both BSP and OPN were isolated by RP-HPLC on Vydac C-4 column to remove acid phosphatase and any other proteins introduced (12).
SDS-PAGE of OPN and BSP before and after dephosphorylation
SDS-(10%) polyacrylamide gel electrophoresis of samples of OPN and BSP before and after phosphatase treatment were carried out as previously described (14).
PTH dose-dependent type I collagen telopeptide release and TRAP activity in calvarial bone organ cultures
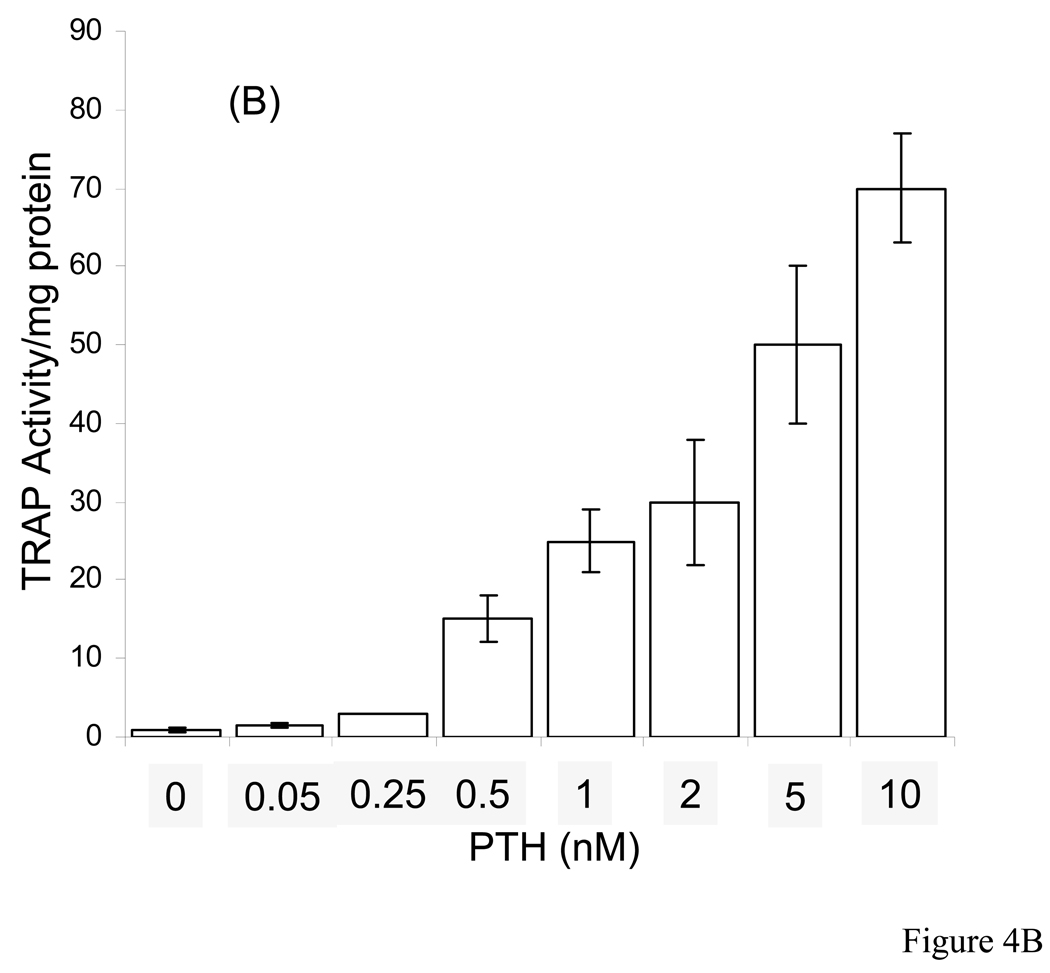
Calvaria from 7 day old neonatal CD-1 mice (Charles River Laboratories, MA) were dissected under sterile conditions, washed in culture medium and then mounted on sterile stainless steel grids in small tissue culture dishes (35 mm × 10 mm, Corning Inc., NY) as described previously (56, 57). Culture medium consisted of Dulbecco’s Modified Eagle Medium (DMEM) supplemented with bovine serum albumin (BSA), fraction V (5 mg/ml, Sigma Co.), 100 U/ml penicillin and 100 µg/ml streptomycin and 250 ng/ml amphotericin B (Gibco, Grand Island, NY) with no fetal calf serum (FCS). For evaluating dose-dependence of PTH induced bone resorption we have used three calvaria for each PTH concentration. The PTH concentrations were, 0.05, 0.25, 0.5, 1, 2, 5, and 10 nM. The media were changed every 2–3 days, i.e. 3, 5, and 7 days and kept at −20°C for type I collagen telopeptide release measurements. The calvarial bones were kept and processed for TRAP activity as described below.
Calvarial bone organ cultures and effect of BSP and synthetic GRGDS peptide on PTH induced bone resorption
Based on our PTH dose-dependent work above which indicated substantial release of calcium and significant osteoclast formation as early as 3 days of incubation, all the studies carried out in the present work used consistently 10 nM PTH concentration. Five groups of calvarial bone organ cultures (12 calvaria per group) were set up: (a) unstimulated controls (negative control); (b) bone resorption model, stimulated by parathyroid hormone (PTH, positive control) (10 nM in DMEM-BSA); (c) 10 nM PTH + 150 nM native BSP (5 µg/ml, equivalent to 100 nM, in DMEM-BSA); (d) 10 nM PTH + 150 nM dephosphorylated BSP (5 µg/ml in DMEM-BSA), and (e) 10 nM PTH + 150 nM GRGDS peptide. The calvaria were placed on stainless grids such that the bone was elevated and the media formed a thin film over the bone surface and incubated at 37°C with 5% CO2 in a tissue culture incubator (NAPCO, Winchester, VA) for 7 days. The media was changed every 2–3 days and the used media was saved frozen at −20°C for type I collagen telopeptide analyses. At day 3 and 5 four calvaria from each group were removed and processed for TRAP activity, as described below. At the end of seven days culture the remaining four calvaria from each group treated as in (a)–(e) were bisected. One half of each calvaria was fixed in 10% formalin, paraffin sectioned and stained with H & E for histological observations, and the second half was processed for TRAP activity (see below).
PTH-induced bone resorption in the presence different concentrations of GRGDSP, GRGESP and in combination of GRGDSP plus dBSP
Three groups of calvarial bone cultures were set up: (a) 10 nM PTH + GRGDSP, with the following concentrations of GRGDSP, 15 nM, 150 nM, 1.5 µM, and 15 µM, (b) 10 nM PTH + GRGESP, with the following concentrations of GRGESP, 150 nM, 1.5 µM, and 15 µM, and (c) 10 nM PTH + 100 nM dBSP + GRGDSP, with the following concentrations of GRGDSP, 150 nM, 1.5 µM and 15 µM. For each concentration of GRGDSP, GRGESP and combination of GRGDSP plus dBSP experiment 4 calvaria were used. The organ cultures were carried out and processed as described above. The media from these cultures were used to assay for type I collagen telopeptide release as a marker for osteoclast formation and bone resorption.
Histomorphometric analysis of H & E stained sections
For histomorphometric analysis four different cultured calvaria per treatment (a)–(d) above were used with two different area sections per calvaria. Total of 8 sections from 4 different cultured calvaria per group were used for obtaining the representative bone loss or inhibition of. All images were obtained using a Retiga 1300 digital camera (Qimaging, Canada) interfaced with a Leitz Dialux 20 EB microscope (Leitz, Germany). The digital images were captured using Dell computer with BioQuant software (BioQuant Image Analysis, Co., Nashville, TN, U.S.A.).
MC3T3-E1 cell cultures
MC3T3-E1 cells were plated at a density of 1 × 10⁵ per well on 9 cm2 6 well plates and cultured for 5 days in α-MEM supplemented with 150 µg/ml ascorbate and 10% FCS. After 5 days in culture, cells were treated with 10 nM PTH in the absence and presence of BSP forms and RGD peptide and cultured in α-MEM containing 2% FCS for a further 5 days. Each group was set in triplicates. At the end of the experiment each group of cells underwent lysis and the lysates were analysed for RANKL, as described below. All measurements were performed in quadruplicate.
Tartrate resistant acid phosphatase (TRAP) activity of calvarial bone organ cultures stimulated by PTH in the absence and presence of BSP
In order to assay for TRAP activity, a marker for osteoclast activity, the enzyme was released from the cellular layer of calvaria by treatment with lysis buffer, 150 mM NaCl/75 mM Tris-HCl, pH 7.4, containing 1 % Nonidet P-40, 0.05 % SDS, 1 mM benzamidine, 1 mM phenylmethanesulfonyl fluoride (serine proteinase inhibitor) and 150 µM 2,2’ dipyridyl disulphide (cysteine proteinase inhibitor). Each sample was put through 5 freeze-thaw cycles, kept on ice for 1 hour followed by centrifugation to remove calvarial bone and debris, and cell extracts were stored at −70°C until required. The TRAP enzyme activity was determined by incubation of 20 µl of each calvarial cell extract in triplicate with 100 µl of 0.1 M sodium acetate buffer, pH 5.0, containing 50 mM tartric acid, 3 mM ZnCl2 and 16 mM p-nitrophenyphosphate (pNPP, Sigma Co.) for 30 min at 37°C using 96 well microplate. At the end of incubation time, 20 ul of 1N NaOH was added to each well and absorbance at 415 nm measured. The hydrolysis of the substrate and amount of p-nitrophenol (pNP) released was calculated from a standard curve covering a range up to 12 nmol of pNP (Sigma Co.). This information was used to calculate the rate of substrate hydrolysis in terms of µmols l−1 min−1and normalized for the protein content (per mg protein) of the calvarial cell extract. One unit of TRAP activity was defined as 1 mmol of pNP released l−1 min−1per mg of protein in the cell extract. The protein content of the cell extracts was determined by modified method of Lowry’s microprotein assay using bicinchoninic acid (58).
RANKL analysis by competitive enzyme-linked immunoadsorptive assay(ELISA)
Aliquots of the bone organ culture cell layer lysis extracts generated above for TRAP activity measurements were also used to carry out RANKL determinations by ELISA. Mouse RANK ligand Duoset Elisa kit (R & D systems, Minneapolis, USA) was used with standard RANKL protein to perform quantitative competitive ELISA as described in the instructions from the manufacturer. Each measurement was carried out in triplicates.
ELISA assay for type I collagen telopeptide in calvarial bone organ cultures stimulated to undego resorption by PTH in the absence and presence of BSP forms and RGD peptide
Aliquots of the organ culture media (20 µl) were used to determine quantitatively the released collagen fragments as described in the instructions from the manufacturer (Immunodiagnostic Systems Inc., P.O. Box, Fountain Hills, AZ 85269-7063, USA). Media from five separate calvarial cultures in each group were used in duplicates. The concentrations were calculated from a calibration curve using a range of concentrations of the standard peptide supplied with the kit.
Statistics
Data are presented as means ± S.D. The significance of differences between groups was determined with the Student's t-Test for pairs of samples using the Bonferroni option within InStat GraphPad, p < 0.05 was considered significant.
RESULTS
Effects of native and dephosphorylated OPN and BSP on intracellular protein tyrosine phosphorylation in cultured macrophage and osteoclast cells
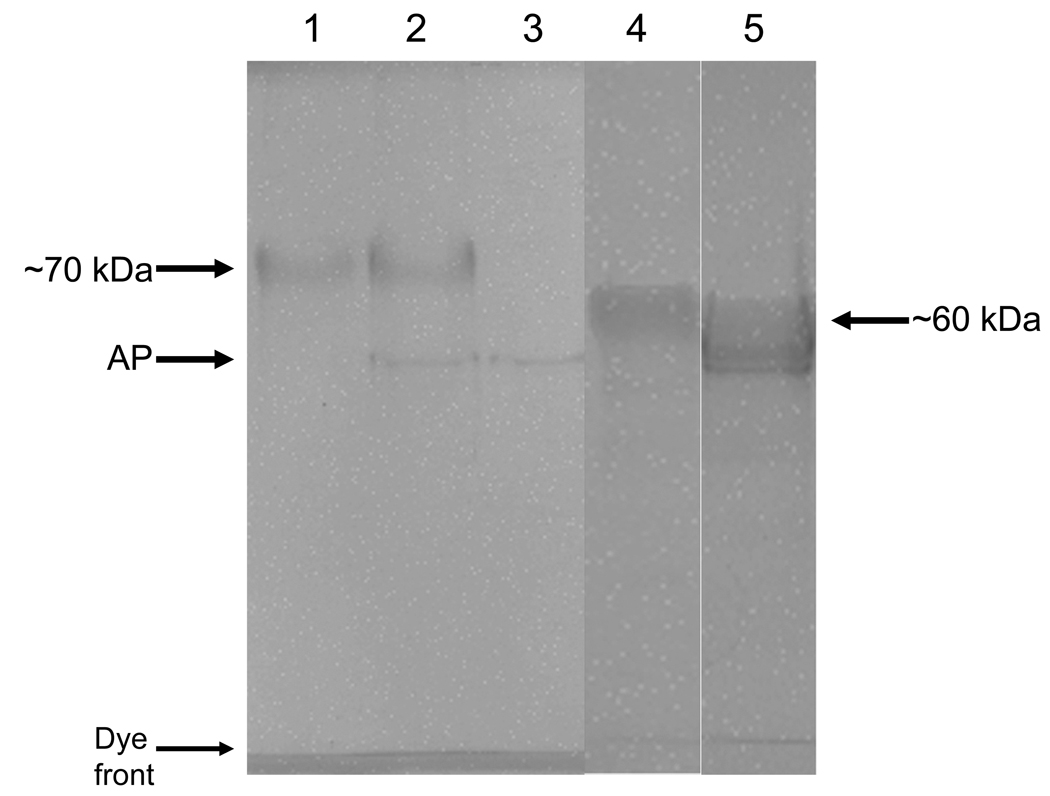
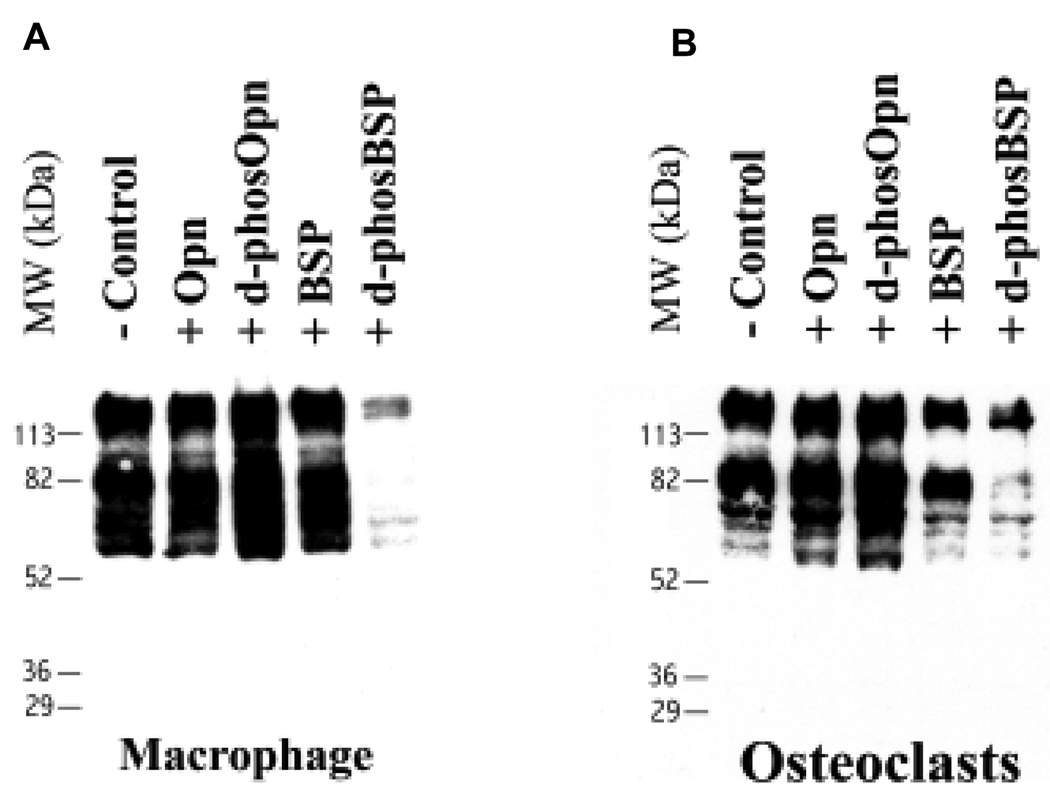
After dephosphorylation of BSP and OPN by phosphatases these proteins were shown to be still completely intact and no fragmentation occurred, Fig. 1. We have also subjected these proteins to a routine total amino-acid and phosphoamino-acid analysis, as described previously (13). Our purified native bovine BSP and OPN normally contains ~19 P-Ser and ~27 P-Ser per 1000 residues, respectively, and after double treatment with phosphatases phosphoamino-acid analysis showed no detectable levels of P-Ser in both proteins. Treatment of mouse osteoclasts and their precursors (macrophages) with dBSP resulted in marked cell retraction and decreased spreading after 1.5 hr incubation, while native BSP did not affect cell spreading. Addition of soluble nBSP to such cultures, however, did not have any such effect. To demonstrate “outside-in” signaling in response to native and dephosphorylated BSP and OPN, intracellular protein tyrosine phosphorylation was analyzed. The total cell protein tyrosine phosphorylation was substantially reduced in the presence of added soluble dBSP in both osteoclast and macrophage cells, with some molecular weight species reduced more than others, Fig. 2. In contrast, nBSP had some effect on tyrosine phosphorylation only in osteoclast cells and not in magrophage cells. Addition of soluble nOPN to already differentiated and attached cultured macrophage and osteoclast cells had no clear observable effect in either cell type, whereas the dOPN had a mild effect, as compared to dBSP, on intracellular protein phosphorylation in both cell types, and did not lead to cell retraction or rounding. This mild effect by dOPN was an increase in the tyrosine protein phosphorylation which is the opposite effect to that of the dBSP.
Figure 1. SDS-PAGE (10% polyacrylamide) of OPN and BSP before and after dephosphorylation.
Lane 1: 10 µg of BSP before phosphatase treatment; lane 2: 10 µg BSP after phosphatase treatment; lane 3: 15 units (same amount used for dephosphorylation) acid phosphatase alone; lane 4: 10 µg of OPN before phosphatase treatment, and lane 5: 10 µg OPN after phosphatase treatment. AP = acid phosphatase, a thin band of protein introduced by acid phosphatase.
Figure 2.
Anti-phosphotyrosine Western blot of intracellular protein tyrosine phosphorylation in cultured mouse macrophages and osteoclasts in the presence of BSP and OPN.
Effects of dephosphorylated and native BSP on down-stream gene expressions in macrophage and osteoclast cells
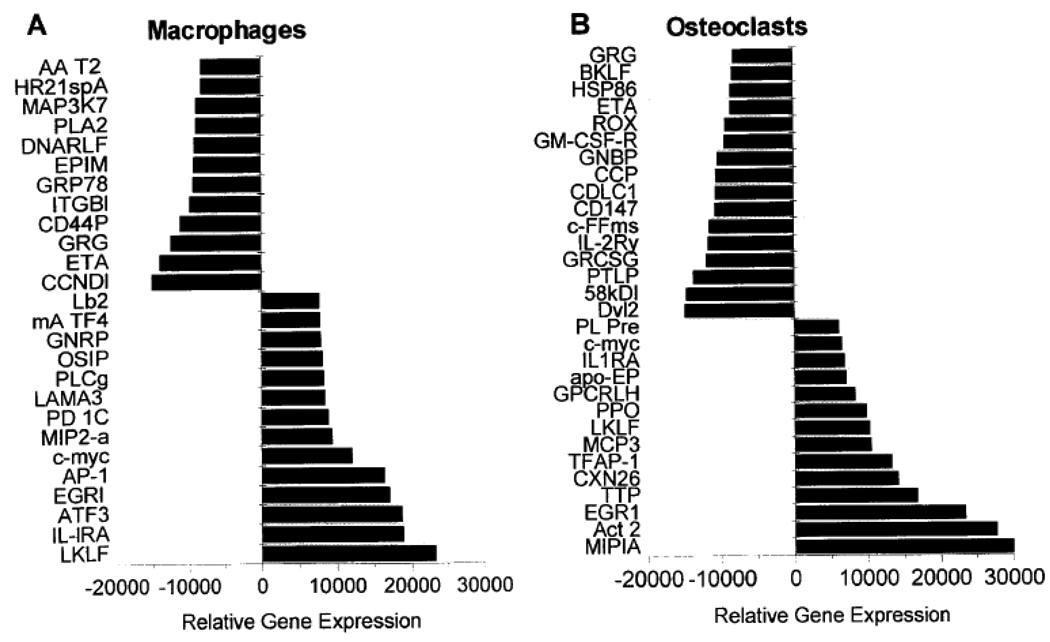
Using cDNA array analysis, the expression levels of 1200 genes were assayed using cDNA arrays. The results obtained in the present work are derived from duplicate of such experiments with the original values being average of the two separate analysis. The determined levels of each gene were normalized to house keeping genes and the up-/down regulation and the statistical significance was calculated. This was done by initial using plots of all the genes from experiments with nBSP versus dBSP and those genes deviating from slope of 1 and >> 2 fold, with p < 0.001 were used to generate Fig. 3. These genes represent a broad range of cell functions, including signal transduction, cytokines, growth factors, receptors, adhesion molecules, oncogenes, cell-cycle regulators, transcription factors and apoptosis. Comparison of macrophage to osteoclast cells showed that several genes (fourteen) were down regulated in osteoclast differentiation while fewer genes were up regulated (nine). In osteoclasts significant alterations in gene expressions were observed when effects of dBSP relative to nBSP were compared with consequence of both up- and down-regulated genes, Fig. 3. Amongst these were gelatinase B, IL3-receptor, c-src, integrin linked kinase, MIP1a/b, EGR1, TTP, c-jun and c-myc. Importantly genes effected included several osteoclast associated genes such as c-src and relA. Also overlapping sets of genes were induced or repressed in macrophages (osteoclast precursors) and osteoclasts with n-BSP and d-BSP treatment, Fig. 3. Overall, treatment with BSP forms led to alterations in down-stream gene expressions and both osteoclast and macrophage specific gene regulation events were observed. These data demonstrated clearly the biological relevance of the state of phosphorylation of BSP and the regulatory effect on osteoclast function and bone resorption.
Figure 3. Expression levels of genes induced or repressed in macrophage and osteoclast cells in response to treatment with soluble dephos-BSP relative to native BSP.
Genes with increased expression (Induced) or with decreased expression (Repressed) are presented. (A) Expression levels of genes induced or repressed in macrophage cells after treatment with dephos-BSP relative to native BSP. Induced genes relative expression. LKLF: lung Kruppel-like factor; IL-lRA: interleukin 1 receptor antagonist; ATF3: cAMP-dependent transcription factor 3; EGRl: early growth response protein 1; AP-1: transcription factor AP-l; c-myc: c-myc proto-oncogene; MIP2-α: macrophage inflamatory protein 2 alpha; PD1C: phosphodiesterase 1 C; LAMA3: laminin alpha 3 subunit precursor; PLCg: phospholipase C gamma; OSIP: oxidative stress-induced protein mRNA; GNRP: G-alpha-13 guanine nucleotide regulatory protein; mA TF4: activating transcription factor 4; Lb2: laminin B2 subunit. Decreased genes relative expression. CCNDl; CYL-l: Gl/S-specific cyclin Dl; ETA: 14-3-3 protein eta; GRG: related to Drosophila groucho gene; CD44P: CD44 antigen precursor; ITGBl: integrin beta 1; GRP78: 78-kDa glucose regulated protein; EPIM: epimorphin; DNARLF: MCM5 DNA replication licensing factor; PLA2: phospholipase A2; MAP3K7: mitogen-activated protein kinase 7; HR21spA; involved in DNA double-strand break repair; AA T2: alpha-I-antitrypsin 1–2 precursor.
(B) Expression levels of genes induced or repressed in osteoclast cells after treatment with dephos-BSP relative to native BSP. Induced genes relative expression: MIPIA: macrophage inflamatory protein 1 alpha; Act 2: macrophage inflamatory protein 1 beta; EGR1: early growth response protein 1; TTP: tristetraproline; CXN26: connexin 26; TFAP-1: transcription factor AP-l; MCP3: monotype chemoattractant protein 3; LKLF: lung Kruppel-like factor; PPO: piml proto-oncogene; GPCRLH: G protein-coupled receptor LCRI homolog; apo-EP: apolipoprotein E precursor; IL1RA: interleukin 1 receptor antagonist; c-myc: c-myc proto-oncogene; PLPre: plasminogen precursor. Repressed genes relative expression: Dvl2: dishevelled tissue polarity protein; 58kDI: 58-kDa inhibitor of RNA-activated protein kinase; PTLP: phospholipid transfer protein precursor; GRCSG: glutamate receptor channel subunit gamma; IL-2Ry: interleukin-2 receptor gamma subunit; cFFms: c-Fms proto-oncogene; CD147: cd147 antigen; CDLC1: cytoplasmid dynein light chain; CCP: cystatin c precursor; GNBP: guanine nucleotide binding protein; GM-CSF-R: granulocyte-macrophage cst receptor; ROX: basic helix-loop-helix leucine zipper protein rox; ETA: 14-3-3 protein eta; HSP86: heat shock 86-kDa protein; BKLF: CACCC Box- binding protein BKLF; GRG: related to Drosophila groucho gene.
Osteoclasts and bone resorption in response to PTH stimulation in the absence and presence of BSP forms observed histologically and by quantitative histomorphometric analysis
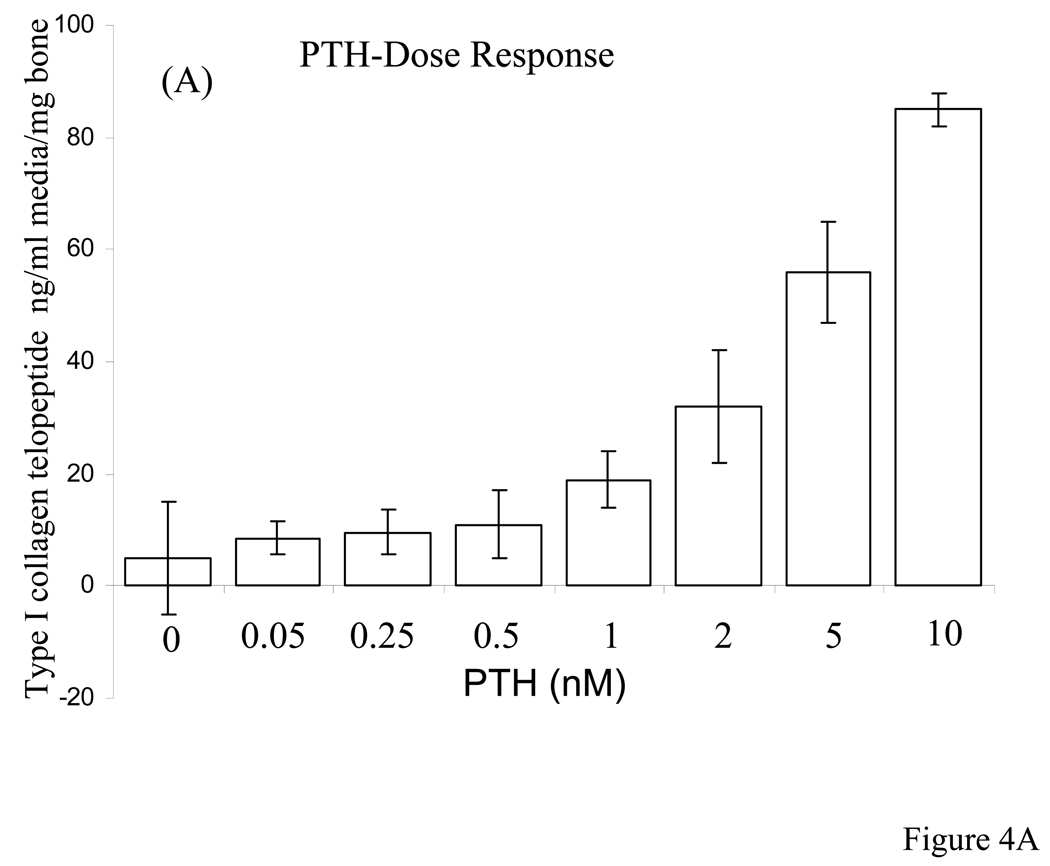
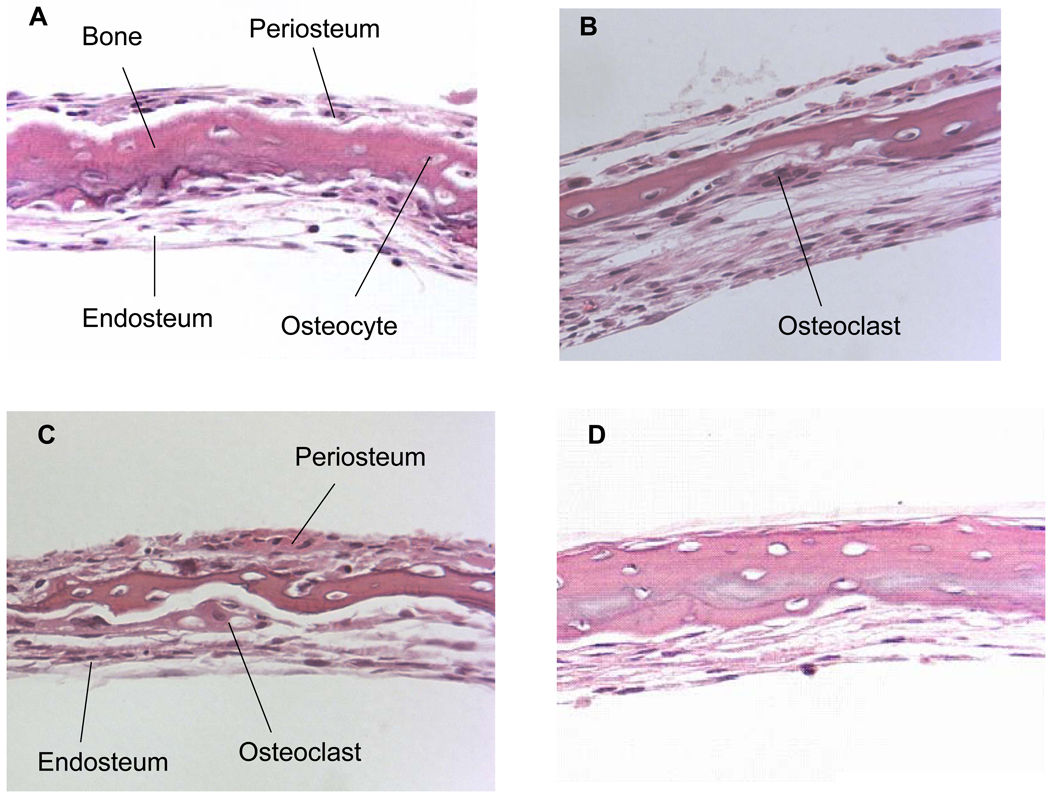
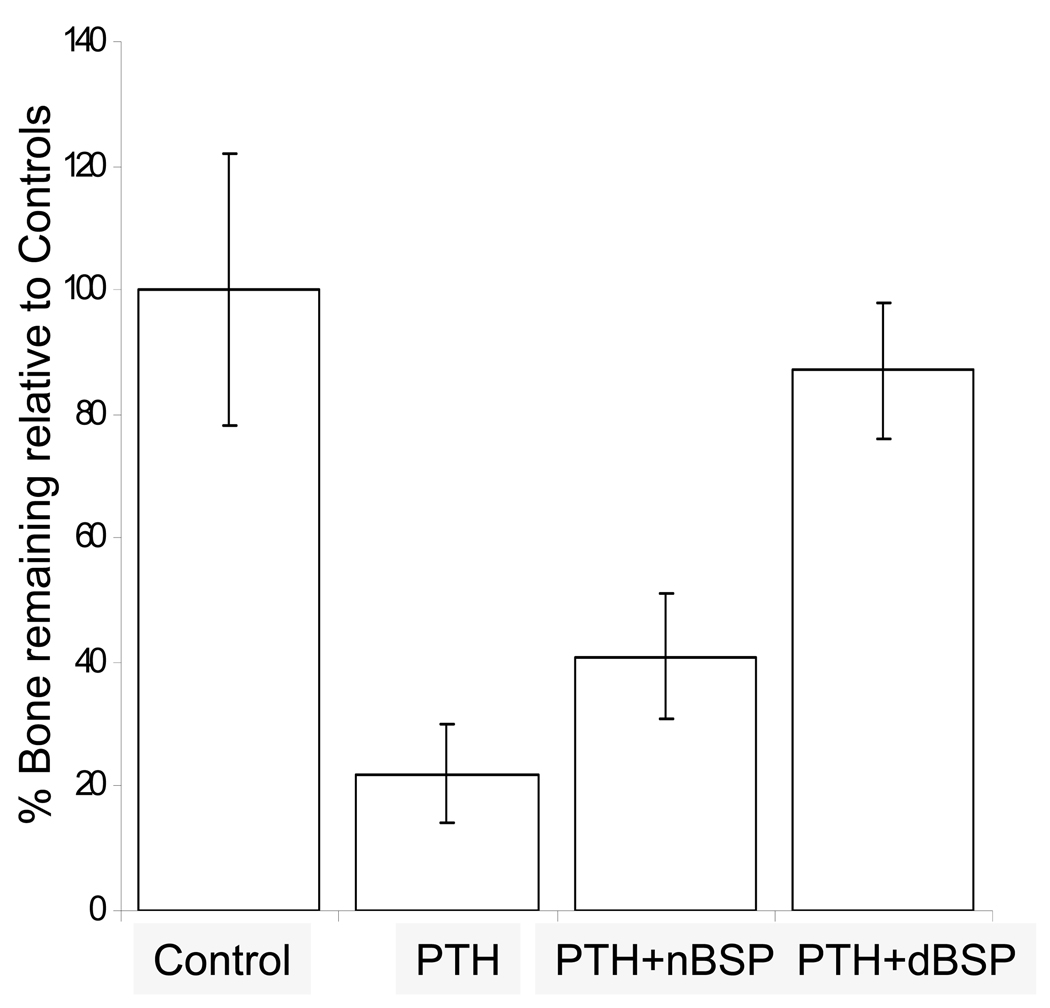
Based on the above observations we were interested to observe osteoclasts, their activity and bone resorption in these live organ cultures stimulated by PTH in the absence and presence of native and dephosphorylated BSP. Dose-dependent studies with PTH indicated that 10 nM PTH concentration was sufficient for rapid osteoclast formation and bone resorption in our calvarial bone cultures and appropriate in this study, Fig. 4. Based on this we have used 10 nM PTH for all of the experiments described herein. The histological observations of H & E stained sections of calvarial bones cultured and treated with PTH in the absence and presence of BSP forms showed significant osteoclastic activity and bone resorption readily observable for the groups PTH treated and PTH + native BSP but not for the groups untreated and PTH + dephosphorylated BSP, Fig. 5 panel 1. Histomorphometric analysis of the H & E sections (four different cultured calvaria per group and two sections from each bone) for bone matrix of the control and experimental calvarial bones showed that relative to controls: (a) the PTH alone treated cultures lost 77 ± 8 % of their mineralized bone matrix, (b) the PTH + native BSP cultures lost 58 ± 5 % of their mineralized bone matrix, and (c) the PTH + dephosphorylated BSP showed almost no loss of mineralized bone matrix, 11 ± 10 %, Fig. 5 panel 2.
Figure 4. PTH dose-dependent release of calcium and TRAP activity in the media of calvarial bone organ cultures.
A: Change in cumulative calcium release in media as a function of PTH concentration, and B: TRAP activity as a function of PTH concentration. The concentrations of PTH used were 0.05, 0.25. 0.5, 1, 2, 5, and 10 nM. The changes in calcium and TRAP activity were determined over a 7 day culture period.
Figure 5. H&E stained paraffin sections of calvarial bones cultured for 7 days stimulated by PTH to resorb in the absence and presence of BSP forms and quantitative histomorphometric analysis.
Panel 1; A: control; B: in the presence of 10 nM PTH; C: in the presence of 10 nM PTH + 5 µg/ml of native BSP; D: in the presence of 10 nM PTH + 5 µg/ml of dephosphorylated BSP. Note the multinucleated resorbing osteoclast in B and C on the endosteal side. All the sections are at 25x magnification. Panel 2; Histomorphometric data for each of the groups represented by A–D expressed as % amount of bone remaining relative to the controls. Four different cultured calvaria for each group (a)–(d) were used with two sections per calvaria for computing the overall histomorphometric data. (a) the PTH alone treated cultures lost 77 ± 8 % of their mineralized bone matrix, (b) the PTH + native BSP cultures lost 58 ± 5 % of their mineralized bone matrix, and (c) the PTH + dephosphorylated BSP showed almost no loss of mineralized bone matrix, 11 ± 10 %.
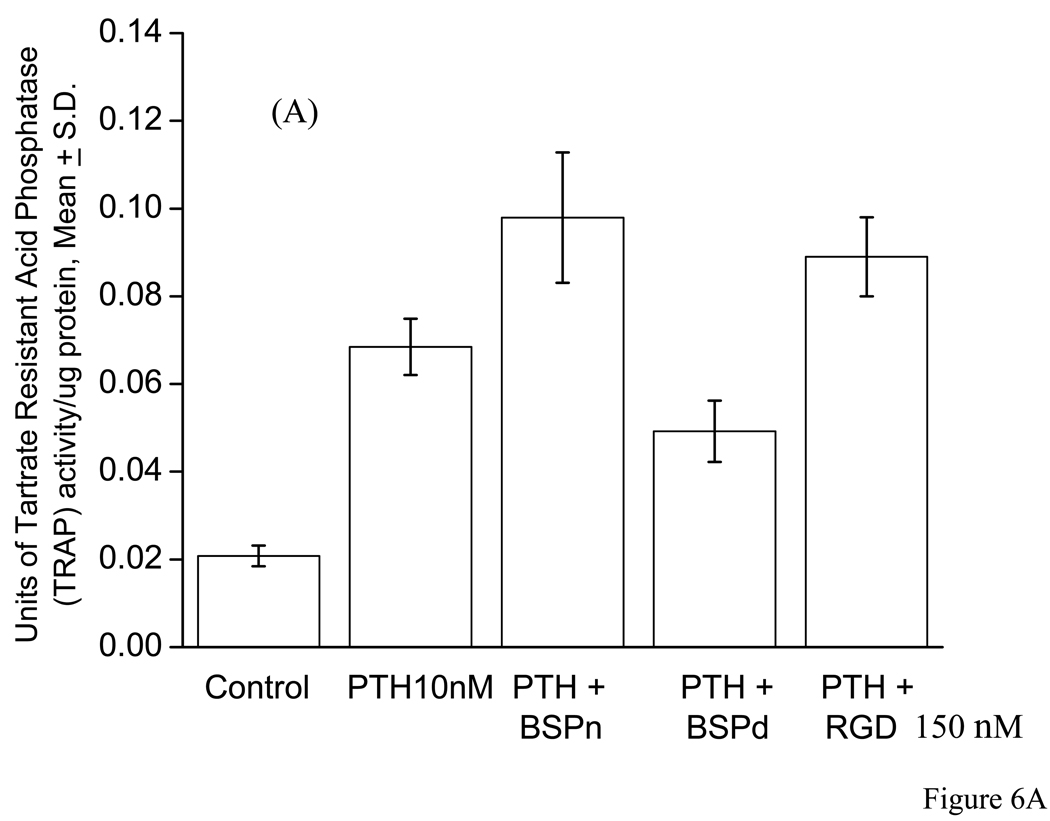
Quantitative analysis of the changes in media type I collagen telopeptide and bone cellular layer extract TRAP activity in response to parathyroid hormone (PTH) in the absence and presence of bone sialoprotein (BSP) forms and GRGDS peptide in mouse calvarial bone organ cultures
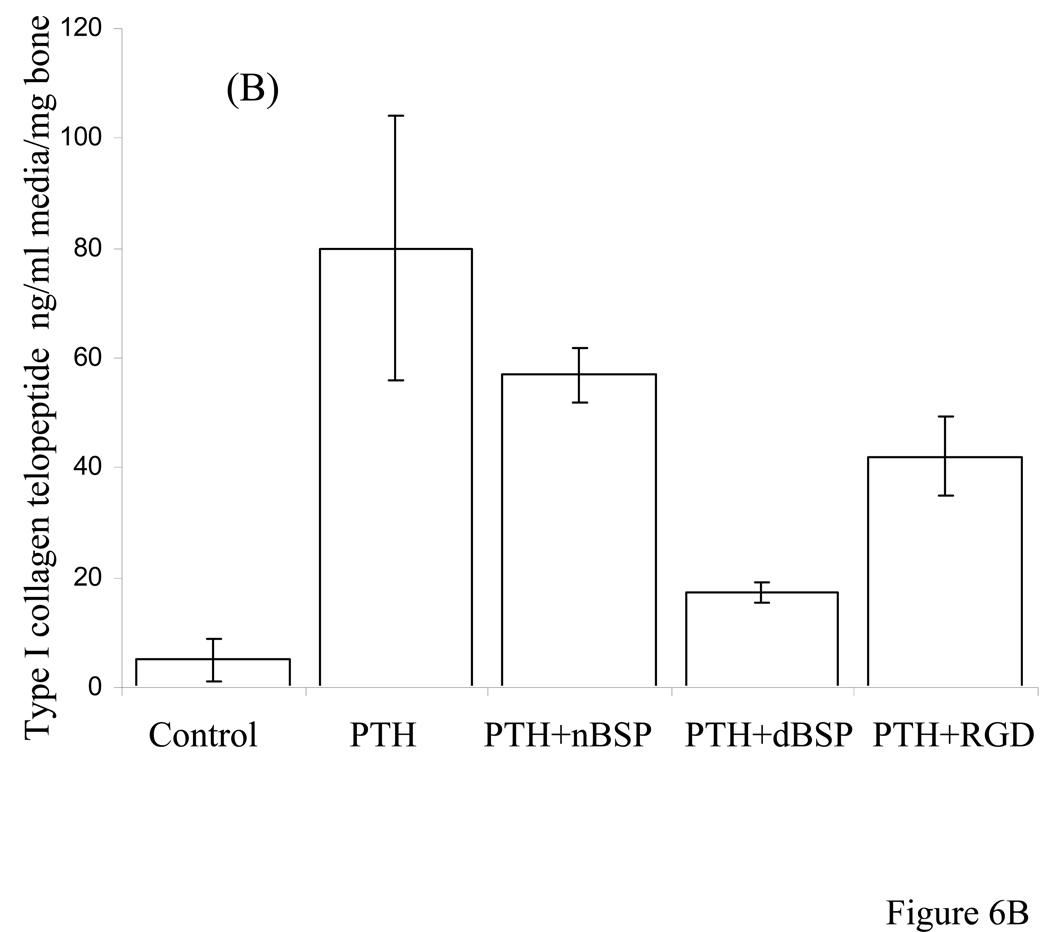
The total change in media type I collagen telopeptide and TRAP activity were determined for 7 day old postnatal mouse calvaria, cultured in groups: (a) unstimulated controls, (b) stimulated by PTH to undergo resorption, (c) PTH + native BSP and (d) PTH + dephosphorylated BSP. We have defined the degree of bone degradation by quantitatively biochemical analysis of the media for type I collagen telopeptide in our bone organ cultures. Figure 6A shows changes in media type I collagen telopeptide for the groups (a)–(d) as a function of time of organ culture over a 7 day culture period. These data were normalized for the original wet weight of calvarial bones used at the beginning of the cultures. Unstimulated controls, group (a), showed some uptake of calcium and the PTH treated group, (b), showed substantial release of type I collagen telopeptide. The release of type I collagen telopeptide in response to PTH did not change in the presence of the native BSP, group (c), whereas in the presence of dephosphorylated BSP the type I collagen telopeptide release was significantly (p<0.001) inhibited, group (d). This signifies that dephosphorylated BSP has a potent inhibitory action either directly or indirectly on PTH induced bone resorption. In addition, quantitative TRAP enzyme activity measurements of the calvarial bone cellular layer extract were consistent with the above results, Fig. 6B. The TRAP activities were expressed as units of activity/mg total protein content of the cell layer extract to normalize for cell numbers. Both the results for type I collagen telopeptide and TRAP activity were analyzed by two sample Student’s t test to show statistical significance (p values are recorded in the legend of Figure 6).
Figure 6. Type I collagen telopeptide ELISA assay in the media, and the TRAP activity of calvarial bone cultures stimulated to resorb by PTH in the absence and presence of BSP forms and GRDGS peptide.
Panel A: Type I collagen telopeptide release in to the media. Statistical two sample Student’s t test indicated that released collogen fragment was statistically significant and different for control versus PTH (p < 0.0001), control versus PTH + native BSP (p < 0.001), control versus PTH + dephosphorylated BSP (p < 0.003), PTH versus PTH + native BSP (p < 0.1), PTH versus PTH + dephosphorylated BSP (p< 0.001), and PTH versus PTH + GRGDS peptide (p < 0.05).
Panel B: TRAP activity of calvarial bone cellular components. Statistical two sample Student’s t test indicated that TRAP activity was statistically significant and different for control versus PTH (p < 0.001), control versus PTH + native BSP (p < 0.001), control versus PTH + dephosphorylated BSP (p = 0.003), PTH versus PTH + native BSP (p < 0.01), PTH versus PTH + dephosphorylated BSP (p = 0.03), and PTH versus PTH + GRGDS peptide (p < 0.05).
Concentration-dependent effects of GRGDSP, GRGESP and combination of dBSP and GRGDSP in PTH-induced bone resorption in calvarial organ cultures
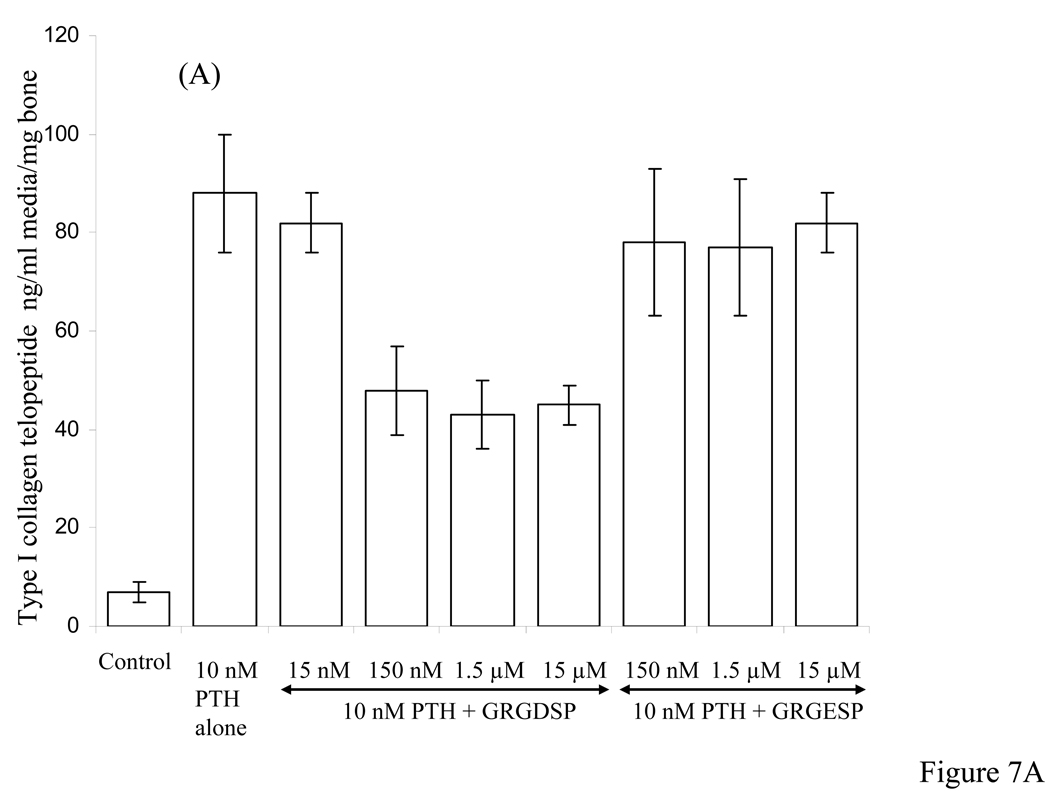
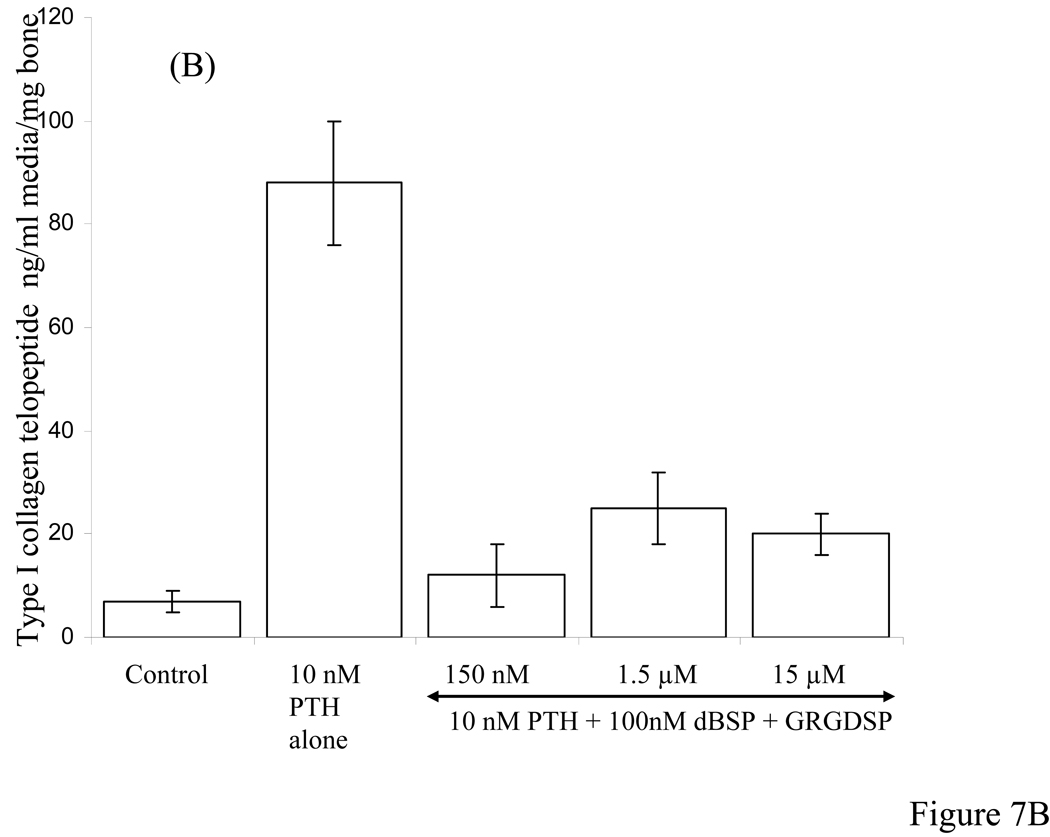
Figure 7A shows results of collagen type I telopeptide assay for cultures induced to undergo bone resorption in the presence PTH and added different concentrations of the synthetic peptides GRGDSP and GRGESP. At 15 nM GRGDSP concentration there was no reduction in the type I collagen release whereas at higher concentrations between 150 nM to 15 µM there was 40% to 50% reduction. Use of RGD analogue GRGESP however, showed no significant inhibition of PTH-induced bone resorption at concentrations between 150 nM to 15 µM. Figure 7B shows results of competing dBSP with added different concentrations of GRGDSP between 150 nM to 15 µM. At concentrations as high as 150 fold excess GRGDSP over that of dBSP concentration, the inhibitory action of dBSP on PTH-induced bone resorption was only mildly effected.
Figure 7. Type I collagen telopeptide ELISA assay in the media of calvarial bone cultures stimulated to resorb by PTH in the presence of different concentrations of synthetic peptides and combination of dBSP and synthetic peptide.
A: Effect of different concentrations (as indicated by horizontal arrow) of GRGDSP and GRGESP peptides showing ~ 40% inhibition and no inhibition, respectively, on type I collagen release stimulated by 10 nM PTH. B: Effect of a combination of 100 nM dBSP and varying concentrations of GRGDSP peptide between 150 nM to 15 µM on type I collagen fragment release stimulated by 10 nM PTH.
RANKL analysis by ELISA of calvarial bone organ cultures and MC3T3-E1 cells
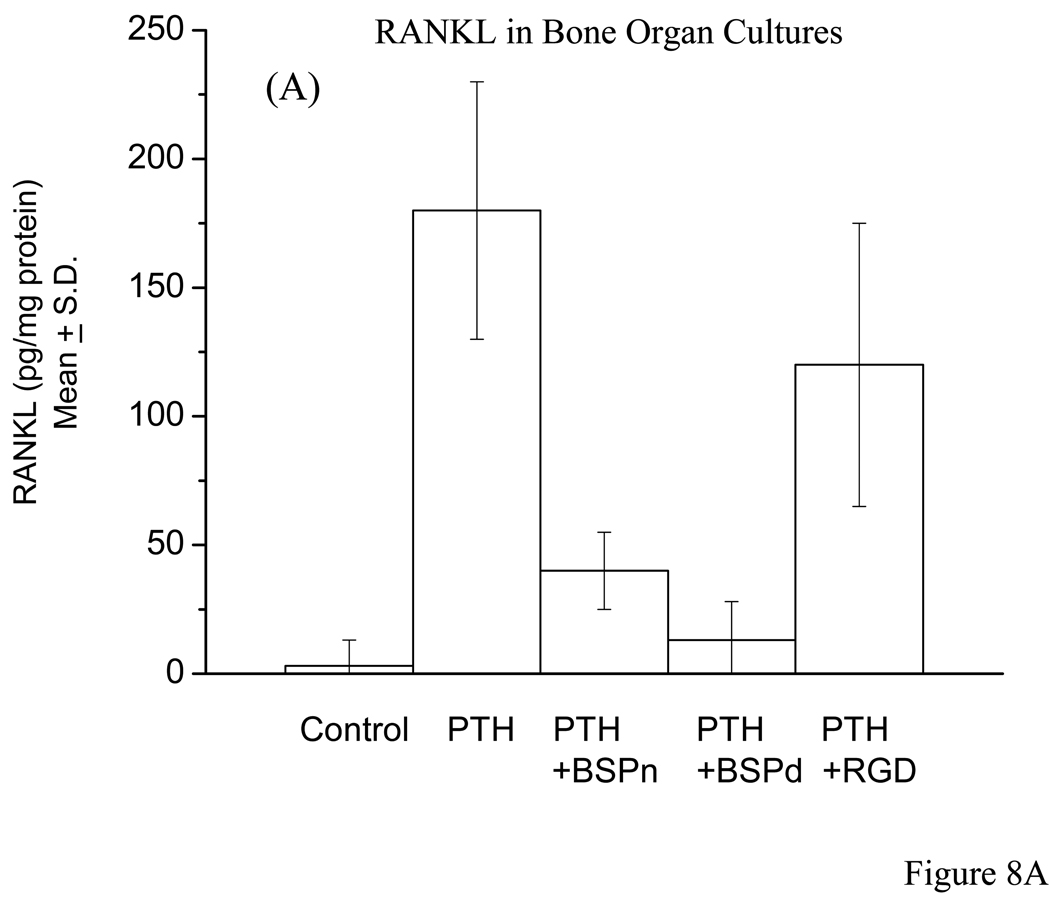
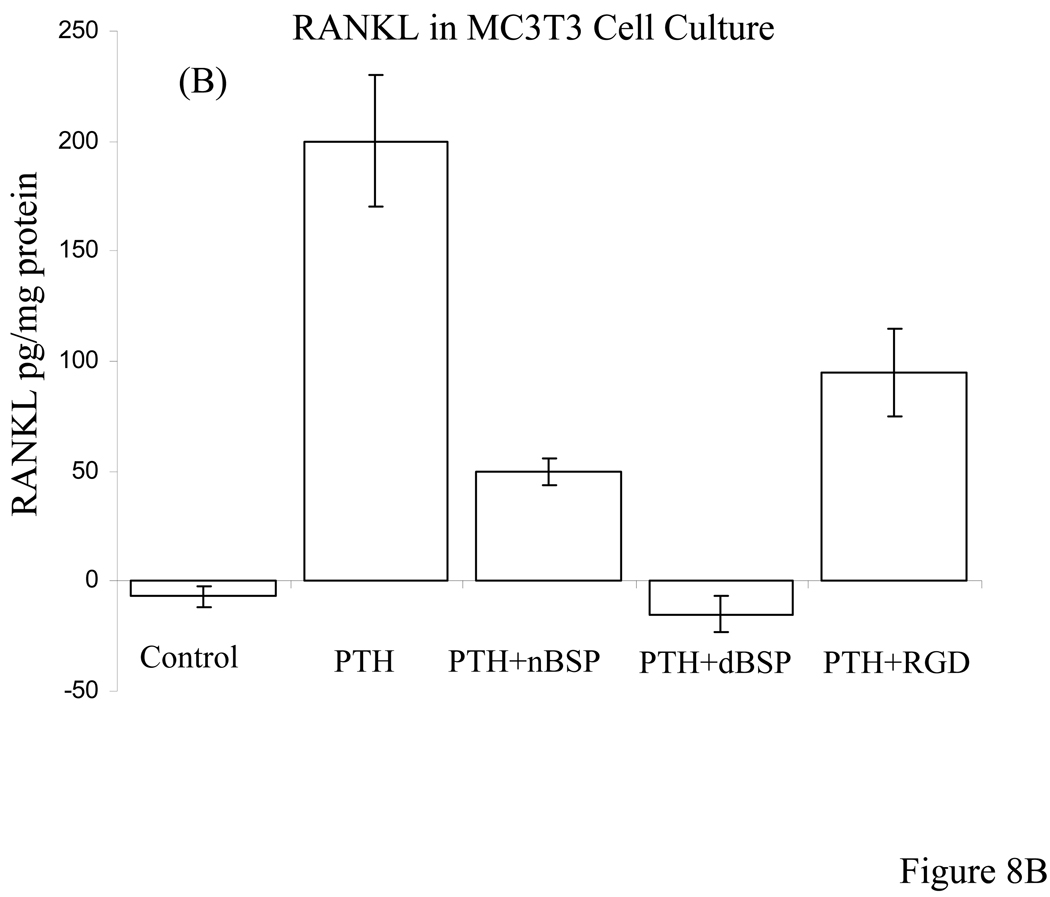
The competitive ELISA assay for RANKL of calvarial bone cell layer extracts were carried out for controls versus (a) PTH alone, (b) PTH + nBSP, (c) PTH + dBSP, and (d) PTH + RGD peptide treated bone cultures. The quantitative ELISA assay data for RANKL determination were expressed as pg of RANKL/mg of total protein content of the bone cell layer extract to normalize the results for bone cell number. The data clearly demonstrated that the controls contained almost no RANKL (5 ± 8 pg RANKL/mg protein) whereas PTH treated bones, cultures in (b) above, had substantial RANKL expression (175 ± 35 pg RANKL/mg protein). In the presence of nBSP, cultures in (c) above, the level of RANKL expression reduced ~3 fold whereas cultures in the presence of dBSP, (d) above, showed ~20 fold reduction in RANKL expression. The differences in the RANKL expression between PTH alone treated bones versus those of cultures in the presence of nBSP and dBSP were both statistically significant with p < 001, Fig. 8A. However, those of the dBSP treated bones were close to the basal levels, i.e., those of controls. Contrary to these the bones cultured in the presence of RGD peptide had only a mild effect on RANKL expression, ~1.2 fold reduction, and this was not statistically different than the RANKL expression in the presence of PTH alone, Fig. 8A. Consistent with these results cultured MC3T3-E1 cells treated with PTH in the absence and presence of added BSP forms and RGD peptide showed very similar data and consistent with the above results, Fig. 8B.
Figure 8. Quantitative RANKL determination by ELISA in bone organ and MC3T3 cell cultures.
A: The RANKL measurements were carried out for bone organ cell layer extracts that were cultured in absence of PTH (controls) and presence of PTH alone, PTH + nBSP, PTH + dBSP and PTH + synthetic RGD peptide. The control bones had almost no measurable RANKL expression whereas PTH treated bone expressed substantial levels of RANKL. The RANKL levels in bones treated by PTH alone were statistically different from those in with added nBSP and dBSP (p < 0.001). The levels of RANKL in bones with added nBSP versus dBSP were statistically different (p < 0.005). The RANKL levels in PTH alone treated bones were statistically not different than those treated by PTH + RGD peptide (p > 0.06). B: Quantitative RANKL determination in cultured MC3T3 cells treated with PTH in the absence and presence of BSP forms and RGD peptide. The data shows general similar levels and pattern as those for bone cultures in “A” above.
DISCUSSION
We (13–16) and others (6, 18, 19, 22, 23, 32, 49, 52, 53) postulated that many of the varied biological functions of this protein are intimately related to and coupled with the state of phosphorylation. This was based on the concept that one variable structural component of this protein in vivo was the state and extent of phosphorylation as a function of tissue formation, developmental stage and age (13–16). Clearly, these structural features raise a series of additional possible biological functions of phosphorylation and how this may couple with other amino-acid sequence domains to provide specific functional consequence.
Biological effects of native bone derived BSP (nBSP) and dephosphorylated BSP (dBSP) on macrophage and osteoclast intracellular protein tyrosine phosphorylation and downstream gene expressions
To gain further insights to the mechanism and biological implications of BSP and its phosphorylation forms on bone remodeling, we investigated initially the effects of nBSP and dBSP on isolated cultured mouse macrophage and osteoclast cells. To ascertain protein specificity we also included in this study another major bone ECM highly glycosylated and phosphorylated protein, namely OPN. The use of native and dephosphorylated BSP and OPN revealed substantial protein specificity, dependence of response on the state of phosphorylation and cell type selectivity, viz., macrophages versus osteoclasts, Fig. 2. Furthermore, the data clearly demonstrated for the first time the involvement of BSP and its forms through cell receptor binding and impacting “outside-in” signaling through protein tyrosine phosphorylation in modulating the macrophage and osteoclast function. Consistent with this gene expression level profiling identified downstream markers of BSP signaling and genomic effects in cultured macrophage and osteoclast cells treated with soluble native and dephosphorylated BSP. Although our gene array was performed using “common” genes, as opposed to an array comprised of specifically osteoclast cDNA, nevertheless genes associated with osteoclasts do increase expression, as demonstrated by c-src and relA. Both macrophages and osteoclasts showed differential expression and down/up regulated expression of a series of genes when cells were treated with dBSP and nBSP (Fig. 3). Amongst these genes were, for example, IL-3 receptor, MAP kinase gene and gelatinase B, each of which can be postulated to play a role in osteoclast formation and function. It should be noted that there were a far greater number of genes up/down-regulated by dBSP relative to nBSP, however, for space and clarity reasons we have chosen to present herein (Fig. 3) only the top 12–16 genes showing the highest relative difference. Based on the profound inhibitory effect of dBSP on intracellular tyrosine phosphorylation in both macrophages and osteoclasts (Fig. 2), the effects on down-stream gene expressions by dBSP relative to nBSP may be interpreted to predominantly reflect the down- or up-regulation induced by dBSP, since nBSP had no significant effect on tyrosine phosphorylation in macrophages. This same interpretation may not be as easy to apply to the data for osteoclasts because native BSP showed some effect on tyrosine phosphorylation, and hence, the relative difference in gene expressions are likely result of the combined effects of dBSP relative to nBSP. These results provide evidence in support of the influence of state of phosphorylation of BSP on osteoclast formation and their bone resorption activity in bone organ cultures, see below.
Biological significance of the state of BSP phosphorylation on bone resorption using mouse calvarial bone organ cultures
The results obtained above led us to further hypothesize that nBSP and dBSP will have significant differential impact on in vivo bone resorption. The effect of dBSP on PTH induced bone resorption as assessed by several different quantitative biochemical analysis, type I collagen fragment release assays, TRAP activity and RANKL expression and histological/histomorphometric evaluation indicated the influence on osteoclast formation/differentiation, Fig. 5–Fig. 7. This is related to the multicellular bone cultures having the capacity to involve coupling of osteoblast, mesenchymal cell physiology and macrophages under the influence of PTH. Osteoclast formation and differentiation induced by PTH occur through effects on osteoblasts to produce RANKL, an essential factor in the formation of osteoclasts from progenitor cells. We have demonstrated that in bone organ culture system RANKL levels are clearly up-regulated by PTH and in the present of dBSP it was substantially reduced, ~20 fold, almost to the level of control bones with no added PTH, Fig. 8A. This indicates that mechanistically at least one of the targets of dBSP is its down-regulation of the RANKL production by “progenitor osteogenic lineage cells” or osteoblasts and hence, inhibition of osteoclast formation/differentiation and bone resorption. This conclusion was supported by RANKL analysis using MC3T3 osteoblast cell cultures in the absence and presence of BSP forms and RGD peptide which showed similar levels to those found for bone organ cultures, Fig. 8B. The lack of similar inhibitory effect by nBSP on bone resorption does not, however, exclude its possible capacity to stimulate bone resorption. In our experiments both nBSP and PTH were included in the media from the beginning of cultures and continued as such throughout the experimental period. Hence, the stimulatory action of PTH could overshadow such an effect caused by nBSP. It is also noteworthy that while nBSP had no effect on TRAP activity and type I collagen release, Fig. 6, it reduced RANKL (~4 fold, from 200pg/mg protein to 50 pg/mg protein), Fig. 7 & Fig. 8. However, the level of RANKL at 50 pg/mg protein is still sufficient to induce osteoclast formation and bone resorption. These observations and differences are related to the “receptor activation and threshold” phenomenon.
We conclude that the effects of dBSP in cell and bone organ culture experiments are not solely related to presence of RGD sequence in BSP since dBSP and nBSP have differential effects and that in parallel experiments using synthetic GRGDS peptide did not reflect the same effect or only mild effects are seen. Clearly, the lack of RGD peptide effect on PTH induced TRAP activity and RANKL production demonstrates that the receptor(s) utilized by dBSP and its forms in inhibition of bone resorption and down-regulation of RANKL production is different than the well known “integrin” receptors. Furthermore, mechanistically the PTH receptors are distinct from the integrin receptors. Although osteogenic progenitor cells/osteoblasts have integrin receptors, interaction of RGDS peptide with these receptors do not impact the RANKL production to the level necessary for inhibition of osteoclast formation. One way the RGDS peptide reduces to some extent type I collagen fragment release is to affect the already formed osteoclasts at the cell attachment level. This is quite distinct from the effects of dBSP where PTH-induced RANKL production is inhibited and hence the osteoclast formation. These conclusions have been further supported by experiments using organ cultures and competing dBSP with increasing concentrations of GRGDS peptide. The results showed that despite the use of greater than two orders of magnitude excess of GRGDS peptide over dBSP, the inhibitory effect of dBSP on PTH-induced bone resorption was not reversed by GRGDS peptide, Fig. 7B.
Other studies have indicated that BSP promotes mineral deposition in osteoblast cell cultures (6, 18, 48, 59), and differentiation of bone marrow cells to osteoblasts (2). Consistent with these studies recently BSP knockout mice showed impaired bone growth and mineralization with resultant dramatic reduction in overall bone formation. Furthermore, older mice showed impaired osteoclastic activity, whereas isolated osteoclasts from these animals were fully capable of resorbing dentin slices (60). Those studies in combination with the results of the present work signify the multifunctional capacity of this protein, and evoke an interesting question as to what extent and precisely how the covalently-bound phosphate groups on BSP regulate in vivo bone repair or bone remodeling in general. One possibility is that during bone resorption BSP and its fragments undergo dephosphorylation and these solubilized components modulate the osteoclast attachment and activity, including inhibition of further osteoclast formation/differentiation. Ek-Rylander et al found that dBSP does not favor osteoclast attachement relative to native forms (52), whereas Razzouk et al observed no difference between native and recombinant (lacking any posttranslational modifications) BSP on osteoclast attachment (51). Also, In vitro studies using already differentiated osteoclasts seeded on “dead bone or dentine slices” pre-coated with native BSP led to enhanced pit formation, and in cell co-cultures native BSP inhibits osteoclast formation (61). Similar other studies revealed the co-localization of OPN and BSP with TRACP in resorption lacunae of osteoclasts and dephosphorylation of OPN impaired cell adhesion and migration (54). The synergistic effect of RANKL and recombinant BSP (expressed in mammalian cells, i.e. posttranslationally modified) in in vitro osteoclast differentiation and pit formation by the already differentiated osteoclasts have also been noted (62). These previous studies performed thus far use already differentiated isolated osteoclasts and evaluate cell attachment or pit formation in dead bone/dentin slices coated by proteins. It is important to note that our bone organ culture studies explore effects of BSP and its forms on PTH-induced osteoclast formation/differentiation and overall bone resorption in a microenvironment which closely mimic the in vivo circumstances. Also, in the present study we introduce the effectors into the media that are apical as opposed to basal. This has significant implications, because firstly the live bone already has basal matrix proteins including BSP, hence apical introduction of modulators has relevance to in vivo resorption phenomenon. That is, during bone resorption, degraded bone matrix proteins and BSP fragments are released into the local environment to diffuse and impact local cell activity, a process very closely mimicked in our bone cultures.
Overall, the work described herein highlights importance of a multiple specific protein structural features (RGD sequence, phosphorylation and non-RGD sequences) acting in a coupled fashion to impose specific biological function. This study opens new avenues to investigate further the possible novel mechanisms by which BSP and its forms can be used to modulate osteoclast formation/differentiation and bone resorption. It will be of particular interest to define the specific phosphopeptide/peptide regions of BSP that are involved in the regulation of osteoclast formation/differentiation and to identify the cell receptors that are utilized.
Acknowledgments
This work was supported by NIH grant RO1 AG17969 (E.S.), R21 DE 018448(E.S), and RO1 DE 05672 (F.O.).
Abbreviations used
- PTH
parathyroid hormone
- ATP
adenosine triphosphate
- CKI
casein kinase I
- OPN
osteopontin
- BSP
bone sialoprotein
- ECM
extracellular matrix
- Ca-P
calcium phosphate
- P-Ser
phosphoserine
- P-Thr
phosphothreonine
- P-Tyr
phosphotyrosine
- mCKII
microsomal casein kinase II
- RANKL
receptor activator of nuclear factor-Kβ ligand
- DMEM
Dulbecco’s Modified Eagle Medium
- TRAP
tartrate resistant acid phosphatase.
REFERENCES
- 1.Ingber DE. The riddle of morphogenesis: a question of solution chemistry or molecular cell engeneering. Cell. 1993;75:1249–1252. doi: 10.1016/0092-8674(93)90612-t. [DOI] [PubMed] [Google Scholar]
- 2.Mizuno M, Imai T, Fujisawa R, Tani H, Kuboki Y. Bone sialoprotein (BSP) is a crucial factor for the expression of osteoblastic phenotypes of bone marrow cells cultured on type I collagen matrix. Calcil. Tissue Int. 2000;66:388–396. doi: 10.1007/s002230010078. [DOI] [PubMed] [Google Scholar]
- 3.Decup F, Six N, Palmier B, Buch D, Lasfargues JJ, Salih E, Goldberg M. Bone sialoprotein-induced reparative dentinogenesis in the pulp of a rat's molar. Clin. Oral Investig. 2000;4:110–119. doi: 10.1007/s007840050126. [DOI] [PubMed] [Google Scholar]
- 4.Six N, Decup F, Lasfargues JJ, Salih E, Goldberg M. Osteogenic proteins, bone sialoprotein an bone morphogenetic protein 7 (OP-1), and pulp mineralization. J. Material Sci. (Materials in Medicine) 2002;13:225–232. doi: 10.1023/a:1013846516693. [DOI] [PubMed] [Google Scholar]
- 5.Wang J, Zhou H-Y, Salih E, Xu L, Wunderlich L, Gu X, Hofstaetter JG, Torres M, Glimcher MJ. Site-specific in vivo calcification and osteogenesis stimulated by bone sialoprotein. Calcif. Tissue Int. 2006;79:179–189. doi: 10.1007/s00223-006-0018-2. [DOI] [PubMed] [Google Scholar]
- 6.Gordon JAR, Tye CE, Sampaio AV, Underhill TM, Hunter GK, Goldberg HA. Bone sialoprotein expression enhances osteoblast differentiation and matrix mineralization in vitro. Bone. 2007;41:462–473. doi: 10.1016/j.bone.2007.04.191. [DOI] [PubMed] [Google Scholar]
- 7.Hynes RO. Integrins: versatility, modulation, and signaling in cell adhesion. Cell. 1992;69:11–25. doi: 10.1016/0092-8674(92)90115-s. [DOI] [PubMed] [Google Scholar]
- 8.Albelda SM, Buck CA. Integrins and other cell adhesion molecules. FASEB J. 1990;4:2868–2880. [PubMed] [Google Scholar]
- 9.Blobel CP, White JM. Structure, function and evolutionary relationship of proteins containing a disintegrin domain. Curr. Opin. Cell Biol. 1992;4:760–765. doi: 10.1016/0955-0674(92)90098-w. [DOI] [PubMed] [Google Scholar]
- 10.Fisher LW, Whitson SW, Avioli LV, Termine JD. Matrix sialoprotein of developing bone. J. Biol. Chem. 1983;258:12723–12727. [PubMed] [Google Scholar]
- 11.Franzen A, Heinegard D. Isolation and charachterization of two sialoproteins present only in bone calcified matrix. Biochem J. 1985;232:715–724. doi: 10.1042/bj2320715. [DOI] [PMC free article] [PubMed] [Google Scholar]
- 12.Salih E, Ashkar S, Gerstenfeld LC, Glimcher MJ. Protein kinases of cultured chicken osteoblasts: Selectivity for extracellular matrix proteins of bone and their catalytic competence for osteopontin. J. Bone Miner. Res. 1996;11:1461–1473. doi: 10.1002/jbmr.5650111013. [DOI] [PubMed] [Google Scholar]
- 13.Salih E, Zhou HY, Glimcher MJ. Phosphorylation of purified bovine bone sialoprotein and osteopontin by protein kinases. J. Biol. Chem. 1996;271:16897–16905. doi: 10.1074/jbc.271.28.16897. [DOI] [PubMed] [Google Scholar]
- 14.Salih E, Ashkar S, Gerstenfeld LC, Glimcher MJ. Identification of the metabolically phosphorylated sites of secreted 32P-labeled osteopontin from cultured chicken osteoblasts. J. Biol. Chem. 1997;272:13966–13973. doi: 10.1074/jbc.272.21.13966. [DOI] [PubMed] [Google Scholar]
- 15.Salih E, Wang J, Mah J, Fluckiger R. Natural variation in the extent of phosphorylation of bone phosphoproteins as a function of in vivo new bone formation induced by demineralized bone matrix in soft tissue and bony environments. Biochem. J. 2002;364:465–474. doi: 10.1042/BJ20011272. [DOI] [PMC free article] [PubMed] [Google Scholar]
- 16.Salih E, Fluckiger R. Complete topographical distribution of both the in vivo and in vitro phosphorylation sites of bone sialoprotein and their biological implications. J. Biol. Chem. 2004;279:19808–19815. doi: 10.1074/jbc.M310299200. [DOI] [PubMed] [Google Scholar]
- 17.Glimcher MJ, Kossiva D, Rouosse A. Identification of phosphopeptides and γ-carboxyglutamic acid-containing peptides in epiphysealgroth plate cartilage. Calcif. Tissue Int. 1979;27:1871. doi: 10.1007/BF02441183. [DOI] [PubMed] [Google Scholar]
- 18.Boskey AL, Doty SB, Kudryashov V, Mayer-Kuckuk P, Roy R, Binderman I. Modulation of extracellular matrix protein phosphorylation alters mineralization in differentiating chich limb-bud mesencymal cell micromass cultures. Bone. 2008;42:1061–1071. doi: 10.1016/j.bone.2008.01.016. [DOI] [PMC free article] [PubMed] [Google Scholar]
- 19.Gorski JP, Wang A, Lovitch D, Powell K, Midura RJ. Extracellular bone acidic glycoprotein-75 condensed mesenchyme regions to be mineralized and localized with bone sialoprotein during intramembranous bone formation. J. Biol. Chem. 2004;279:25455–25461. doi: 10.1074/jbc.M312408200. [DOI] [PubMed] [Google Scholar]
- 20.Veis A, Spector AR, Zamonscanyk H. Isolation of an EDTA-soluble phosphoprotein from mineralizing bovine dentin. Biochim. Biophys. Acta. 1972;257:404–413. doi: 10.1016/0005-2795(72)90293-0. [DOI] [PubMed] [Google Scholar]
- 21.Veis A. Phosphoproteins of dentin and bone: Do they have a role in matrix mineralization? In: Butler WT, editor. The Chemistry and Biology of Mineralized Tissues. Birmingham, Alabama: Ebsco Media, Inc.; 1985. pp. 170–176. [Google Scholar]
- 22.He G, Ramachandran A, Dahl T, George S, Schultz D, Cookson D, Veis A, George A. Phosphorylation of phosphophoryn is crucial for its function as a mediator of biomineralization. J. Biol. Chem. 2005;280:33109–33114. doi: 10.1074/jbc.M500159200. [DOI] [PubMed] [Google Scholar]
- 23.Jadlowiec JA, Zhang X, Li J, Campbell PG, Sfeir C. Extracellular matrix-mediated signaling by dentin phosphophoryn involves activation of the smad pathway independent of bone morphogenetic protein. J. Biol. Chem. 2006;281:5341–5348. doi: 10.1074/jbc.M506158200. [DOI] [PubMed] [Google Scholar]
- 24.Giachelli CM, Bae N, Almeida M, Denhard DT, Alpers CE, Schwartz SM. Osteopontin is elevated during neoitima formation in rat arteries and in novel component of human atherosclerotic plaque. J. Clin. Invest. 1993;92:1686–1696. doi: 10.1172/JCI116755. [DOI] [PMC free article] [PubMed] [Google Scholar]
- 25.Okada A, Nomura S, Sacki Y, Higashiba Y, Hamamoto S, Hirose M, Itoh Y, Yasui T, Tozawa K, Kohri K. Morphological conversion of calcium oxalate crystals into stones is regulated by osteopontin in mouse kidney. J. Bone and Miner. Res. 2008;23:1629–1637. doi: 10.1359/jbmr.080514. [DOI] [PubMed] [Google Scholar]
- 26.Kido J, Kasahara C, Ohishi K, Nishikawa S, Ishida H, Yamashita K, Kitamura S, Kohri K, Nakata T. Identification of osteopontin in human dental calculus matrix. Arch. Oral Biol. 1995;40:967–972. doi: 10.1016/0003-9969(95)00056-u. [DOI] [PubMed] [Google Scholar]
- 27.Bellahcene A, Castronovo V. Expression of bone matrix proteins in human breast cancer: potential roles in microcalcification formation and in the genesis of bone metastases. Bull Cancer. 1997;84:17–24. [PubMed] [Google Scholar]
- 28.Midura KJ, McQuilan DJ, Benhan KJ, Fisher LW, Hascall VC. A rat osteogenic cell line (UMR 106-01) synthesises a highly sulphated form of bone sialoprotein. J. Biol. Chem. 1990;265:2347–2351. [PubMed] [Google Scholar]
- 29.Wang J, Glimcher MJ, Mah J, Zhou HY, Salih E. Expression of bone microsomal casein kinase II, bone sialoprotein, and osteopontin during the repair of calvarial defects. Bone. 1998;22:621–628. doi: 10.1016/s8756-3282(98)00057-x. [DOI] [PubMed] [Google Scholar]
- 30.Endo A, Glimcher MJ. The effect of complexing phosphoproteins to decalcified collaged on in vitro calcification. Connect. Tissue Res. 1989;21:179–190. doi: 10.3109/03008208909050008. [DOI] [PubMed] [Google Scholar]
- 31.Hunter GK, Goldberg HA. Nucleation of hydroxyappatite by bone sialoprotein. Proc.Natl.Acad.Sci.U.S.A. 1993;90:8562–8565. doi: 10.1073/pnas.90.18.8562. [DOI] [PMC free article] [PubMed] [Google Scholar]
- 32.Boskey AL, Maresca M, Ullrich W, Doty SB, Butler WT, Prince CW. Osteopontin-hydroxyapitite interactions in vitro: inhibition of hydrxyapatite formation and growth in a gelatin. Bone Miner. 1993;22:147–159. doi: 10.1016/s0169-6009(08)80225-5. [DOI] [PubMed] [Google Scholar]
- 33.Stubbs JT, III, Mintz KP, Eanes ED, Torchia DA, Fisher LW. Characterization of native and recombinant bone sialoprotein: delineation of the mineral-binding and cell adhesion domains and structural analysis of the RGD domains. J. Bone Miner. Res. 1997;12:1210–1222. doi: 10.1359/jbmr.1997.12.8.1210. [DOI] [PubMed] [Google Scholar]
- 34.Buttler WT, Ridall AL, McKee MD. Osteopontin. In: Bilezikian JP, Raisz LG, Rodan GA, editors. Principles of Bone Biology. San Diego, CA: Academic Press; 1996. pp. 167–181. [Google Scholar]
- 35.Denhardt DT, Noda M. Osteopontin expression and function: role in bone remodeling. J. Cell Biochem. 1998;30–31 Suppl:92–102. doi: 10.1002/(SICI)1097-4644(1998)72:30/31+<92::AID-JCB13>3.0.CO;2-A. [DOI] [PubMed] [Google Scholar]
- 36.Chambers TJ, Fuller K, Darby JA, Pringle JA, Horton MA. Monoclonal antibodies against osteoclasts inhibit bone resorption in vitro. Bone Miner. 1986;1:127–135. [PubMed] [Google Scholar]
- 37.Davies J, Warwick J, Totty N, Philip R, Helfrich M, Horton MA. The osteoclast functional antigen, implicated in the regulation of bone resorption, is biochemically related to the vitronectin receptor. J. Cell Biol. 1989;109:1817–1826. doi: 10.1083/jcb.109.4.1817. [DOI] [PMC free article] [PubMed] [Google Scholar]
- 38.Reinholt FP, Hultenby K, Oldberg A, Heinegard D. Osteopontin- a possible anchor of osteoclasts to bone. Proc. Natl. Acad. Sci. U.S.A. 1990;87:4473–4475. doi: 10.1073/pnas.87.12.4473. [DOI] [PMC free article] [PubMed] [Google Scholar]
- 39.Ross FP, Chappel J, Alvarez JI, Sander D, Butler WT, Farach-Carson MC, Mintz KA, Robey PG, Teitelbaum SL, Cheresh DA. Interactions between the bone matrix proteins osteopontin and bone sialoprotein and the osteoclast αvβ3 integrin potentiate bone resorption. J. Biol.Chem. 1993;268:9901–9907. [PubMed] [Google Scholar]
- 40.Senger DR, Perruzzi CA. Cell migration promoted by a potent GRGDS-containing thrombin-cleavage fragment of osteopontin. Biochim. Biophys. Acta. 1996;1314:13–24. doi: 10.1016/s0167-4889(96)00067-5. [DOI] [PubMed] [Google Scholar]
- 41.O'Regal AW, Chupp GL, Lowry JA, Goetschkes M, Mulligan N, Berman JS. Osteopontin is associated with T cells in sarcoid granulomas and has T cell adhesive and cytokine-like properties in vitro. J. Immunol. 1999;162:1024–1031. [PubMed] [Google Scholar]
- 42.Fedarko NS, Fohr B, Robey PG, Young MF, Fisher LW. Factor H binding to bone sialoprotein and osteopontin enables molecular cloaking of tumor cells from complement-mediated attack. J. Biol. Chem. 2000;275:16666–16672. doi: 10.1074/jbc.M001123200. [DOI] [PubMed] [Google Scholar]
- 43.Helfrich MH, Nesbitt SA, Dorey EL, Horton MA. Rat osteoclasts adhere to a wide range of RGD (Arg-Gly-Asp) peptide containing proteins including the bone sialoproteins and fibronectin. J.Bone Miner.Res. 1992;7:335–343. doi: 10.1002/jbmr.5650070314. [DOI] [PubMed] [Google Scholar]
- 44.Horton MA, Nesbit MA, Helfrich MH. Interaction of osteopontin with osteoclast integrins. Ann. N.Y. Acad. Sci. 1995;760:190–200. doi: 10.1111/j.1749-6632.1995.tb44630.x. [DOI] [PubMed] [Google Scholar]
- 45.Bayliss KJ, Meininger GA, Scholtz JM, Davis GE. Osteopontin is a ligand for the alpha4beta1 integrin. J. Cell Sci. 1998;111:1165–1174. doi: 10.1242/jcs.111.9.1165. [DOI] [PubMed] [Google Scholar]
- 46.Yokosaki Y, Matsura N, Sasaki T, Murakami I, Schneider H, Higashiyama S, Saitoh Y, Yamakido M, Taooka Y, Sheppard D. The integrin alpha(9)beta(1) binds to a novel recognition sequence (SVVYGLR) in the thrombin-cleaved amino-terminal fragment of osteopontin. J.Biol. Chem. 1999;274:36328–36334. doi: 10.1074/jbc.274.51.36328. [DOI] [PubMed] [Google Scholar]
- 47.Harris NL, Rattray KR, Tye CE, Underhill TM, Somerman MJ, D'Errico JA, Chambers AF, Hunter GK, Goldberg HA. Functional analysis of bone sialoprotein: identification of hydroxyapatite-nucleating and cell-binding domains by recombinant peptide expression and site-directed mutagenesis. Bone. 2000;27:795–802. doi: 10.1016/s8756-3282(00)00392-6. [DOI] [PubMed] [Google Scholar]
- 48.Zhou HY, Takita H, Fujisawa R, Mizuno M, Kuboki Y. Stimulation by bone sialoprotein of calcification in osteoblast-like MC3T3-E1. Calcif.Tissue Int. 1995;56:403–407. doi: 10.1007/BF00301610. [DOI] [PubMed] [Google Scholar]
- 49.Gericke A, Qin C, Spevak L, Fujimoto Y, Butler WT, Sorensen ES, Boskey AL. Importance of phosphorylation for osteopontin regulation of mineralization. Calcif. Tissue Int. 2005;77:45–54. doi: 10.1007/s00223-004-1288-1. [DOI] [PMC free article] [PubMed] [Google Scholar]
- 50.Oldberg A, Jirskog-Hed B, Axelsson S, Heinegard D. Regulation of bone sialoprotein mRNA by steroid hormones. J. Cell Biol. 1989;109:3183–3186. doi: 10.1083/jcb.109.6.3183. [DOI] [PMC free article] [PubMed] [Google Scholar]
- 51.Razzouk S, Brunn JC, Qin C, Tye CE, Goldberg HA, Butler WT. Osteopontin posttranslational modification, possibly phosphorylation, are required for in vitro bone resorption but not osteoclast adhesion. Bone. 2002;30:40–47. doi: 10.1016/s8756-3282(01)00637-8. [DOI] [PubMed] [Google Scholar]
- 52.Ek-Rylander B, Flores M, Wendel M, Heinegard D, Andersson G. Dephosphorylation of osteopontin and bone sialoprotein by osteoclast tartrate-resistant acid phosphatase: modulation of osteoclast adhesion in vitro. J.Biol.Chem. 1994;269:14853–14856. [PubMed] [Google Scholar]
- 53.Katayama Y, House CM, Udagawa N, Kazama JJ, McFarland RJ, Martin TJ, Findlay DM. Casein kinase 2 phosphorylation of recombinant rat osteopontin enhances adhesion of osteoclasts but not osteoblasts. J. Cell Physiol. 1998;176:179–187. doi: 10.1002/(SICI)1097-4652(199807)176:1<179::AID-JCP19>3.0.CO;2-2. [DOI] [PubMed] [Google Scholar]
- 54.Andersson G, Ek-Rylander B, Hollberg K, Ljusberg-Sjolander J, Lang P, Norgard M, Wang Y, Zhang SJ. TRACP as an osteopontin phosphatase. J. Bone Miner. Res. 2003;18:1912–1915. doi: 10.1359/jbmr.2003.18.10.1912. [DOI] [PubMed] [Google Scholar]
- 55.McHugh KP, Kitazawa S, Teitelbaum SL, Ross FP. Cloning and characterization of the murine beta(3) integrin gene promoter: identification of an interleukin element and regulation by STAT-6. J. Cell Biochem. 2001;81:320–332. doi: 10.1002/1097-4644(20010501)81:2<320::aid-jcb1047>3.0.co;2-m. [DOI] [PubMed] [Google Scholar]
- 56.Goldhaber P, Rabadjija L. H+-stimulation of cell mediated bone resorption in tissue culture. Am. J. Physiol. (Endocrinol.Metab.) 1987;16:E90–E98. doi: 10.1152/ajpendo.1987.253.1.E90. [DOI] [PubMed] [Google Scholar]
- 57.Rabadjija L, Brown EM, Swartz SL, Chen CJ, Goldhaber P. H+-stimulated release of prostoglandin E2 and cyclic adenosine 3', 5'-monophosphoric acid and their relationship to bone resorption in neonatal mouse calvaria cultures. Bone Miner. 1990;11:295–304. doi: 10.1016/0169-6009(90)90026-c. [DOI] [PubMed] [Google Scholar]
- 58.Lowry OH, Rosebrough NJ, Farr AL, Randall RJ. Protein measurement with folin phenol reagent. J. Biol. Chem. 1951;193:265–275. [PubMed] [Google Scholar]
- 59.Cooper LF, Yliheikkila PK, Felton DA, Whitson SW. Spatiotemporal assessment of fetal bovine osteoblast culture differentiation indicates a role for BSP in promoting differentiation. J.Bone Miner.Res. 1998;13:620–632. doi: 10.1359/jbmr.1998.13.4.620. [DOI] [PubMed] [Google Scholar]
- 60.Malaval L, Wade-Gueye NM, Boudiffa M, Fei J, Zirngibl R, Chen F, Laroche N, Roux J-P, Burt-Pichat B, Duboeuf F, Boivin G, Jurdic P, Lafage-Proust M-H, Amedee J, Vico L, Rossant J, Aubin JE. Bone sialoprotein plays a functional role in bone formation and osteoclastogenesis. J. Exp. Med. 2008;205:1145–1153. doi: 10.1084/jem.20071294. [DOI] [PMC free article] [PubMed] [Google Scholar]
- 61.Raynal C, Delmas PD, Chenu C. Bone sialoprotein stimulates in vitro bone resorption. Endocrinology. 1996;137:2347–2354. doi: 10.1210/endo.137.6.8641185. [DOI] [PubMed] [Google Scholar]
- 62.Valverde P, Tu Q, Chen J. BSP and RANKL induce osteoclastogenesis and bone resorption synergistically. J. Bone Miner. Res. 2005;20:1669–1679. doi: 10.1359/JBMR.050511. [DOI] [PubMed] [Google Scholar]


