

Abstract
Background
Myocardial scarring from infarction (MI) or nonischemic fibrosis forms an arrhythmogenic substrate. The Selvester QRS-score has been extensively validated for estimating MI scar size in the absence of ECG confounders, but has not been tested to quantify scar in patients with hypertrophy, bundle branch/fascicular blocks or nonischemic cardiomyopathy. We assessed the hypotheses that (1) QRS-scores (modified for each ECG confounder) correctly identify and quantify scar in ischemic and nonischemic patients as compared to the reference standard of Cardiac Magnetic Resonance-Late Gadolinium Enhancement (CMR-LGE) and (2) QRS-estimated scar size predicts inducible sustained monomorphic ventricular tachycardia (MVT) during electrophysiologic (EP) testing.
Methods and Results
162 patients with left ventricular ejection fraction ≤35% (95 ischemic, 67 nonischemic) received 12-lead ECG and CMR-LGE before defibrillator (ICD) implantation for primary prevention of sudden cardiac death. QRS-scores correctly diagnosed CMR-scar presence with receiver operating characteristics area under the curve (AUC)=0.91 and correlation for scar quantification of r=0.74, p<0.0001, for all patients. Performance within hypertrophy, conduction defect and nonischemic subgroups ranged from AUC 0.81-0.94, r=0.60-0.80, p<0.001 for all. Among the 137 patients undergoing EP or device testing, each 3 point QRS-score increase (9% LV scarring) was associated with an odds ratio for inducing MVT of 2.2 [95% CI: 1.5-3.2, p<0.001] for all patients, 1.7 [1.0-2.7, p=0.04] for ischemics and 2.2 [1.0-5.0, p=0.05] for nonischemics.
Conclusions
QRS-scores identify and quantify scar in ischemic and nonischemic cardiomyopathy patients despite ECG confounders. Higher QRS-estimated scar size is associated with increased arrhythmogenesis and warrants further study as a risk-stratifying tool.
Keywords: electrocardiography, imaging, infarction, arrhythmia
Background
Several randomized trials have shown reduced mortality in patients with left ventricular (LV) systolic dysfunction who receive an implantable cardioverter-defibrillator (ICD) for the primary prevention of sudden cardiac death.1, 2 However, fewer than 25% of such patients receive appropriate ICD firings and not all appropriate shocks are life saving.2 Improved risk-stratification algorithms in these patients may reduce the number of unnecessary device implantations. Multiple electrocardiographic-based risk-stratification tests have been investigated – including signal averaged electrocardiogram (ECG), heart rate variability, microvolt T-wave alternans and QT variability – but none has shown sufficient predictive value for widespread clinical use.3
Myocardial scarring following myocardial infarction (MI) may create regions of slowed conduction and reentrant circuits supporting sustained monomorphic ventricular tachycardia (MVT).4 Cardiovascular magnetic resonance using late gadolinium enhancement (CMR-LGE) can accurately identify and quantify myocardial necrosis at all stages of infarct healing.5, 6 In addition, by characterizing and quantifying the infarct region by CMR-LGE, it is possible to identify substrates for reentry as defined by inducibility of sustained MVT during electrophysiological testing7, 8 and post-MI mortality.9 Recently, myocardial scarring/fibrosis has also been demonstrated by CMR-LGE in nonischemic LV dysfunction,10, 11 and was associated with inducibility of ventricular arrhythmias by programmed stimulation12 and increased mortality.13, 14
While CMR-LGE prior to ICD placement has not been widely implemented in clinical practice, 12-lead ECGs are routinely performed, relatively inexpensive, and may be useful in the assessment and quantification of scar in patients with LV dysfunction. Beginning in the 1960s, Selvester and colleagues developed a computer simulation of the electrical activation of the heart and studied the effect of scar, hypertrophy and conduction defects on the body surface vectorcardiogram (VCG) and ECG.15, 16 They showed that myocardial scar in all parts of the LV produced characteristic and quantifiable changes in the VCG and ECG and developed scores that considered Q- and R-wave durations, R/Q and R/S amplitude ratios, R- and S-wave amplitudes and R-wave notches.17, 18 Each QRS-point represented infarct involving the equivalent of 3% of the LV and hence higher scores indicated larger infarct sizes. In the absence of ECG “confounders” (i.e. hypertrophy or conduction defects), the QRS-scores correlated strongly with postmortem anatomic scar size,19 LV ejection fraction (LVEF)20 and cardiac mortality.21, 22 The reader is referred to a recent review which summarizes the complete development, validation and clinical utility of the QRS scoring of MIs.23
Although modified QRS-scores to quantify scar in the presence of ventricular hypertrophy, fascicular blocks and bundle branch blocks were developed, they were never systematically validated.23 In addition, QRS scoring has not been tested in patients with nonischemic cardiomyopathy. Thus, this study was performed to test the hypotheses that (1) QRS-scores, adapted for each confounder, can identify and quantify scar in all patients with ischemic or nonischemic LV dysfunction referred for ICD implantation, and (2) higher QRS-scores are associated with inducibility of ventricular arrhythmia during electrophysiological (EP) evaluation.
Methods
Patients
Patients referred for ICD placement for primary prevention of sudden cardiac death were prospectively enrolled between November, 2003 and November, 2007 as part of a single-center prospective cohort study.8, 14 Patients were screened from the clinical ICD implantation schedule at our institution. All patients had to have (1) LVEF ≤35% measured by a clinically indicated non-CMR study (echocardiography or nuclear), (2) coronary angiography, (3) no other indications for ICD placement (e.g. syncope, sustained ventricular arrhythmias or cardiac arrest), and (4) no contraindications to CMR (e.g. existing cardiac device). Patients were classified as “ischemic” if they had a known history of coronary artery disease and prior MI >1 month prior to enrollment.8 Patients were classified as “nonischemic” if they had no history of MI or revascularization and no evidence of coronary artery stenoses >50% of 2 or more epicardial vessels or left main or proximal left anterior descending coronary artery stenosis >50%.14 Exclusions were based on those of the Multicenter Automatic Defibrillator Implantation Trial II.1 Renal insufficiency with creatinine clearance <30 ml/min was added as an exclusion for CMR gadolinium contrast in July, 2006. The study protocol was approved by the Johns Hopkins Hospital Institutional Review Board. All patients gave written informed consent.
ECG Acquisition and Analysis
Clinically indicated 12-lead ECGs prior to ICD implantation were acquired using a GE-Marquette system. ECG median beats were analyzed by two investigators using calipers and 2× magnification. At the time of analysis, investigators were blinded to all patient data (including cardiomyopathy etiology, CMR imaging results and electrophysiologic evaluation) except age, gender and race. ECGs were first analyzed for the presence of conduction defects and hypertrophy, according to the following pre-specified definitions:23, 24
Left Bundle Branch Block (LBBB) – QRS duration ≥140 ms (men) or 130 ms (women), QS or rS in V1 and V2 with mid QRS slowing;
Left Superior (Anterior) Fascicular Block (LAFB) – QRS duration ≥100 ms (with no upper limit for duration), left axis deviation ≥45° with separation of initial and terminal forces in the frontal plane (rS morphology in aVF and/or qR in aVL);
Right Bundle Branch Block (RBBB) – QRS duration ≥120 ms with rR′ in V1 (this may appear as “ qR′ ” in patients with large anterior infarcts due to a loss of the initial r-wave) and a wide S wave in lead I;
LAFB+RBBB – meeting both RBBB and LAFB criteria;
Left Ventricular Hypertrophy (LVH) – increased voltage according to Sokolow-Lyon or Cornell criteria and not meeting other classifications; and
No Confounders – not meeting any previous criteria (note that this could include patients with prolonged QRS duration).
Left inferior (posterior) fascicular block (LPFB) does not affect the scoring system and if signs of right ventricular hypertrophy (RVH) are present then certain points in V1 and V2 cannot be counted (see Appendix).23, 24 See the recent review for detailed explanations of the minor differences between these and the World Health Organization criteria.23
QRS-score criteria were then applied for the specific underlying conduction type present (see Appendix for complete scores and instructions). There are 32 possible total points and each point represents 3% of the LV mass. QRS scores for RBBB, LAFB, LAFB+RBBB and LVH have relatively minor differences from the no confounder QRS-score, however the LBBB score is fundamentally different because the electrical activation wavefront has to proceed through the ventricular septum before activating the LV (Figure 1).
Figure 1.
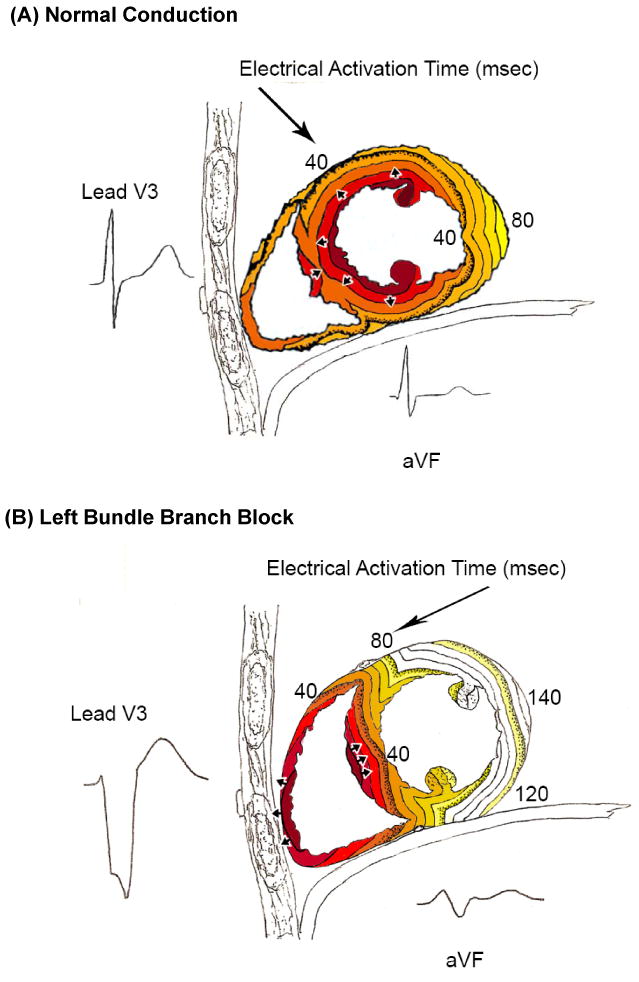
Timing of electrical activation (depolarization) wavefronts in normal conduction (A) and LBBB (B), shown in sagittal view. For reference, two QRS-T waveforms are shown in their anatomic locations (V3 on the chest and aVF inferiorly). Electrical activation starts at the small arrows and spreads in a wavefront with each colored line representing successive 10 ms. In normal conduton, activation begins within both the LV and RV endocardium. In LBBB, activation only begins in the RV and must proceed through the septum before reaching the LV endocardium (i.e. this pattern in the septum is opposite to that seen in normal conduction). By taking into account the stereotypical LBBB activation, QRS-score criteria for scar can be in fact developed in LBBB, similar to that in normal conduction. Note that while scar in the septum causes Q-waves in V1-V3 when normal conduction is present, the same scar causes large R-waves in V1-V3 in the presence of LBBB because of unopposed electrical forces in the RV free wall (see Figure 2A).
For localization of scar by QRS-scoring, because the ECG is registered anatomically relative to the thorax, the LV walls, papillary muscles and fascicles are labeled accordingly (see Appendix). We subdivided the ECG scar locations into anteroseptal and/or anterior-superior versus inferior and/or posterolateral for comparison with the CMR-LGE locations.
By a trained observer, the QRS-scores take less than 5 minutes to complete per patient.
CMR Acquisition and Analysis
The CMR protocol has been previously reported.8, 14 In summary, patients underwent cine and CMR-LGE imaging using a 1.5-Tesla scanner (Signa CV/i, GE Healthcare Technologies, Waukesha, WI or Siemens Avanto, Erlangen, Germany). Image analysis was performed with CINEtool (GE Healthcare Technologies) by two observers blinded to all other patient data. Cine images were used to measure LVEF and volumes and LGE images were used to measure total scar size for the entire LV. For the ischemic patients, after LGE endocardial and epicardial LV borders were outlined in short axis slices, the LGE area was outlined and pixels with signal intensity (SI) >50% of the maximal SI within the LGE area were labeled as scar “core.”8 A region of normal myocardium without artifacts was then selected and the peak SI within the normal myocardium was determined. Myocardium with SI >peak remote SI but <50% of maximal SI within the LGE region was labeled “gray” zone to represent the heterogeneous peri-scar zone.8 For the nonischemic patients, two observers determined the dichotomous presence or absence of LGE by reviewing all short and long axis contrast-enhanced images; regions of elevated signal intensity had to be confirmed in 2 spatial orientations.8 The amount of LGE was then quantified in the same manner as for the ischemic patients. LGE was expressed as % of total LV mass.
Electrophysiological Evaluation
The electrophysiological protocol used in this study was previously reported.8 In summary, patients were evaluated for the inducibility of sustained MVT or any ventricular tachycardia/fibrillation (VT/VF) that lasted >30 seconds or required cardioversion for hemodynamic compromise. Patients received 3 extrastimuli at 2 different drive cycle lengths delivered from the right ventricular apex (through the ICD at time of implantation) or the right ventricular apex and outflow tract during a full electrophysiology study.
Statistical Analysis
Continuous variables are expressed as mean ± standard deviation. Wilcoxon rank-sum and Fisher's exact test were used to compare characteristics within the ischemic and nonischemic cohorts stratified by QRS-scores. Ischemic patients were divided above and below the median QRS-score (8 points = 24% LV with scar) and nonischemic patients were divided by the presence or absence of QRS points.
Spearman correlation, Bland-Altman plots and Pitman's Test of difference in variance were used to assess the relation between the original simulation-developed QRS-estimated scar size and CMR-LGE scar measurements.25, 26 Note that Bland-Altman plots graph the difference versus the average of the two estimates of scar size and Pitman's test assesses for a linear correlation between the difference and average. By the Pitman's test, the lack of a correlation suggests that there is no significant difference in variance between patients with small versus large scar sizes. Nonparametric receiver operating characteristic (ROC) curves were used to assess the ability of the QRS-score to diagnose the presence of CMR-LGE scar and scatterplots were used to show the association between QRS-score and CMR-LGE scar size. Logistic regression was used to calculate the odds ratios for inducing sustained MVT per incremental increase in QRS-estimated scar size. Fisher's exact test was used to assess the difference in inducibility between high and low QRS-score groups. Kappa analysis (κ) was used to assess intra- and inter-observer variability of QRS scoring in a subset of 30 randomly selected patients. P-values <0.05 were considered statistically significant. Since there were multiple tests and multiple comparisons, a p <0.05 should be interpreted with caution.
The authors had full access to and take full responsibility for the integrity of the data. All authors have read and agree to the manuscript as written.
Results
Study Patients
We enrolled 162 consecutive patients – 95 (85% men) in the ischemic (prior MI) cohort and 67 (66% men) in the nonischemic cohort. All 95 ischemic patients (100%) had CMR-LGE and 94 of 95 (99%) had at least 1 QRS-point consistent with evidence of prior MI. Median QRS-estimated scar size was 24% LV (equivalent to 8 QRS points). Compared to patients with QRS-estimated scar ≥ median, those < median had similar baseline characteristics except for a difference in the distribution of ECG conduction abnormalities (Table 1). In the nonischemic cohort, 30 of 67 patients (45%) had CMR-LGE and 46 of 67 (69%) had ≥1 QRS point. Compared to those with no QRS-estimated scar, nonischemic patients with ≥1 QRS point had similar baseline characteristics except for larger LV volumes (Table 1).
Table 1.
Baseline characteristics (note that each QRS point corresponds to a scar size of 3% of the LV)
| ISCHEMIC (prior MI) (N=95) | NONISCHEMIC (N=67) | |||||
|---|---|---|---|---|---|---|
| Variable | QRS Points <8 (“Low”) (n=41) |
QRS Points ≥8 (“High”) (n=54) |
p-value | QRS Points <1 (“Low”) (n=21) |
QRS Points ≥1 (“High”) (n= 46) |
p-value |
| Age, y | 64±11 | 60±11 | 0.09 | 58±12 | 54±11 | 0.30 |
| Male, n (%) | 33 (80%) | 48 (89%) | 0.38 | 12 (57%) | 32 (70%) | 0.41 |
| Caucasian, n (%) | 34 (83%) | 44 (81%) | 1.00 | 11 (52%) | 28 (61%) | 0.47 |
| Heart Failure Class | ||||||
| Class I | 8 (18%) | 21 (39%) | 0.13 | 6 (29%) | 4 (9%) | 0.12 |
| Class II | 16 (39%) | 16 (30%) | 9 (43%) | 24 (52%) | ||
| Class III | 17 (41%) | 17 (31%) | 6 (29%) | 18 (39%) | ||
| Entry LVEF (%) | 24±8 | 26±6 | 0.35 | 23±10 | 20±7 | 0.25 |
| Received biventricular pacemaker | 6 (15%) | 12 (22%) | 0.43 | 7 (33%) | 17 (37%) | 0.50 |
| ECG Conduction, n (%) | ||||||
| No Confounders | 21 (51%) | 25 (46%) | 0.006 | 5 (24%) | 14 (30%) | 0.75 |
| LVH | 12 (29%) | 3 (6%) | 10 (48%) | 13 (28%) | ||
| LBBB | 4 (10%) | 7 (13%) | 6 (29%) | 15 (33%) | ||
| LAFB | 1 (2%) | 7 (13%) | 0 (0%) | 2 (4%) | ||
| RBBB | 2 (5%) | 4 (7%) | 0 (0%) | 1 (2%) | ||
| LAFB+RBBB | 1 (2%) | 8 (15%) | 0 (0%) | 1 (2%) | ||
| QRS duration (ms) | 115±24 | 124±29 | 0.13 | 114±23 | 127±32 | 0.10 |
| Cardiovascular Magnetic Resonance Analysis | ||||||
| LVEDV, ml | 226±72 | 248±65 | 0.15 | 210±52 | 295±126 | 0.01 |
| LVESV, ml | 163±63 | 183±56 | 0.11 | 158±47 | 233±121 | 0.04 |
| CMR LVEF (%) | 28±8 | 27±8 | 0.42 | 24±10 | 24±10 | 0.53 |
| LV mass, g | 180±48 | 176±50 | 0.74 | 147±38 | 178±75 | 0.12 |
| Scar Analysis (% LV) | ||||||
| QRS-estimated scar | 14±6 | 29±5 | - | 0 | 13±8 | - |
| CMR-LGE | 17±8 | 26±11 | - | 0.3±0.9 | 6±9 | - |
Reproducibility of QRS-scoring
The intra- and inter-observer agreements for exactly matched QRS scores were 60% (κ=0.56) and 63% (κ=0.60), respectively. However, the absolute values of the intra- and inter-observer differences were only 0.4 and 0.6 QRS points (equivalent to 1.2% and 1.8% of the total LV), respectively. When using a cutoff of within 1 QRS point for agreement, the intra- and inter-observer agreement improved to κ=0.96 and κ=0.86, respectively; and with a cutoff of within 2 QRS points, the agreement was κ=1.00 and κ=0.96, respectively. These results are similar to those previously reported for QRS scoring.17, 23
QRS Scores to Identify CMR Late-Gadolinium Enhancement
Figure 2 shows QRS scoring and CMR analysis for two patient examples with LBBB – patient A has a nonischemic cardiomyopathy with midwall septal scar and patient B has an ischemic cardiomyopathy with inferior and posterolateral scar. Table 2 shows the agreement between ECG and CMR-LGE identification of scar location in the ischemic group. In the presence of a single-territory infarct, the QRS-scores identified anterosuperior or anteroseptal CMR-LGE in 53/54 patients (98%) and inferior or posterolateral CMR-LGE in 23/26 patients (88%). In the presence of two distinct CMR-LGE regions, QRS-scores identified both locations in 9/15 patients (60%) and in the remainder, the larger of the 2 infarcts (generally anterior) was detected and the smaller one was not.
Figure 2.

ECGs with QRS scoring and short-axis CMR images from two patients with LBBB. For the CMR images, the core regions are shown in red and the gray zone in yellow (note that the corresponding 4 chamber long axis view is also shown with the arrow denoting the septal mid-wall LGE). For comparison with the QRS-score, total CMR scar was defined as core+1/2gray (see text). The complete LBBB QRS-score is shown in the Appendix. Patient A has a nonischemic cardiomyopathy with midwall anteroseptal scar comprising 7% of the LV by CMR-LGE and received 5 QRS points (ECG-estimated scar=15%). Note the large R-waves in V1-V2 that reflect anteroseptal scar. Patient B has an ischemic cardiomyopathy with inferior and posterolateral scar comprising 23% of the LV by CMR-LGE and received 8 QRS points (ECG-estimated scar=24%). Note the large S/S′ ratio in V1-V2 which reflects posterolateral scar.
Table 2.
Agreement between QRS and CMR-LGE Scar Location
| ISCHEMIC COHORT - CMR-LGE SCAR LOCATION | |||
|---|---|---|---|
| ECG FINDINGS | Anteroseptal-Anterosuperior only | Inferior-Posterolateral only | Both Locations |
| No Confounders | 23/23 (100%) | 14/15 (93%) | 5/8 (63%) |
| LVH | 8/8 (100%) | 4/5 (80%) | 1/2 (50%) |
| LBBB | 4/5 (80%) | 3/3 (100%) | 2/3 (67%) |
| LAFB | 7/7 (100%) | - | 0/1 (0%) |
| RBBB | 4/4 (100%) | 1/1 (100%) | 1/1 (100%) |
| LAFB+RBBB | 7/7 (100%) | 1/2 (50%) | - |
| TOTAL | 53/54 (98%) | 23/26 (88%) | 9/15 (60%) |
In the nonischemic patients, QRS-scores correctly identified the absence of CMR-LGE in 19/37 patients (51%). Because regions of CMR-LGE often crossed multiple coronary territories, exact localization was difficult to assess. In those patients with predominantly anterosuperior or anteroseptal CMR-LGE, QRS-scores correctly identified the CMR-LGE in 10/10 patients (100%). In predominantly inferior or posterolateral CMR-LGE, QRS-score correctly identified 6/9 patients (67%). Eleven nonischemic patients had evidence of scar at the inferior and/or superior right ventricle (RV) insertion sites (5 superior + inferior, 1 superior only and 5 inferior only). Of the 6 patients with superior RV insertion scar, all had QRS points in 2 of the 3 leads I, aVL or V4, which correlate with the anterosuperior wall where the RV inserts. Patients with inferior RV insertion scar had QRS-estimated septal or apical scar.
Figure 3 contains ROC curves showing the ability of QRS-scores to diagnose the presence of CMR-LGE scar. For all patients grouped together, the area under the curve (AUC) was 0.91 [95% Confidence Interval 0.86-0.95] with sensitivity, specificity and accuracy of 98%, 51% and 87% respectively at a cutoff of ≥1 QRS point (3% LV), and of 75%, 95% and 80% at a cutoff of ≥5 points (15% LV). When considering only the nonischemic patients, the AUC was 0.81 [95% CI 0.70-0.91]. ROC curves are also shown for no confounders, confounders only, LVH and LBBB, amongst which the diagnostic performance of the QRS-score was similar and highest accuracy was achieved at 3 to 5 QRS points. Only one patient with LAFB and/or RBBB had no CMR-LGE and thus ROC curves could not be calculated for these subsets.
Figure 3.

ROC curves of QRS-scores to diagnose the presence of CMR-LGE scar for (A) all patients, (B) nonischemics, (C) no confounders, (D) only confounders, (E) LVH and (F) LBBB. QRS point cutoffs and areas under the curves (AUC) are shown.
Comparison of QRS-estimated Scar to CMR-LGE
QRS-estimated scar was compared with 3 measures of CMR-LGE: core; core+gray; and core+1/2 gray, using Bland-Altman and Pitman's test of difference of variance. The QRS-scores for quantifying scar in all patients had equivalent Spearman correlations with all three CMR-LGE scar quantification methods. However, Bland-Altman plots showed that QRS-score overestimated CMR-LGE core by 7.3% and core+½ gray by 3.3%, but underestimated core+gray by -0.7%. The overall difference between QRS-score and CMR-LGE was smallest for core+gray, but there was systematic underestimation of larger CMR-LGE scar (Pittman's test: r=-0.37, p<0.001). This was not seen with CMR-LGE core+½ gray (Pittman's test: r=-0.09, p=0.24); thus it was selected as the optimal standard for comparison to QRS-score for all subsequent analyses.
For assessing the correlation between QRS scores and CMR-LGE in quantifying scar, the ischemic and nonischemic patients were grouped together to achieve a more complete dynamic range of scar size. Figure 4 shows scatterplots and Bland-Altman plots comparing ECG-estimated to CMR-estimated scar size in subsets of no cofounders, LVH, LAFB and/or RBBB, and LBBB. The Spearman correlations for these subsets ranged from r=0.66 to r=0.80, p<0.001 for all. The Bland-Altman plots showed small mean differences between ECG- and CMR-estimated scar (0.9-2.6 % LV scar) for no confounders, LVH, and LAFB and/or RBBB (Figure 4A-C). The mean difference for LBBB was larger (7.6% LV scar), although this subgroup had the strongest Spearman correlation (r=0.80) (Figure 4D).
Figure 4.

Scatterplots and Bland-Altman plots of ECG-estimated vs. CMR-estimated scar quantification for (A) no confounders, (B) LVH, (C) LAFB and/or RBBB, and (D) LBBB. Regression equations and Spearman correlation coefficients are shown.
QRS Scar and Arrhythmogenesis
Electrophysiological or device testing was performed in 137 patients prior to ICD placement and 37/82 (45%) of ischemics and 7/55 (13%) of nonischemics had inducible MVT. For each 3 QRS point increase (9% LV scarring), the odds ratio for inducing MVT was 2.2 (p<0.001) for all patients, 1.7 (p=0.04) for ischemics and 2.2 (p=0.05) for nonischemics (Table 3). In a multivariate logistic regression with all patients controlling for LVEF and ischemic vs. nonischemic etiology, the QRS-score (p=0.006) was the only statistically significant variable for predicting MVT.
Table 3.
Odds Ratios for Inducing Sustained Monomorphic Ventricular Tachycardia at Electrophysiological or Device Testing per 3 QRS Point (9% LV Scar) Increase
| Odds Ratio | 95% Confidence Interval | P-Value | |
|---|---|---|---|
| All Patients | 2.2 | 1.5-3.2 | p<0.001 |
| Ischemics | 1.7 | 1.0-2.7 | p=0.04 |
| Nonischemics | 2.2 | 1.0-5.0 | p=0.05 |
Using the same low versus high QRS-score subdivisions as shown in Table 1, patients in the high QRS-score groups had increased rates of inducibility for MVT compared to the low QRS-score groups: in the ischemic group [55% (27/49) vs. 30% (10/33), p=0.04] and in the nonischemic group [18% (7/39) vs. 0% (0/16), p=0.09]. ROC analysis showed that the median QRS-score cutoff used for stratifying the ischemic group had the highest accuracy for predicting MVT. While the relation between QRS-score and inducible MVT was not statistically significant in the nonischemics, it is notable that no patients with a QRS-score of 0 had MVT.
Discussion
The present study demonstrates that QRS-scores accurately identify the presence and correlate well with the extent of myocardial scar in ischemic and nonischemic cardiomyopathy patients with all types of ventricular conduction. In addition, increasing QRS-estimated scar is associated with higher rates of inducible monomorphic ventricular tachycardia during electrophysiologic or device testing. QRS-scoring is an inexpensive, readily available, and easily implemented method, validated previously in identifying myocardial infarction in patients without ECG confounders.23 These results suggest that QRS-scoring may be able to detect an arrhythmogenic substrate in patients with both ischemic and nonischemic LV dysfunction.
Overall, for all patients and conduction types, the sensitivity, specificity and accuracy for detection of scar by QRS-scoring were 98%, 51% and 87% at a cutoff of 1 QRS point and 75%, 95% and 80% at a cutoff of 5 points. Previous studies evaluated the diagnostic performance of the QRS-score in the absence of confounders for quantifying predominantly acute nonreperfused MI, in comparison to necropsy.23 A strong correlation was found for all MI locations in patients with single infarcts (r=0.72-0.80). Recent studies with small numbers of patients (<30 each) compared the no confounder QRS-score to CMR-LGE scar and found a strong correlation in patients at one week after first-time reperfused MI (r=0.79, p<0.001),27 but only a modest correlation in patients with chronic infarcts (r=0.40, p<0.05).28 In our study of patients with LV dysfunction of ischemic or nonischemic etiology, we found high correlations between ECG and CMR which were similar in magnitude to those reported in the necropsy studies. In quantifying scar extent, the QRS-score had the highest level of agreement with CMR-LGE core+gray (bias of -0.7%). However, at higher scar sizes, the QRS-score systematically underestimated CMR-LGE core+gray and thus, the best correlation between the 2 methods over the entire range of scar sizes occurred using core+1/2 gray CMR-LGE. Notably, in the initial necropsy comparisons, total infarct size was in fact measured by including and multiplying the volume of heterogeneous peri-infarct tissue by a fraction, similar to our use of multiplying the “gray” (heterogeneous) zone by ½.29 Similar to prior studies comparing ECG to CMR scar quantification, the absolute quantification of scar was different between the 2 methods,28 as is also the case with CMR comparisons to nuclear techniques.30 Nonetheless, the high correlation between ECG and CMR in the current study supports potential diagnostic utility.
QRS Scoring in the Presence of Conduction Abnormalities
As opposed to traditional ECG diagnostic assessment, our study shows that the ECG can be used to quantify scar even in the presence of fascicular blocks, bundle branch blocks and hypertrophy.24, 31 This is consistent with the systematic computer simulations of these pathologies by Selvester and associates, which suggested that once the correct underlying activation sequence is taken into account, the ECG can in fact detect and quantify infarction.24 QRS-scoring in the presence of confounders extends the utility of the ECG to a wider spectrum of patients since confounding factors were present in 40% of our patient population referred for ICD placement.
Application to Patients with Nonischemic Cardiomyopathy
No previous study has tested QRS scoring in nonischemic cardiomyopathy patients. However, the presence of scar in these patients has been increasingly recognized and quantified by CMR.12-14 In the present study, during ECG analysis, we blinded ourselves to the ischemic versus nonischemic etiology and found comparable diagnostic performance in both groups. When only considering the nonischemic cohort, QRS scoring generally has good agreement with the extent of CMR-LGE scar (r=0.60, p<0.0001) and in assessing the presence or absence of scar [ROC-AUC=0.81, 95% CI 0.70-0.91], including the small scar seen at the RV and LV insertion points. However, there were some discrepancies between two techniques. This disagreement may be due to a combination of both false positive QRS points and false negative CMR detection of scar. Diffuse myocardial interstitial changes or other pathophysiological mechanisms (e.g. electrical-mechanical dissociation) that are not detected by CMR may alter electrical depolarization and provide an arrhythmic substrate. This requires further study.
QRS-Estimated Scar Size and Arrhythmogenic Substrate
In this study, we have shown that QRS scoring to estimate LV scar size can be used to identify patients with arrhythmogenic substrate as defined by inducibility of sustained MVT (odds ratio for inducing MVT of 2.2 for every 3 QRS-point increase). This is consistent with prior studies that used CMR quantification of myocardial scar to predict inducibility of MVT in ischemic7, 8 and nonischemic patients.12 While QRS-scoring cannot characterize myocardial scar as accurately as CMR-LGE, the ECG-based approach is advantageous in that it is inexpensive, universally available and simple to perform. Further study will be required to determine if QRS-scoring not only identifies arrhythmogenic substrate, but also can predict the occurrence of ventricular arrhythmias and increased mortality in patients currently being referred for ICD therapy. Prior studies have shown that the no confounder QRS-score does have strong prognostic value in coronary artery disease patients.21, 22
Limitations
There are inherent limitations with the relatively small number of patients, especially after subdivision by the different conduction types and ischemic versus nonischemic etiology. Of note, only 10 patients with LAFB, 7 patients with RBBB and 10 patients with RBBB+LAFB were studied. Furthermore, there were significantly more patients with anterosuperior-anteroseptal scar than inferior-posterolateral scar. Larger numbers of patients will be required to assess the sensitivity and specificity of each of the QRS criteria in the presence of conduction abnormalities to localize and quantify LV scar. While the semi-automated CMR-LGE technique is highly reproducible,8, 14 it is unknown how well it detects and quantifies diffuse microscopic non-focal scar that may affect the QRS complex. Furthermore, pro-arrhythmic electrophysiological changes may affect the QRS complex, but these conditions may not be detected by CMR-LGE. ECGs were also clinically acquired at the time of CMR/ICD implantation and since the tracings were not systematically obtained by the same individual, electrode lead misplacement may certainly affect the QRS configuration and QRS scoring.
The use of inducibility for MVT is a limitation because the value of such an endpoint in predicting clinical prognosis is controversial and unreliable, particularly in nonischemic cardiomyopathy. Future investigation is required to examine the ability of QRS scoring to predict outcomes such as mortality or ICD firings in a larger cohort of patients. Finally, QRS scoring is unlikely to be used in clinical practice unless automated versions become available for widespread use.
Conclusions
In conclusion, our study demonstrates that QRS-scores can identify and quantify CMR-LGE scar in ischemic and nonischemic cardiomyopathy patients even in the presence of traditional ECG “confounders.” In addition to being inexpensive and readily available, the ECG is advantageous in that completely automated scoring systems can also be implemented.32 This may facilitate wider application to the identification of patients with potentially arrhythmogenic myocardial substrate, including those with less severe LV dysfunction, regardless of etiology. Future research is needed to investigate the prognostic potential of QRS-scoring in predicting adverse arrhythmic outcomes in patients with chronic LV dysfunction.
Acknowledgments
We thank Dr. Myron L. Weisfeldt for his valuable input. We thank research coordinators Larissa Bell, BSN, Angela Steinberg, BSN, and Barbara Butcher, CCRN and CMR technologist, Terry Frank. Dr. Tomaselli is the Michel Mirowski, M.D. Professor of Cardiology.
Funding Sources: This work was supported by the Donald W. Reynolds Cardiovascular Research Center at Johns Hopkins University, the National Heart, Lung, and Blood Institute, NIH (K23 HL04444 to KCW) and the Sarnoff Cardiovascular Research Foundation (DGS).
Abbreviations
- AUC
area under the curve
- CI
confidence interval
- CMR
cardiovascular magnetic resonance
- ECG
electrocardiogram/electrocardiographic
- EP
electrophysiological
- ICD
internal cardioverter-defibrillator
- LAFB
left superior (anterior) fascicular block
- LBBB
left bundle branch block
- LGE
late gadolinium enhancement
- LPFB
Left inferior (posterior) fascicular block
- LV
left ventricle
- LVEF
left ventricular ejection fraction
- LVH
left ventricular hypertrophy
- MI
myocardial infarction
- MVT
monomorphic ventricular tachycardia
- RBBB
right bundle branch block
- ROC
receiver operating characteristic
- RV
right ventricle
- RVH
right ventricular hypertrophy
- SI
signal intensity
- VCG
vectorcardiogram
- VF
ventricular fibrillation
Footnotes
Journal Subject Codes: [31] Electrocardiography, [30] CT and MRI, [5] Arrhythmia, clinical electrophysiology, drugs, [16] Myocardial cardiomyopathy disease, [7] Chronic ischemic heart disease
This study is registered at www.clinicaltrials.gov – identifier NCT00181233
Conflict of Interest Disclosures: Drs. Wu and Lima receive research grant support from GE Healthcare Technologies. Dr. Wagner receives research grant support from Medtronic, Physiocontrol and Welch Allyn. Dr. Tomaselli receives research grant support from Boston-Scientific.
References
- 1.Moss AJ, Zareba W, Hall WJ, Klein H, Wilber DJ, Cannom DS, Daubert JP, Higgins SL, Brown MW, Andrews ML. Prophylactic implantation of a defibrillator in patients with myocardial infarction and reduced ejection fraction. N Engl J Med. 2002;346:877–883. doi: 10.1056/NEJMoa013474. [DOI] [PubMed] [Google Scholar]
- 2.Bardy GH, Lee KL, Mark DB, Poole JE, Packer DL, Boineau R, Domanski M, Troutman C, Anderson J, Johnson G, McNulty SE, Clapp-Channing N, Davidson-Ray LD, Fraulo ES, Fishbein DP, Luceri RM, Ip JH. Amiodarone or an implantable cardioverter-defibrillator for congestive heart failure. N Engl J Med. 2005;352(3):225–237. doi: 10.1056/NEJMoa043399. [DOI] [PubMed] [Google Scholar]
- 3.Passman R, Kadish A. Sudden death prevention with implantable devices. Circulation. 2007;116:561–571. doi: 10.1161/CIRCULATIONAHA.106.655704. [DOI] [PubMed] [Google Scholar]
- 4.Dillon SM, Allessie MA, Ursell PC, Wit AL. Influences of anisotropic tissue structure on reentrant circuits in the epicardial border zone of subacute canine infarcts. Circ Res. 1988;63:182–206. doi: 10.1161/01.res.63.1.182. [DOI] [PubMed] [Google Scholar]
- 5.Judd RM, Lugo-Olivieri CH, Arai M, Kondo T, Croisille P, Lima JA, Mohan V, Becker LC, Zerhouni EA. Physiological basis of myocardial contrast enhancement in fast magnetic resonance images of 2-day-old reperfused canine infarcts. Circulation. 1995;92:1902–1910. doi: 10.1161/01.cir.92.7.1902. [DOI] [PubMed] [Google Scholar]
- 6.Kim RJ, Fieno DS, Parrish TB, Harris K, Chen EL, Simonetti O, Bundy J, Finn JP, Klocke FJ, Judd RM. Relationship of MRI delayed contrast enhancement to irreversible injury, infarct age, and contractile function. Circulation. 1999;100:1992–2002. doi: 10.1161/01.cir.100.19.1992. [DOI] [PubMed] [Google Scholar]
- 7.Bello D, Fieno DS, Kim RJ, Pereles FS, Passman R, Song G, Kadish AH, Goldberger JJ. Infarct morphology identifies patients with substrate for sustained ventricular tachycardia. J Am Coll Cardiol. 2005;45:1104–1108. doi: 10.1016/j.jacc.2004.12.057. [DOI] [PubMed] [Google Scholar]
- 8.Schmidt A, Azevedo CF, Cheng A, Gupta SN, Bluemke DA, Foo TK, Gerstenblith G, Weiss RG, Marban E, Tomaselli GF, Lima JA, Wu KC. Infarct tissue heterogeneity by magnetic resonance imaging identifies enhanced cardiac arrhythmia susceptibility in patients with left ventricular dysfunction. Circulation. 2007;115:2006–2014. doi: 10.1161/CIRCULATIONAHA.106.653568. [DOI] [PMC free article] [PubMed] [Google Scholar]
- 9.Yan AT, Shayne AJ, Brown KA, Gupta SN, Chan CW, Luu TM, Di Carli MF, Reynolds HG, Stevenson WG, Kwong RY. Characterization of the peri-infarct zone by contrast-enhanced cardiac magnetic resonance imaging is a powerful predictor of post-myocardial infarction mortality. Circulation. 2006;114:32–39. doi: 10.1161/CIRCULATIONAHA.106.613414. [DOI] [PubMed] [Google Scholar]
- 10.McCrohon JA, Moon JC, Prasad SK, McKenna WJ, Lorenz CH, Coats AJ, Pennell DJ. Differentiation of heart failure related to dilated cardiomyopathy and coronary artery disease using gadolinium-enhanced cardiovascular magnetic resonance. Circulation. 2003;108:54–59. doi: 10.1161/01.CIR.0000078641.19365.4C. [DOI] [PubMed] [Google Scholar]
- 11.Bello D, Shah DJ, Farah GM, Di Luzio S, Parker M, Johnson MR, Cotts WG, Klocke FJ, Bonow RO, Judd RM, Gheorghiade M, Kim RJ. Gadolinium cardiovascular magnetic resonance predicts reversible myocardial dysfunction and remodeling in patients with heart failure undergoing beta-blocker therapy. Circulation. 2003;108:1945–1953. doi: 10.1161/01.CIR.0000095029.57483.60. [DOI] [PubMed] [Google Scholar]
- 12.Nazarian S, Bluemke DA, Lardo AC, Zviman MM, Watkins SP, Dickfeld TL, Meininger GR, Roguin A, Calkins H, Tomaselli GF, Weiss RG, Berger RD, Lima JA, Halperin HR. Magnetic resonance assessment of the substrate for inducible ventricular tachycardia in nonischemic cardiomyopathy. Circulation. 2005;112:2821–2825. doi: 10.1161/CIRCULATIONAHA.105.549659. [DOI] [PMC free article] [PubMed] [Google Scholar]
- 13.Assomull RG, Prasad SK, Lyne J, Smith G, Burman ED, Khan M, Sheppard MN, Poole-Wilson PA, Pennell DJ. Cardiovascular magnetic resonance, fibrosis, and prognosis in dilated cardiomyopathy. J Am Coll Cardiol. 2006;48:1977–1985. doi: 10.1016/j.jacc.2006.07.049. [DOI] [PubMed] [Google Scholar]
- 14.Wu KC, Weiss RG, Thiemann DR, Kitagawa K, Schmidt A, Dalal D, Lai S, Bluemke DA, Gerstenblith G, Marban E, Tomaselli GF, Lima JA. Late gadolinium enhancement by cardiovascular magnetic resonance heralds an adverse prognosis in nonischemic cardiomyopathy. J Am Coll Cardiol. 2008;51:2414–2421. doi: 10.1016/j.jacc.2008.03.018. [DOI] [PMC free article] [PubMed] [Google Scholar]
- 15.Selvester RH, Collier CR, Pearson RB. Analog Computer Model of the Vectorcardiogram. Circulation. 1965;31:45–53. doi: 10.1161/01.cir.31.1.45. [DOI] [PubMed] [Google Scholar]
- 16.Selvester RH, Kalaba R, Collier CR, Bellman R, Kagiwada H. A digital computer model of the vectorcardiogram with distance and boundary effects: simulated myocardial infarction. Am Heart J. 1967;74:792–808. doi: 10.1016/0002-8703(67)90098-1. [DOI] [PubMed] [Google Scholar]
- 17.Wagner GS, Freye CJ, Palmeri ST, Roark SF, Stack NC, Ideker RE, Harrell FE, Jr, Selvester RH. Evaluation of a QRS scoring system for estimating myocardial infarct size. I. Specificity and observer agreement. Circulation. 1982;65:342–347. doi: 10.1161/01.cir.65.2.342. [DOI] [PubMed] [Google Scholar]
- 18.Hindman NB, Schocken DD, Widmann M, Anderson WD, White RD, Leggett S, Ideker RE, Hinohara T, Selvester RH, Wagner GS. Evaluation of a QRS scoring system for estimating myocardial infarct size. V. Specificity and method of application of the complete system. Am J Cardiol. 1985;55:1485–1490. doi: 10.1016/0002-9149(85)90958-0. [DOI] [PubMed] [Google Scholar]
- 19.Sevilla DC, Wagner NB, White RD, Peck SL, Ideker RE, Hackel DB, Reimer KA, Selvester RH, Wagner GS. Anatomic validation of electrocardiographic estimation of the size of acute or healed myocardial infarcts. Am J Cardiol. 1990;65:1301–1307. doi: 10.1016/0002-9149(90)91317-y. [DOI] [PubMed] [Google Scholar]
- 20.Palmeri ST, Harrison DG, Cobb FR, Morris KG, Harrell FE, Ideker RE, Selvester RH, Wagner GS. A QRS scoring system for assessing left ventricular function after myocardial infarction. N Engl J Med. 1982;306:4–9. doi: 10.1056/NEJM198201073060102. [DOI] [PubMed] [Google Scholar]
- 21.Bounous EP, Jr, Califf RM, Harrell FE, Jr, Hinohara T, Mark DB, Ideker RE, Selvester RH, Wagner GS. Prognostic value of the simplified Selvester QRS score in patients with coronary artery disease. J Am Coll Cardiol. 1988;11:35–41. doi: 10.1016/0735-1097(88)90163-5. [DOI] [PubMed] [Google Scholar]
- 22.Jones MG, Anderson KM, Wilson PW, Kannel WB, Wagner NB, Wagner GS. Prognostic use of a QRS scoring system after hospital discharge for initial acute myocardial infarction in the Framingham cohort. Am J Cardiol. 1990;66:546–550. doi: 10.1016/0002-9149(90)90479-k. [DOI] [PubMed] [Google Scholar]
- 23.Strauss DG, Selvester RH. The QRS complex -- a biomarker that “images” the heart: QRS scores to quantify myocardial scar in the presence of normal and abnormal ventricular conduction. J Electrocardiol. 2009;42 doi: 10.1016/j.jelectrocard.2008.07.011. in press. [DOI] [PubMed] [Google Scholar]
- 24.Selvester RH, Wagner GS, Ideker RE. Myocardial Infarction. In: Macfarlane PW, Lawrie TDV, editors. Comprehensive electrocardiology: theory and practice in health and disease. Vol. 1. New York: Pergammon Press; 1989. pp. 565–629. [Google Scholar]
- 25.Bland JM, Altman DG. Statistical methods for assessing agreement between two methods of clinical measurement. Lancet. 1986;1:307–310. [PubMed] [Google Scholar]
- 26.Pitman EJG. A note on normal correlation. Biometrika. 1939;31:9–12. [Google Scholar]
- 27.Engblom H, Hedstrom E, Heiberg E, Wagner GS, Pahlm O, Arheden H. Size and transmural extent of first-time reperfused myocardial infarction assessed by cardiac magnetic resonance can be estimated by 12-lead electrocardiogram. Am Heart J. 2005;150:920. doi: 10.1016/j.ahj.2005.07.022. [DOI] [PubMed] [Google Scholar]
- 28.Engblom H, Wagner GS, Setser RM, Selvester RH, Billgren T, Kasper JM, Maynard C, Pahlm O, Arheden H, White RD. Quantitative clinical assessment of chronic anterior myocardial infarction with delayed enhancement magnetic resonance imaging and QRS scoring. Am Heart J. 2003;146:359–366. doi: 10.1016/S0002-8703(03)00187-X. [DOI] [PubMed] [Google Scholar]
- 29.Ideker RE, Wagner GS, Ruth WK, Alonso DR, Bishop SP, Bloor CM, Fallon JT, Gottlieb GJ, Hackel DB, Phillips HR, Reimer KA, Roark SF, Rogers WJ, Savage RM, White RD, Selvester RH. Evaluation of a QRS scoring system for estimating myocardial infarct size. II. Correlation with quantitative anatomic findings for anterior infarcts. Am J Cardiol. 1982;49:1604–1614. doi: 10.1016/0002-9149(82)90235-1. [DOI] [PubMed] [Google Scholar]
- 30.Mahrholdt H, Wagner A, Holly TA, Elliott MD, Bonow RO, Kim RJ, Judd RM. Reproducibility of chronic infarct size measurement by contrast-enhanced magnetic resonance imaging. Circulation. 2002;106:2322–2327. doi: 10.1161/01.cir.0000036368.63317.1c. [DOI] [PubMed] [Google Scholar]
- 31.Elizari MV, Acunzo RS, Ferreiro M. Hemiblocks revisited. Circulation. 2007;115:1154–1163. doi: 10.1161/CIRCULATIONAHA.106.637389. [DOI] [PubMed] [Google Scholar]
- 32.Horacek BM, Warren JW, Albano A, Palmeri MA, Rembert JC, Greenfield JC, Jr, Wagner GS. Development of an automated Selvester Scoring System for estimating the size of myocardial infarction from the electrocardiogram. J Electrocardiol. 2006;39:162–168. doi: 10.1016/j.jelectrocard.2005.08.013. [DOI] [PubMed] [Google Scholar]