Abstract
We present a new concept for strengthening ceamics by utilizing a graded structure with a low elastic modulus at both top and bottom surfaces sandwiching a high-modulus interior. Closed-form equations have been developed for stress analysis of simply supported graded sandwich beams subject to transverse center loads. Theory predicts that suitable modulus gradients at the ceramic surface can effectively reduce and spread the maximum bending stress from the surface into the interior. The magnitude of such stress dissipation is governed by the thickness ratio of the beam to the graded layers. We test our concept by infiltrating both top and bottom surfaces of a strong class of zirconia ceramic with an in-house prepared glass of similar coefficient of thermal expansion and Poisson’s ratio to zirconia, producing a controlled modulus gradient at the surface without significant long-range residual stresses. The resultant graded glass/zirconia/glass composite exhibits significantly higher load-bearing capacity than homogeneous zirconia.
Keywords: functionally graded materials (FGM), ceramic matrix composites (CMC), modulus gradients, flexure formulas, stress dissipation
1. INTRODUCTION
With the increasing demand for ceramics of high mechanical integrity, particularly in the biomedical industry, there is particular interest in the development of surface strengthening techniques. The traditional approaches used to strengthen ceramics and improve their resistance to contact and/or flexural damage rely on inducing a layer of compressive residual stresses at the ceramic surfaces by tempering [1], introducing second-phase particles [2] or infiltrating glass with a lower coefficient of thermal expansion (CTE) into the ceramic surfaces [3, 4]. However, introduction of surface compressive stresses inevitably lead to the creation of concomitant tensile stresses in the bulk ceramic, which can promote cracking [5]. Here we offer an alternative approach to strengthening ceramics and to improving their contact damage resistance by tailoring the surface elastic properties without introducing any compressive stresses to the materials. The impetus for this approach comes from previous works by Suresh, Nitin and their team [6–8]. These authors showed that when the contact surface of alumina or silicon nitride was infiltrated with aluminosilicate or oxynitride glass, respectively, having similar CTEs and Poisson’s ratios to, but lower moduli than, the infiltrating surfaces, an increase in elastic modulus from surface glass to a strong ceramic interior can be engineered without introducing significant residual stresses. The graded glass/ceramic surfaces produced in this manner offered much better resistance to contact [6] and sliding [8] damage than either constituent ceramic or glass. We argue that this very same elastically graded surface can be utilized to improve the flexural damage resistance, and thus the flexural strength, of ceramic.
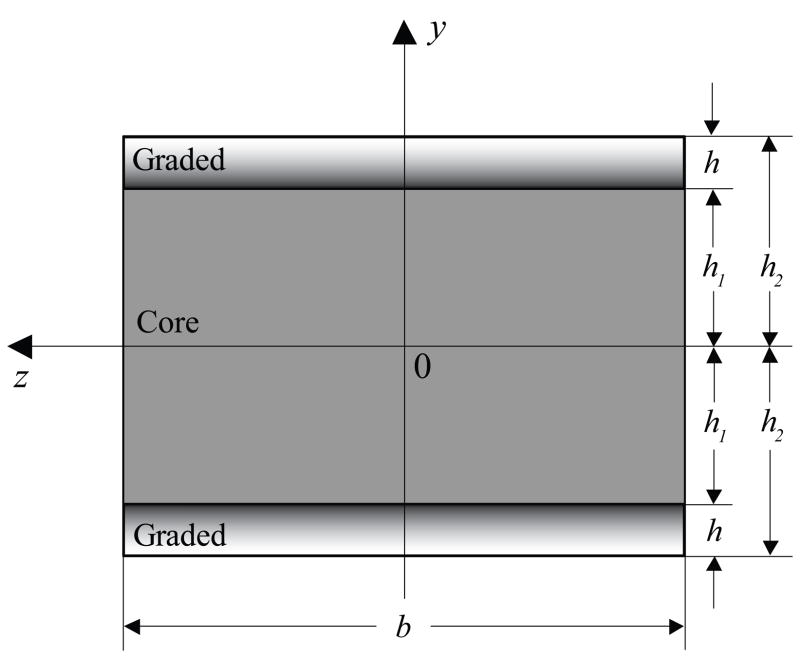
For demonstration, we infiltrated both the top and bottom surfaces of a strong class of ceramic—3 mol.% yttria-stabilized tetragonal zirconia polycrystal (Y-TZP)—with an in-house prepared glass, which possesses a similar CTE and Poisson’s ratio to that of Y-TZP. The resultant material possesses a graded glass/zirconia/glass (G/Z/G) structure (Fig. 1), where the gradations of the glass content at the parallel zirconia surfaces mirror each other. Three-point bending tests showed improved load-bearing capacity in G/Z/G beams compared to their homogeneous Y-TZP counterparts.
Fig. 1.
Cross-section of a symmetrically graded sandwich beam of width b and thickness 2h2. h is the graded layer thickness and h1 the distance from the neutral axis z to the graded layer/core interface.
The concept of functionally graded materials emerged from the demands of high-temperature structural applications [9]. The initial design utilized a refractory ceramic on the high-temperature side and a tough, strong metal on the low-temperature side, and the transition from ceramic to metal is gradual through the structure thickness [9, 10]. Since its inception, the concept has found many applications, including thermal, wear and corrosion barriers, dental and medical devices, aerospace and automotive components, etc. Several studies have been carried out to analyze the response of functionally graded beams or plates to mechanical loads [10–13]. However, there is no closed-form elasticity solution pertinent to the current structure available in the open literature. The present study extends the composite beam theory to analyze a symmetrically graded beam with low elastic modulus at both the top and bottom surfaces, sandwiching a high-modulus interior. Explicit equations concerning stress distributions in graded sandwich beams relative to homogeneous beams subject to transverse center loads are developed. Essential predictions of the theory are confirmed by loading the rectangular beams using a three-point bending arrangement. Dependence of stress distributions on the ratios of beam thickness to the graded layers is examined. Design guidelines for optimizing the load-bearing capacity of graded sandwich beams are presented.
2. STRESS IN COMPOSITE BEAMS
In this section, we develop the flexure formulas to quantitatively predict bending stresses in sandwich beams with elastic gradients at both top and bottom surfaces. We demonstrate that controlled gradients in elastic modulus at the surface can dissipate bending stresses and thus increase the load-bearing capabilities of a beam.
2.1. Elastic modulus function in graded beams
We shall begin with the determination of the elastic modulus function in graded sandwich beams. A schematic diagram of a cross-section of an elastically graded sandwich beam is shown in Fig. 1. The beam consists of a uniform core with graded layers at both top and bottom surfaces. The layers are bonded together securely so they act as a single solid. We assume that the xy plane is the plane of symmetry and that xz plane is the neutral plane of the beam. The neutral axis passes through the centroid of the cross-sectional area. h2 and h1 represent the half thicknesses of the beam and its homogeneous core, respectively. h (= h2 − h1) is the thickness of each graded layer. b is the width of the beam. For the homogeneous core, the Young’s modulus Eb is uniform throughout the section. For the graded layers, the Young’s modulus increases from Es at the surface to Eb at the graded layer/core interface.
Previous studies [6, 7, 14] have shown that the elastic modulus in a glass–ceramic infiltrated layer takes the form of power-law relation. Thus we can conveniently write the modulus expression, Eg, as a function of depth beneath the surface:
| (1) |
where y is the distance from the neutral axis and varies from h1 to h2. n is a dimensionless constant. m is a scale factor which can be derived by rearranging Eq. (1)
| (2) |
At y = h1, h2 − y = h and Eg = Eb, we obtain:
| (3) |
Thus Eq. 1 can be written in a generic form:
| (4) |
2.2 Stresses associated with bending
Our analysis here is based on the theory for bending of composite beams, i.e. beams of more than one material. The strains in the graded sandwich beam are determined from the basic axiom that cross-sections remain planar during bending. This axiom is valid for pure bending regardless of the nature of the material. Therefore, the longitudinal strains εx vary linearly from top to bottom of the beam [15]:
| (5) |
where y is the distance from the neutral axis, ρ is the radius of the curvature and κ is the curvature.
The normal stresses acting on the cross-section can be obtained from the strains by using the stress–strain relationships. Let us assume that both graded layers and the uniform core behave in a linearly elastic manner so that Hooke’s law for uniaxial stress is valid. Then we express the normal stresses at distance y from the neutral axis in terms of curvature:
| (6a) |
| (6b) |
where σxgu is the stress in the uniform core, while σxgg is the stress in graded layer.
2.3. Moment–curvature relation
The maximum bending moment M for a three-point bending test is [15]:
| (7) |
where F is the applied load and L is the span between bearers.
The moment–curvature relationship for the graded sandwich beam may be determined from the condition that the moment resultant of the bending stress is equal to the bending moment M acting at the cross-section [15]:
| (8) |
where b is the width of the specimen.
For convenience, we let:
| (9a) |
| (9b) |
| (9c) |
The curvature in terms of the bending moment is then:
| (10) |
With the moment–curvature relation in place, we are now in a position to derive explicit formulas for bending stresses along the load axis of a graded sandwich beam. By substituting the expression for curvature (Eq. (10)) into Eqs. (6a) and (6b), we obtain the normal stresses (or bending stresses) σxgu in the uniform core and σxgg in the graded surface layers:
| (11a) |
| (11b) |
where Igu, Igg1 and Igg2 are given in Eqs. (9a)–(9c).
For the limiting case of homogeneous beams, Es = Eb, h1 = h2, Eq. (8) reduces to a familiar form:
| (12) |
Let
| (13) |
The normal stresses in a homogeneous beam can be written in direct analogy to Eq. (11):
| (14) |
2.4. Dissipation of stresses in graded structures
The quantities of greatest interest are the magnitude and position of the maximum normal stress in a graded sandwich beam, which can be computed using the flexure formulas derived in Eq. (11). Subsequently, by comparing the maximum stress in a graded beam with a homogeneous beam subject to three-point bending under a prescribed load, we are able to determine the degree of stress dissipation resulting from the modulus gradients. The prescribed load utilized here is approximately 90% of the fracture loads for homogeneous beams. It is important to note that the bending stresses σxgu in the uniform core and σxgg in the graded surface layers are described by linear (Eq. (11a)) and nonlinear (Eq. (11b)) functions, respectively. The linear function suggests that the maximum bending stress σxgu-max in the uniform core occurs at the graded layer/core interface. The nonlinear function suggests that the maximum bending stress σxgg-max in a graded layer can occur at any thickness, ranging from immediately beneath the surface to the graded layer/uniform core interface. In cases where σxgg-max occurs at the graded layer/core interface, i.e. y = h1, Eq. (11b) reduces to Eq. (11a), we have σxgg-max = σxgu-max.
Further, bending stresses ratio at the surface of a graded beam relative to that of its homogeneous counterpart can be obtained by limiting Eq. (11b) and Eq. (14) to y = h2.
| (15) |
3. MATERIALS AND METHODS
3.1. Materials
A model composite beam with a controlled gradient of elastic modulus at both top and bottom surfaces was chosen for investigation. Specimens were fabricated using a glass–ceramic infiltration method described in detail in Ref. [14]. In this method, an in-house developed glass composition, which has a similar CTE and Poisson’s ratio to that of Y-TZP, was employed to infiltrate both the top and bottom surfaces of a presintered Y-TZP beam (1400°C for 1 h). The main composition (>1 wt.%) of the infiltrating glass contained: SiO2 (65.5 wt.%), Al2O3 (11.7 wt.%), K2O (10.0 wt.%), Na2O (7.3 wt.%), CaO (3.0 wt.%) and Tb4O7 (1.9 wt.%). The CTE and Poisson’s ratio of the selected glass composition were 10.4 × 10⁻⁶ °C−1 (from 25 to 450°C) and 0.28, while the CTE and Poisson’s ratio of Y-TZP were 10.5 ×10⁻⁶ °C−1 (from 25 to 450°C) and 0.3, respectively.
Glass infiltration and densification of Y-TZP were carried out simultaneously at 1450°C for 2 h in a high-temperature box furnace in air. A heating and cooling rate of 900°C h−1 was employed. The resultant structure consists of a thin, outer surface residual glass layer followed by a graded glass–zirconia layer at both the top and bottom surfaces, sandwiching a high-modulus Y-TZP core. The outer surface residual glass was gently ground away from both the top and bottom surfaces of G/Z/G using 6 μm and then 1 μm diamond suspensions. Homogeneous Y-TZP control beams were sintered at 1450°C for 2 h and polished to 1 μm surface finish.
Microstructures of G/Z/G specimens were examined by scanning electron microscopy (SEM) in backscattered electron (BSE) imaging mode. Specimens were sectioned using a water-cooled low-speed diamond saw. The cross-sections were polished with successive grits to 1 μm finish and carbon coated to prevent charge accumulation. The accelerating voltage used was 10 kV.
3.2. Mechanical testing
The elastic modulus of the graded composite, Eg, at any depth below the surface was determined using nanoindentation, carried out on a 3D Omni Probe TriboIndenter* (Hysitron, Minneapolis, MN) with a Berkovich indenter. Indentations were made on the polished (1 μm finish) cross-sections of G/Z/G, from the surface-graded glass–zirconia layer to the Y-TZP interior with a step size of 3 μm. To ensure the distance between any two indents was greater than the dimension of two indentation impressions, we conducted a line mapping in a direction diagonal to the specimen surface normal; the indenter traveled 15 μm parallel to the surface and 3 μm perpendicular to the surface before making the next indent. The tip area function and the machine compliance were determined using fused silica samples. A maximum indentation load of 40 mN and a loading and unloading rate of 5 mN s−1 were employed. At this peak load, the indenter penetrated ~0.4 μm into the dense Y-TZP and even deeper in the glass–zirconia region. Such penetration depths resulted in indentation impressions with lateral dimensions of ~3–4 μm. Considering the average grain size of Y-TZP is ~0.5 μm, a lateral indentation impression of 3 μm would probe 15–20 grains in a dense Y-TZP region or over five adjacent grains in the graded layer. The reduced modulus, Er, for each indentation was determined from the initial unloading slope of the load–displacement curve [16, 17]. Modulus of the material, E, was computed using the relation proposed by Oliver and Pharr [16]:
where v is the Poisson’s ratio of the ceramic material, and Ei and vi are the elastic modulus and Poisson’s ratio, respectively, of the diamond indenter. Here we use v = 0.3 for Y-TZP and for graded glass–zirconia composite, Ei = 1040 GPa and vi = 0.07 for the diamond indenter [16].
Three-point bending tests were carried out on graded sandwich and homogeneous zirconia beams of dimensions approximately 1.2 ×4 ×25 mm3. These are the thinnest specimens which meet the specifications for three-point bending test as recommended by the International Organization for Standardization [18]. The span, L, between bearers was 20 mm. The test specimen was supported by two hardened steel rods (r = 1 mm). The load was applied perpendicular to the specimen’s surface through a hardened steel rod (r = 1 mm) at the midpoint between the supports. A cross-head speed of 1 mm min−1 was utilized. The loads required to break the specimens were recorded. Parallel studies were conducted on homogeneous Y-TZP control beams of the same dimensions.
4. RESULTS
4.1 Elastic modulus profile
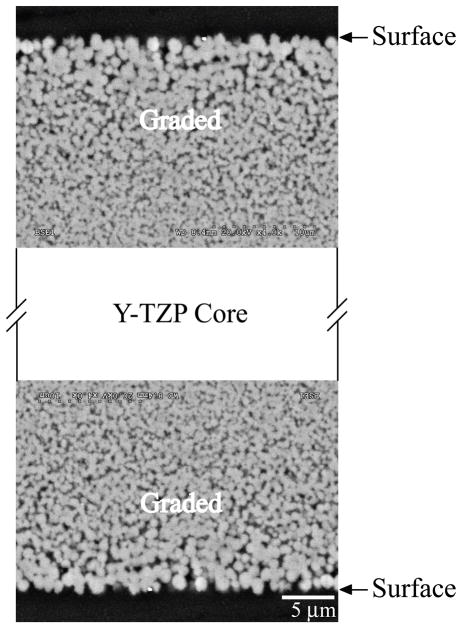
Fig. 2 is a BSE image of G/Z/G fabricated from presintered (1400°C for 1 h) Y-TZP beams followed by glass infiltration/densification at 1450°C for 2 h. The total thickness of G/Z/G beams was ~1.2 mm, including a graded glass–zirconia layer at both the top and bottom surfaces, sandwiching a dense Y-TZP core. The graded layers contained a relatively high glass content (dark phase) at the surface and gradually transformed to a dense Y-TZP interior (light phase, owing to the high atomic weight of Y-TZP relative to the glass phase).
Fig. 2.
Backscattered electron (BSE) image showing cross-sectional view of a G/Z/G beam (thickness 2h2 = 1.2 mm) fabricated from Y-TZP templates presintered at 1400°C for 1 h followed by glass infiltration/densification at 1450°C for 2 h in air. Note: the glass content (dark phase) gradually decreased as it proceeded towards the interior.
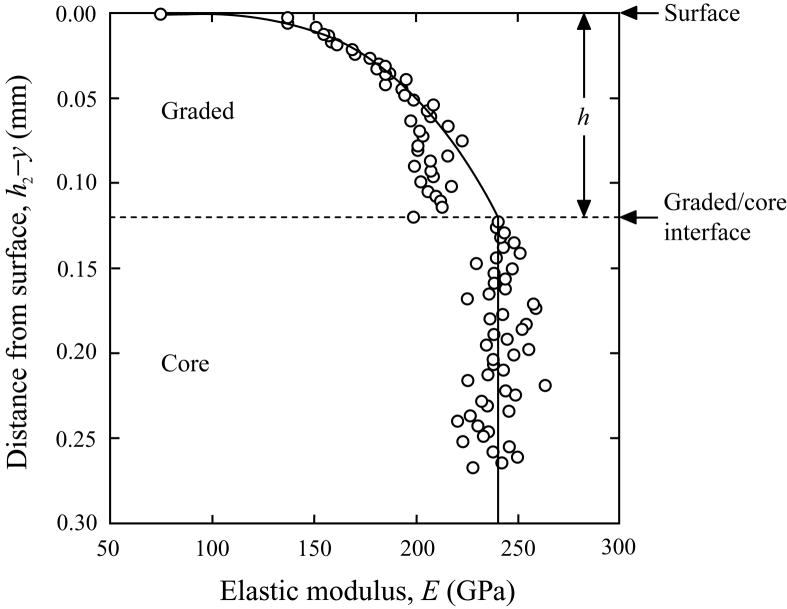
The dependence of Young’s modulus gradation on the depth (from both top and bottom surfaces to interior) of G/Z/G is shown in Fig. 3. For the glass–zirconia graded layer (h ≈ 0.12 mm), the Young’s modulus varied from E = 74.6 GPa near the surface to E = 212.8 GPa near the graded layer/Y-TZP interface. The Y-TZP core exhibited a Young’s modulus E = 240.8 ± 6.4 (mean ± SD, average of 50 indents from a G/Z/G sample). The Young’s modulus variation, Eg, in the graded glass–zirconia layer is best described by a power-law relation shown in Eq. (4), where Es = 74.6 GPa and Eb = 240.8 GPa are the elastic modulus at the surface and the interface of graded layers and Y-TZP core; h = 0.12 mm is the thickness of the graded layer; n = 0.32 is an empirically derived coefficient; h2 is the half thickness of the beam; y is the distance from the neutral axis and varies from h2 to (h2 − h), thus (h2 − y) represents the depth from surface.
Fig. 3.
Variations of elastic modulus as a function of the depth below the G/Z/G surface (h2 − y). G/Z/G specimens were fabricated from presintered Y-TZP templates (1400°C for 1 h) followed by glass infiltration at 1450°C for 2 h. The elastic modulus data was obtained by nanoindentation. The solid curve is a semi-empirical fit to the elastic modulus data, Eg, in the graded layers using a power-law relation , where Es = 74.6 GPa and Eb = 240.8 GPa are the elastic moduli at the surface and in the bulk, respectively; h = 0.12 mm is the thickness of the graded layer; h2 is the half thickness of the beam; y is the distance from the neutral axis; and (h2 − y) is the distance from the surface.
4.2 Three-point bend test data
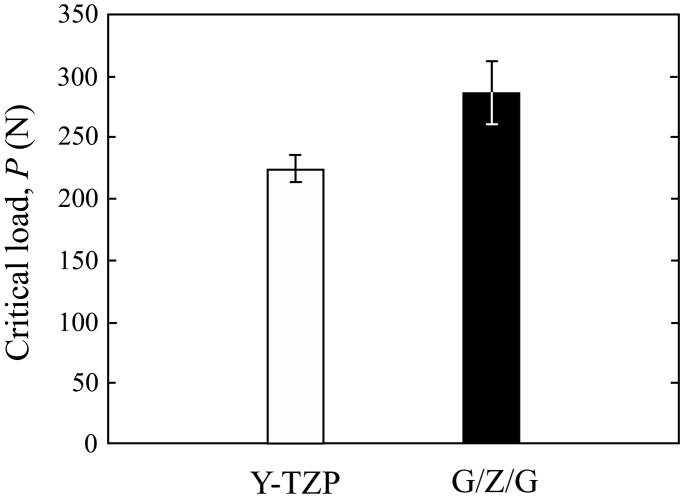
Loads at the fracture point for polished homogeneous Y-TZP and graded G/Z/G beams are shown in Fig. 4. Six specimens were fabricated for each material (homogeneous or graded). Loads required to fracture G/Z/G beams (285 ± 26 N, mean ± SD) were ~28% higher than those for homogeneous Y-TZP beams (223 ± 11 N). A two-sample t-test showed that it was unlikely (P < 0.001) that a specimen as strong as G/Z/G could have been sampled from the population of homogeneous Y-TZP.
Fig. 4.
Bar chart showing critical loads for flexural fracture of ceramic beams subject to three-point bending. The beams were 2h2 = 1.2 mm thick and b = 4 mm wide. The loading rate was 1 mm min−1 and the span between bearers was L = 20 mm. Ceramic beams tested were G/Z/G (fabricated from glass infiltration of 1400°C presintered Y-TZP) and the homogeneous Y-TZP controls.
4.3 Maximum bending stresses
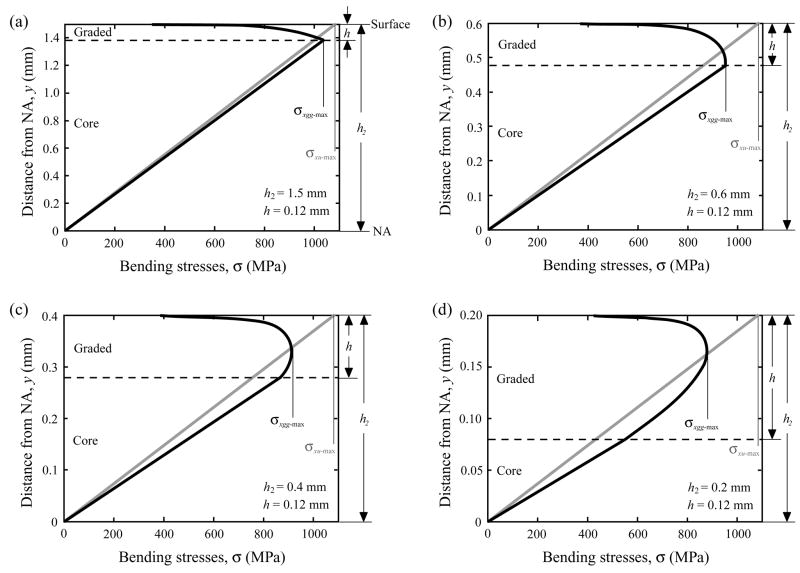
To shed some light on stress dissipation in graded structures, we plot bending stresses as a function of distance from the neutral axis for beams with various thicknesses (Fig. 5). Stress distributions in homogeneous beams of various thicknesses are also plotted for reference. The maximum loads used, for both graded and homogeneous structures of various thicknesses, were about 90% of the fracture loads for homogeneous beams. It was assumed that graded G/Z/G beams, regardless of thickness, were fabricated using the same condition, i.e. glass infiltration of presintered (1400°C for 1 h) Y-TZP beams at 1450°C for 2 h. The thickness of the graded layer remains constant irrespective of the beam thickness. Fig. 5 shows, for bending of graded G/Z/G beams, that if we hold the thickness of the graded layers constant at h = 0.12 mm, the maximum bending stresses σxgg-max arise at the graded layer/core interface in beams of total thicknesses greater than 1.2 mm (i.e. h2 > 0.6 mm). For beam thicknesses equal to or less than 1.2 mm, the maximum bending stresses develop within the graded layer and become closer to the surface as the beam thickness diminishes. In view of the above analysis, the maximum stress σxgg-max in a graded structure can be determined as follows. For relatively thick beams (2h2 > 1.2 mm), σxgg-max appears at the layer/core interface and can be determined using Eq. (11b) and letting y = h1, which yields h2 – h1 = h. For thin beams (2h2 ≤ 1.2 mm), σxgg-max can be obtained by plotting the σ–y function as shown in Fig. 5.
Fig. 5.
Bending stresses as a function of distance from the neutral axis (NA) for beams with a constant graded layer thickness h = 0.12 mm but various total thicknesses: (a) 2h2 = 3 mm, (b) 2h2 = 1.2 mm, (c) 2h2 = 0.8 mm and (d) 2h2 = 0.4 mm. Stress distributions in homogeneous beams of identical thicknesses are also plotted for reference. Note: stresses in graded and homogeneous beams were calculated using Eqs. (11) and (14), respectively. Solid black curves and gray lines represent stress distributions in graded and homogeneous beams, respectively. The maximum loads used, for both graded and homogeneous beams, were about 90% of the fracture loads for homogeneous beams. Vertical black and gray lines indicate the maximum stresses σxgg-max and σxu-max in graded and homogeneous beams, respectively.
4.4 Dissipation of stresses in graded structures
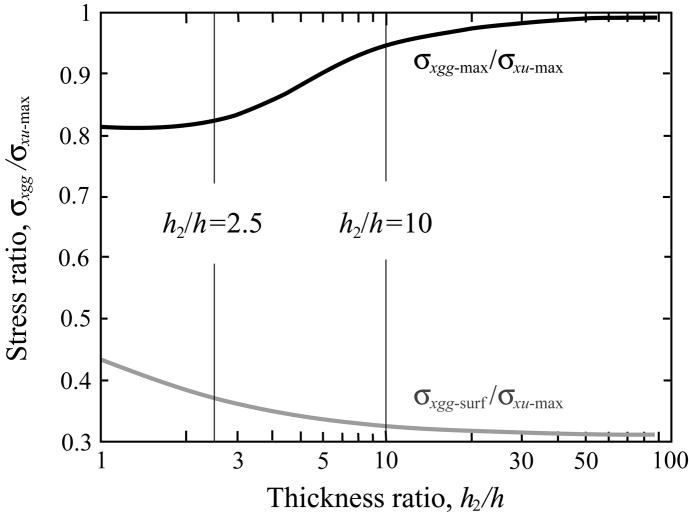
Fig. 6 shows the maximum and surface stresses in the graded beams before flexural fracture, normalized by the maximum stresses occurring at the surface of their homogeneous counterparts, as a function of the beam thickness (2h2), normalized by the total graded layer thickness (2h = 0.24 mm). Solid and gray curves represent the normalized maximum and surface stresses, respectively, in graded beams of various thickness ratios. As can be seen in Fig. 6, controlled gradients of the surface elastic property can effectively reduce the maximum bending stress in a beam. However, the magnitude of the stress dissipation depends on the thickness ratio of the beam and the graded layers. For small thickness ratios (i.e. h2/h < 2.5), the maximum stress in a graded beam is approximately 81–82% of that in its homogeneous counterpart. For intermediate thickness ratios (i.e. 2.5 ≤ h2/h ≤ 10), the maximum stress increases relatively fast as the thickness ratio increases, from 82.4% of that in a homogeneous beam for h2/h = 2.5 to 94.5% for h2/h = 10. For large thickness ratios (i.e. h2/h > 10), the reduction in maximum stress due to elastic gradients becomes minimal and the difference in maximum stresses between the graded and homogeneous beams becomes smaller as the thickness ratio further increases. In addition, the elastic gradient also effectively reduces the surface stresses in a graded beam. The magnitude of the surface stress reduction decreases steadily with the increasing thickness ratio, from 43% of the homogeneous beam value for h2/h = 1 to 34% for h2/h = 5 and to ~31% for h2/h > 33.
Fig. 6.
Plots of maximum stress ratio (σxgg-max/σxu-max, black curve) and surface stress ratio (σxgg-surf/σxu-max, gray curve) of graded and homogeneous beams as a function of the beam to graded layers thickness ratio. The maximum stress ratio was derived from Eqs. (11) and (14), while the surface stress ratio was computed using Eq. (15). Vertical lines indicate thickness ratios of h2/h = 2.5 and 10.
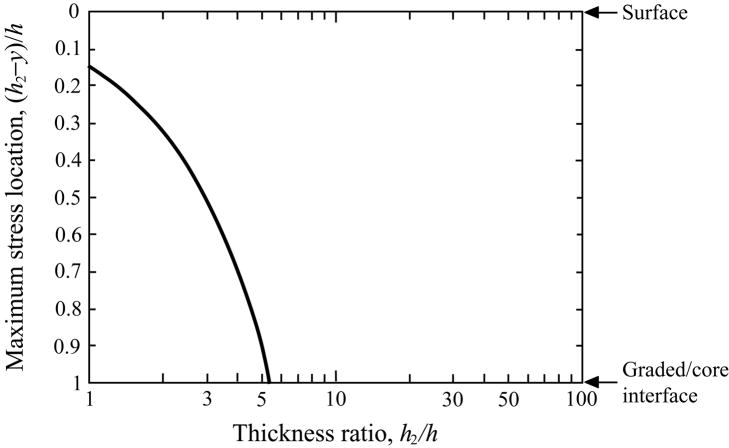
Fig. 7 plots the distance of the maximum stress from the graded structure surface, normalized by the thickness of a graded layer (h = 0.12 mm), as a function of the thickness ratio. For h2/h > 5, the maximum stress occurs at the graded layer/Y-TZP core interface. For h2/h ≤ 5, the maximum stress begins to appear in the graded layer and becomes closer to the surface as the thickness ratio decreases, being located at 90% of the graded layer thickness beneath the surface for h2/h = 5 to around 16% for h2/h = 1.
Fig. 7.
Plot of normalized maximum stress position ( , distance from the surface/graded layer thickness) as a function of beam to graded layers thickness ratio. Data were generated using Eq. (11).
5. DISCUSSION
We have presented an analysis of bending stresses in sandwich beams with modulus gradients at both top and bottom surfaces. Based on the current experimental results and published literature [6, 8], we propose a power-law relation to describe the elastic modulus gradient—from a low modulus glass–Y-TZP surface to a higher modulus Y-TZP core. In functionally graded materials, mechanical properties often vary with position in a power-law [6, 8, 19, 20] or linear [20, 21] function. The elastic modulus function (Eq. (4)) derived here is a generalized form, which can be used to describe elastic modulus gradients with a power-law or linear profile. The scaling exponent n varies with material system and can be determined empirically. For example, for the glass–zirconia system, n = 0.32, and for glass–alumina, n = 0.497 [6, 8]. Explicit flexure formulas (Eqs. (11a) and (11b)) have been derived to compute bending stress states along the load axis, acting on the cross-section of a graded sandwich beam. This was done by solving the integrals of the moment–curvature relationship. Again these closed-form flexure formulas for graded sandwich beams are presented in a generalized form for any given n value. Such flexure formulas can be readily used to compute the bending stress distributions in any sandwich beam with elastic modulus increasing from the surface to interior.
The dependence of bending stress distribution on the thickness ratio h2/h of a graded G/Z/G beam warrants emphasis. Detailed analysis of Figs. 5–7 reveals several interesting trends.
The most effective stress reduction appears in graded structures with small ratios of beam thickness to graded layers (i.e. h2/h < 2.5). At h2/h = 2.5, the maximum stress in a graded beam is ~17.6% lower than that of a homogeneous beam. Interestingly, reduction of maximum stress in a graded structure increases gradually to ~18.8% as the thickness ratio decreases to h2/h = 1.25 and then decreases slightly to ~18.7% as the thickness ratio further decreases to h2/h = 1. The position of the maximum stress in a graded beam shifts dramatically toward the surface for small thickness ratios (i.e. h2/h < 2.5): from ~42% of the graded layer thickness beneath the surface for h2/h = 2.5 to ~19% and 16% for h2/h = 1.25 and 1, respectively. In addition, the bending stress at the surface of the graded structure increases notably as the h2/h ratio decreases, from ~37% of the homogeneous beam at h2/h = 2.5 to ~41% and ~43% at h2/h = 1.25 and 1, respectively. A higher surface stress coupled with a maximum stress located near the surface makes the beams with small thickness ratios (h2/h ≤ 1.25) more vulnerable to surface processing and/or handling flaws [22].
For relatively large ratios of beam thickness to graded layers (i.e. h2/h > 5), reductions in maximum stresses in graded structures are less than 12% relative to their homogeneous counterparts, meaning that the stress dissipation effect becomes less significant, despite the maximum bending stresses occurring deep beneath the surface at the graded layer/uniform core interface and the surface stresses falling below 34% of that of the homogeneous beams. Considering all factors presented, to optimize the load-bearing capacity, the best beam to graded layers thickness ratio (h2/h) is 1.25–2.5.
Strengthening Y-TZP is of practical importance since Y-TZP belongs to a strong class of ceramic, and further improvements in load-bearing capacity of Y-TZP could result in a new breed of materials with superior flexural strength. We have presented a case study on the fabrication of a G/Z/G sandwich structure with controlled gradients in elastic modulus at both top and bottom surfaces using a simple glass–ceramic infiltration technique. The current nanoindentation study shows that the elastic modulus increases from the surface to the interior according to a power-law relation. Our three-point bending tests show that load to fracture in G/Z/G beams (1.2 × 4 × 25 mm3 in dimension) is approximately 28% higher than that of homogeneous Y-TZP. However, theoretical predictions (Figs. 5b and 6) show that grading hte elastic modulus in a 1.2 mm thick beam can only account for 12% of stress reduction. For reference, a 1.2 mm thick graded beam yields a beam to graded layers thickness ratio of 2h2/2h = h2/h = 0.6/0.12 = 5. Such a discrepancy can be attributed to the following reasons: (i) the glass infiltrates the surface, making the material relatively insensitive to the surface flaw status [23]; and (ii) upon glass–ceramic infiltration, the glass penetrates the multigrain junctions and grain boundaries and gradually separates the Y-TZP grains. This may lead to an increase in volume at the surfaces of the graded material and introduce localized compressive stresses at the surface [24], which can offset the maximum flexural tensile stresses. Both reduction in flaw population and the development of compressive stresses at the surface can improve the load-bearing capacity of G/Z/G in addition to strengthening contributed by the elastic gradients. Definitive studies are underway to separated out the effect of the surface flaw status and compressive stresses.
We acknowledge that the current stress analysis is based on the elastic modulus function determined from the G/Z/G system. The optimal condition of stress dissipation varies with the modulus profile. In principle, the effect of modulus functions on the stress dissipation can be evaluated analytically. However, it is a labor-intensive exercise. Currently, we are generating computer codes to search for an optimal modulus profile to further improve the load-bearing capacity of graded sandwich beams.
The current stress analysis has significant implications in designing elastically graded beams for optimization of load-bearing capacities. Regardless of the thickness and size of the beam, by tailoring the ratio of beam thickness to graded layers, a marked reduction in stress can be achieved. Our findings provide guidelines for designing load-bearing devices as small as dental crowns and bridges and as large as construction support beams.
Acknowledgments
Valuable discussions with Drs. Brian R. Lawn and Lyle E. Levine are appreciated. This investigation was supported in part by Research Grant CMMI-0758530 (PI Zhang) from the US Division of Civil, Mechanical & Manufacturing Innovation, National Science Foundation and Research Grant 1R01 DE017925 (PI Zhang) from the US National Institute of Dental & Craniofacial Research, National Institutes of Health.
Footnotes
Certain commercial equipment, instruments, or materials are identified in this paper to specify adequately the experimental procedure. Such identification does not imply recommendation or endorsement by the National Institute of Standards and Technology, nor does it imply that the materials or equipment identified are necessarily the best available for the purpose.
Publisher's Disclaimer: This is a PDF file of an unedited manuscript that has been accepted for publication. As a service to our customers we are providing this early version of the manuscript. The manuscript will undergo copyediting, typesetting, and review of the resulting proof before it is published in its final citable form. Please note that during the production process errors may be discovered which could affect the content, and all legal disclaimers that apply to the journal pertain.
References
- 1.Green DJ, Tandon R, Sglavo VM. Science. 1999;283:1295. doi: 10.1126/science.283.5406.1295. [DOI] [PubMed] [Google Scholar]
- 2.Green DJ. Journal of the American Ceramic Society. 1983;66:c178. [Google Scholar]
- 3.Balakrishnan A, Panigrahi BB, Chu M-C, Kim TN, Yoon K-J, Cho SJ. J Mater Res. 2007;22:2550. [Google Scholar]
- 4.Chu M-C, Panigrahi BB, Balakrishnan A, Cho S-J, Yoon K-J, Kim TN, Lee K-H. Materials Science and Engineering: A. 2007;452–453:110. [Google Scholar]
- 5.Suresh S. Science. 2001;292:2447. doi: 10.1126/science.1059716. [DOI] [PubMed] [Google Scholar]
- 6.Jitcharoen J, Padture NP. J Am Ceram Soc. 1998;81:2301. [Google Scholar]
- 7.Pender DC, Padture NP, Giannakopoulos AE, Suresh S. Acta Materialia. 2001;49:3255. [Google Scholar]
- 8.Suresh S, Olsson M, Giannakopoulos AE, Padture NP, Jitcharoen J. Acta Materialia. 1999;47:3915. [Google Scholar]
- 9.Koizumi M. Ceramic Trans. 1993;34:3. [Google Scholar]
- 10.Sankar BV. Composites Science and Technology. 2001;61:689. [Google Scholar]
- 11.Kapuria S, Bhattacharyya M, Kumar AN. Composite Structures. 2008;82:390. [Google Scholar]
- 12.Kashtalyan M. European Journal of Mechanics - A/Solids. 2004;23:853. [Google Scholar]
- 13.Kashtalyan M, Menshykova M. Composite Structures. 2009;87:36. [Google Scholar]
- 14.Zhang Y, Kim JW. doi: 10.1016/j.dental.2009.01.002. Dental Materials published online: Feb 1st, 2009. [DOI] [Google Scholar]
- 15.Gere JM, Timoshenko SP. Mechanics of Materials. Boston, MA: PWS Publishing; 1997. [Google Scholar]
- 16.Oliver WC, Pharr GM. Journal of Materials Research. 1992;7:1564. [Google Scholar]
- 17.Oliver WC, Pharr GM. Journal of Materials Research. 2004;19:3. [Google Scholar]
- 18.ISO International Standard, Dental Ceramics. vol. 6872: ISO, 1995.
- 19.Kassir MK. International Journal of Fracture Mechanics. 1972;8:325. [Google Scholar]
- 20.Tilbrook MT, Moon RJ, Hoffman M. Composites Science and Technology. 2005;65:201. [Google Scholar]
- 21.Parameswaran V, Shukla A. Mechanics of Materials. 1999;31:579. [Google Scholar]
- 22.Lawn BR. Fracture of Brittle Solids. Cambridge: Cambridge University Press; 1993. [Google Scholar]
- 23.Chantikul P, Lawn BR, Marshall DB, Drexhage MG. Journal of the American Ceramic Society. 1979;62:551. [Google Scholar]
- 24.Flaitz PL, Pask JA. Journal of the American Ceramic Society. 1987;70:449. [Google Scholar]


