Abstract
Pathological studies have determined that fibrillar forms of amyloid-beta protein (Aβ) comprise the characteristic neuritic plaques in Alzheimer’s disease (AD). These studies have also revealed significant inflammatory markers such as activated microglia and cytokines surrounding the plaques. Although the plaques are a hallmark of AD, they are only part of an array of Aβ aggregate morphologies observed in vivo. Interestingly, not all of these Aβ deposits provoke an inflammatory response. Since structural polymorphism is a prominent feature of Aβ aggregation both in vitro and in vivo, we sought to clarify what Aβ morphology or aggregation species induces the strongest proinflammatory response using human THP-1 monocytes as a model system. An aliquot of freshly-reconstituted Aβ(1-42) in sterile water (100 μM, pH 3.6) did not effectively stimulate the cells at a final Aβ concentration of 15 μM. However, quiescent incubation of the peptide at 4°C for 48-96 h greatly increased its ability to induce tumor necrosis factor-α (TNFα) production, which surprisingly declined upon further aggregation. Imaging of the Aβ(1-42) aggregation solutions with atomic force microscopy indicated that best cellular response coincided with the appearance of fibrillar structures yet conditions that accelerated or increased Aβ(1-42) fibril formation such as peptide concentration, temperature, or reconstitution in NaOH/PBS at pH 7.4, diminished its ability to stimulate the cells. Finally, depletion of the Aβ(1-42) solution with an antibody that recognizes fibrillar oligomers dramatically reduced the ability to induce TNFα production and size-exclusion separation of the Aβ(1-42) solution provided further characterization of an aggregated species with proinflammatory activity. The findings suggested that an intermediate stage Aβ(1-42) fibrillar precursor is optimal for inducing a proinflammatory response in THP-1 monocytes.
The Alzheimer’s disease (AD)1 brain is decorated by a wide array of polymorphic aggregated amyloid-β (Aβ) species. The parenchymal deposits exist as a range of species from dense core neuritic plaques containing fibrillar structures to wispy, loose, and granular diffuse deposits (1) yet the conditions that produce these structures in vivo are not well understood. Furthermore, these diverse Aβ morphologies do not appear to provoke the same in vivo response. For example, cytopathology, such as dystrophic neurites and inflammation, is observed surrounding the plaques (2) in the brains of human patients (3) and those in AD transgenic mouse models (4). Inflammatory markers such as activated microglia (4) stained with proinflammatory cytokines (5) are part of the environment surrounding the plaques while diffuse deposits are devoid of inflammatory cytopathology (1). A chronic inflammatory state induced by accumulated Aβ has been suggested as one of the underlying mechanisms of progressive neurodegeneration in AD (6) and may in fact exacerbate Aβ deposition (7). The plaque-associated activated microglia do not efficiently clear the deposits (4) unless further stimulated by infusion of anti-Aβ antibodies (8).
In vitro aggregation studies of Aβ have been very useful for understanding fibrillogenesis mechanisms and the structural properties of monomers, soluble intermediates, and mature fibrils. These studies have identified a continuum of Aβ species in the assembly process which vary in their size, length, solubility, and morphology (9-13). Monomeric, oligomeric, protofibrillar, fibrillar, and amorphous species possess distinct toxic and biological activities and potencies (14-18).
The in vivo inflammatory response to Aβ has been recapitulated in numerous in vitro cell model systems including both microglial and monocytic cells (19-21). Several receptors have been shown to mediate Aβ-stimulated proinflammatory cytokine production including the receptor for advanced glycation end products (RAGE) (22), a multireceptor complex comprising the scavenger receptor class B (SR-B) receptor CD36, α6β1-integrin, and CD47 (23), and Toll-like receptors (TLR) 2 and 4 (24-26). Furthermore, the SR-A receptor has been shown to mediate Aβ-induced production of reactive oxygen species (27). In all of these studies, induction of an inflammatory response appeared to favor a fibrillar Aβ conformation although different assembly states were not always investigated. Since activated microglial cells are typically observed clustered around the dense core plaques as opposed to the diffuse Aβ deposits (1), their activation appears to be selective for a particular Aβ morphology. We have previously reported that aggregated Aβ(1-42) induces TNFα production from a human monocytic cell line via TLRs (24). Here we further explore the optimal Aβ aggregation state for this process.
Materials and Methods
Cell Culture
THP-1 cells were obtained from ATCC (Manassas, VA) and maintained in RPMI-1640 culture medium (HyClone, Logan, UT) containing 2 mM L-glutamine, 25 mM HEPES, 1.5 g/L sodium bicarbonate, 10% fetal bovine serum (FBS) (HyClone), 50 U/ml penicillin, 50 μg/ml streptomycin (HyClone), and 50 μM β-mercaptoethanol at 37°C in 5% CO2. For cellular assays, THP-1 monocytes were centrifuged, washed, and resuspended in reduced FBS (2%) growth medium. Cells were added to individual wells of a 48-well or 96-well sterile culture plate at a final concentration of 8.5 × 10⁵ cells/ml prior to treatment with 15 μM Aβ and/or sterile water control. In some experiments, polymyxin B sulfate (Sigma, St. Louis, MO) was included to verify the proinflammatory signal was not due to lipopolysaccharide (LPS) contamination. Following incubation of the cells at 37°C for 6-24 h, the content of each well was removed, centrifuged at 2500g for 10 min, and the supernatant was frozen at -20°C for subsequent analysis.
Preparation of Aβ Peptides
Aβ(1-42) peptides (rPeptide, Bogarth, GA) were dissolved in 100% hexafluoroisopropanol (HFIP) (Sigma) for 1 h, aliquotted into sterile microcentrifuge tubes, dried in a vacuum centrifuge, and stored at -20°C. For experiments, the lyophilized peptides were resuspended in sterile water or treated with 100 mM NaOH at 2 mM Aβ and diluted into phosphate-buffered saline (PBS, HyClone, 6.7 mM phosphate, 150 mM NaCl). Final Aβ concentrations were 100 μM and the solutions were incubated at 4°C unless otherwise stated. THP-1 monocytes were exposed to a final concentration of 15 μM Aβ(1-42). Commercial Aβ lots were endotoxin-tested by several methods as previously described (24). Centrifugation of Aβ solutions was done on either a Beckman-Coulter Microfuge® 18 at 18,000g for 10 min in a 4°C cold room, a Sorvall RC5B refrigerated centrifuge with SS-34 rotor at 50,000g for 1 h at 4°C, or a refrigerated Beckman-Coulter Optima Max ultracentrifuge with TLA120.1 rotor at 50,000g to 150,000g for 1 h at 4°C. Some centrifugation experiments utilized 0.2 μm polytetrafluoroethylene (PTFE) spin filters (Millipore, Billerica, MA) at 12,000g for 3 min to separate small aliquots (~100 μl) of Aβ aggregation solutions. Further separation was done with size exclusion chromatography (SEC). SEC columns were sanitized with 0.5 M NaOH and pretreated with 1 mg bovine serum albumin (BSA) in running buffer to block non specific binding to the resin. 18,000g Aβ(1-42) supernatants were eluted on a Superdex 75 HR 10/30 column (GE Healthcare) in 50 mM Tris-HCl (pH 8.0) at 0.5 ml/min. Collection of fractions (0.5 ml) was initiated after 2 ml of elution volume. Aβ(1-42) concentrations from SEC were determined by absorbance using an extinction coefficient of 1450 cm-1 M-1 as previously described (28). In some cases, Aβ concentrations were determined by the Bradford method (29). Some Aβ aggregation solutions were monitored by thioflavin T (ThT) fluorescence as described previously (30). Briefly, Aβ aliquots were removed and diluted 5-fold (20 μM) into a 5 μM ThT solution prepared in the same solution used for Aβ(1-42) reconstitution (water or PBS). In some cases, Aβ(1-42) reconstituted and aggregated in water was monitored with 5 μM ThT in 50 mM Tris-HCl pH 8.0. ThT fluorescence emission scans (460-520 nm) were acquired on a Cary Eclipse fluorescence spectrophotometer using an excitation wavelength of 450 nm and integrated from 470-500 nm to produce ThT fluorescence values. When necessary, pH was determined in Aβ solutions using a small volume microelectrode (Thermo Scientific Orion).
Determination of TNFα Levels
Measurement of secreted TNFα in the supernatants was determined by ELISA. Briefly, 100 μl of 2-4 μg/ml monoclonal anti-human TNFα/TNFSF1A capture antibody (R&D Systems, Minneapolis, MN) was added to 96-well plates for overnight incubation at room temperature. Wells were washed with PBS (HyClone) containing 0.05% Tween-20 and blocked with 300 μl PBS containing 1% BSA, 5% Sucrose and 0.05% NaN3 for 1 h at room temperature. After washing, successive treatments with washing in between were done with 50 μl samples or standards for 2 h, 100 μl biotinylated polyclonal anti-human TNFα/TNFSF1A detection antibody (R&D Systems) in 20mM Tris with 150 mM NaCl and 0.1% BSA for 2 h, 100 μL streptavidin-horseradish peroxidase (HRP) (R&D Systems) diluted 200 times with PBS containing 1% BSA for 20 min, and 100 μl of equal volumes of 3,3′,5,5′-tetramethylbenzidine and hydrogen peroxide (KPL, Gaithersburg, MD) for 30 min. The reaction was stopped by the addition of 1% H2SO4 solution. The optical density of each sample was analyzed at 450nm with a reference reading at 630nm using a SpectraMax 340 absorbance plate reader (Molecular Devices, Union City, CA). A standard curve was constructed by sequential dilution of a TNFα standard from 2000-15 pg/ml. The concentration of TNFα in the experimental samples was calculated from a TNFα standard curve of 15-2000 pg/ml. When necessary, samples were diluted to fall within the standard curve.
Dynamic Light Scattering (DLS)
Hydrodynamic radius (RH) measurements were made at room temperature with a DynaPro Titan instrument (Wyatt Technology, Santa Barbara, CA). Samples (30 μl) were placed directly into a quartz cuvette and light scattering intensity was collected at a 90° angle using a 10-second acquisition time. Particle diffusion coefficients were calculated from auto-correlated light intensity data and converted to RH with the Stokes-Einstein equation. Data regularization with Dynamics software (version 6.7.1) generated histograms of percent mass vs. RH. Intensity-weighted mean RH values were derived from the regularized histograms.
Atomic Force Microscopy (AFM)
Aβ(1-42) aggregation solutions (100 μM) were diluted to 1 μM in water. Grade V1 mica (Ted Pella, Inc, Redding, CA) was cut into 11 mm circles and affixed to 12 mm metal discs. Aliquots (50 μl) were applied to freshly cleaved mica, allowed to adsorb for 15 min, washed twice with water, air dried, and stored in a container with desiccant. For imaging of Aβ(1-42) aggregates that were SEC-separated in 50 mM Tris-HCl, mica surfaces were pre-treated with 1% 3-aminopropyl triethoxysilane (APTES) in 1 mM acetic acid for 10 min, washed with water, and air-dried prior to application of sample. Images were obtained with a Nanoscope III multimode atomic force microscope (Digital Instruments, Santa Barbara, CA) in TappingMode™. Height analysis was performed using Nanoscope III software on flattened height mode images.
Transmission Electron Microscopy
Aβ aggregation solutions were diluted to 20 μmol/L in water and 10 μl was applied to a 200-mesh formvar-coated copper grid (Ted Pella, Inc.). Samples were allowed to adsorb for 10 min at 25°C, followed by removal of excess sample solution with a tissue wipe. Grids were washed three times by placing sample side down on a droplet of water. Heavy metal staining of the samples was done in a similar manner by incubation on a droplet of 2% uranyl acetate (Electron Microscopy Sciences, Hatfield, PA) for 5 min, removal of excess solution, and air drying. Affixed samples were visualized with a JEOL JEM-2000 FX transmission electron microscope operated at 200k eV.
OC Immunodepletion of Aβ(1-42) Solutions
Fibrillar oligomers were immunoprecipitated (IP) by addition of OC antisera (2 μl, 1:300 dilution) (gift from Dr. Rakez Kayed, University of Texas Medical Branch) directly to Aβ aggregation solutions (60 μl, 100 μM) and incubation without agitation for 1 h at 4°C. Protein G-sepharose beads (10 μl) (Sigma) were then added to the solution and incubated with slow mixing for an additional 1 h at 4°C. The solution was centrifuged for 15 min at 18,000g and the supernatant (45 μl) was used to treat THP-1 monocytes.
Dot Blot Analysis
All steps in the dot blot assay were done at 25°C and were modified from (31). Briefly, 5 μl Aβ(1-42) was applied to moist nitrocellulose, allowed to stand for 20 min,and then blocked with 10% milk in PBS-0.2% Tween 20 (PBST). Following a wash step with PBST, the membrane was incubated with OC serum (1:5000) or Ab9 antibody (1:5000) (gift from Dr. Terrone Rosenberry, Mayo Clinic Jacksonville) for 1 h with gentle shaking, washed, and incubated with a 1:1000 dilution of an anti-rabbit IgG (OC) or anti-mouse IgG (Ab9) HRP conjugate (R&D Systems) for 1 h. After washing, the nitrocellulose membrane was then incubated with ECL substrate and exposed to film.
XTT Cell Viability Assay
Cell viability was monitored using an XTT (2, 3-bis (2-methoxy-4-nitro-5-sulfophenyl)-2H-tetrazolium-5-carboxanilide) cell assay (32). Cell metabolic activity was probed by mitochondrial-mediated reduction of XTT (Sigma). Briefly, control cells and cells exposed to Aβ for a given period of time were further incubated with final concentrations of 0.33 mg/mL XTT and 8.3 μM phenazine methosulfate (PMS) (Acros, Morris Plains, NJ) for 3 h at 37°C. The extent of XTT reduction was determined by absorbance measurements of the reduced form of XTT at 467 nm.
Results
Aβ(1-42)-induced TNFα production is dependent on aggregation state
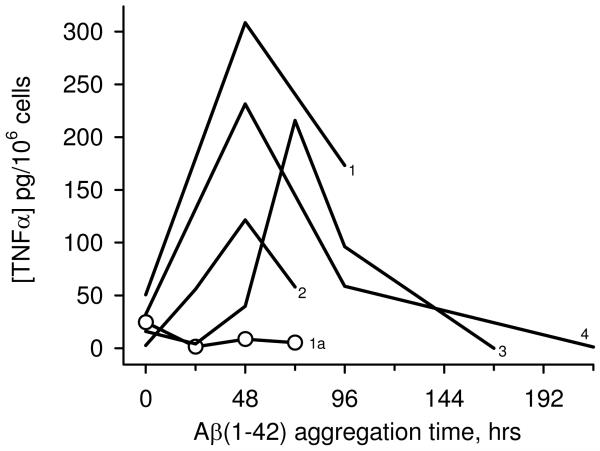
TNFα, a key product of the proinflammatory response, is measurably increased in post-mortem AD brain sections (5) and microvessels (33), and cerebrospinal fluid (34) of clinically diagnosed AD patients. The THP-1 human monocytic cell line is an excellent model system for inflammatory studies, exhibits responses to stimuli similar to those of microglia, and are a particularly valuable system for studying cell activation and cytokine production by Aβ (19-21). In order to gain further information on the most favorable aggregation state of Aβ for inducing TNFα production, freshly reconstituted solutions of Aβ(1-42) (100 μM) were aged at 4°C and periodically tested for their ability to stimulate TNFα production from THP-1 monocytes. Figure 1 shows that immediately upon reconstitution Aβ(1-42) induced a varying but relatively small amount of TNFα. Aging of the peptide for 48-72 h caused a dramatic increase in TNFα production (Fig 1, lines 1-4). Surprisingly, further aging reduced, and ultimately abolished, the proinflammatory response (Fig 1, lines 3, 4). The results from multiple experiments suggested that an intermediate Aβ(1-42) aggregation structure may be preferred for inducing TNFα production in THP-1 monocytes. Furthermore, the data demonstrated that continued aggregation from that point diminished the response.
Figure 1.
Dependence of the Aβ (1-42)-induced proinflammatory response on aggregation progression. Aβ(1-42) was reconstituted in sterile water (100 μM) and incubated at 4°C. At various time points, aliquots were removed and incubated with THP-1 monocytes for 6 h at a final Aβ(1-42) concentration of 15 μM. Secreted TNFα was measured in cell supernatants by ELISA. Lines 1-4 represent separate 100 μM Aβ(1-42) aggregation experiments. Line 1a (open circles) represents a 1.2 mM Aβ(1-42) aggregation solution incubated at 25°C prepared and tested within the same experiment as Line 1.
The idea that later-stage Aβ(1-42) aggregation species were not effective inducers of TNFα production was tested further by modulating Aβ(1-42) aggregation kinetics. The initial peptide concentration was increased 12-fold thereby accelerating aggregation. Aβ assembly occurs via a nucleation-dependent polymerization process (35). One of the tenets of this type of kinetics is that increased peptide concentration can significantly shorten the lag time for nucleation which is then followed by rapid polymerization and fibril formation. In addition to increased peptide concentration, elevated temperature also accelerates Aβ aggregation (11). The more concentrated solution of Aβ(1-42) (1.2 mM) was incubated at 25°C and aliquots were added to THP-1 monocytes while maintaining the same final concentration (15 μM) as that used for the 100 μM solutions. Although a small level of TNFα was induced at 0 h, the remaining Aβ(1-42) aggregation age time points had no stimulatory activity (Fig 1, circles).
An intermediate aggregation state correlates with proinflammatory activity
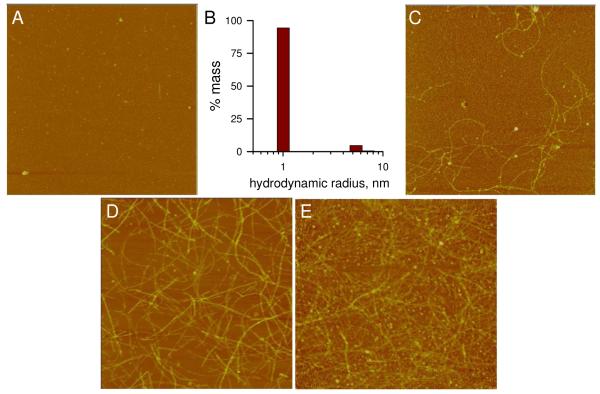
AFM analysis of an Aβ(1-42) aggregation time course was done to visualize morphologies that corresponded to periods of TNFα production shown in Figure 1. Upon reconstitution of Aβ(1-42) in sterile water, images primarily showed a dense field of small punctate species with heights of <2 nm as reported previously (24)(Fig 2A). Dynamic light scattering analysis of the freshly reconstituted Aβ(1-42) showed a predominant peak (95% mass) with an RH of 1.0 nm representing monomeric Aβ and a small population (5% mass) of oligomeric species with an RH of 5.7 nm (Fig 2B). Incubation of the Aβ(1-42) solution at 4°C produced fibrillar structures by 48 h (Fig 2C). The 48 h image in Fig 2C is representative of the intermediate Aβ(1-42) aggregation state that typically stimulated maximal TNFα production (see Fig 1). Height analysis of the 48 h fibrils produced a mean height and standard deviation (SD) of 4.2 +/- 1.4 nm with lengths ranging from 1-3 μm. We have described these features previously in the context of Toll-like receptor activation (24). The fibril height values did not change significantly after 216 h of incubation (4.5 +/- 1.4 nm) (Fig 2D) and lengths were only slightly greater. The most notable change was in the density of fibrils (fibrils/μm2) which increased from approximately 1 fibril/μm2 at 48 h of incubation to 6 fibrils/μm2 by 216 h. ThT fluorescence measurements of the Aβ(1-42) solution indicated no fluorescence at 0 h although longer incubation time gradually increased the fluorescence (Fig 5, circles). A more concentrated Aβ(1-42) solution (1.2 mM) showed accelerated aggregation and fibril production after 24 h at 25°C (Fig 2E). This accelerated aggregation was also reflected in ThT fluorescence levels which were 10-20 times higher in the 1.2 mM solutions than in the 100 μM solutions (data not shown). Treatment of the THP-1 monocytes with the more concentrated sample in Fig 2E at a final Aβ(1-42) concentration of 15 μM did not induce TNFα production (data not shown) consistent with the results shown in Fig 1.
Figure 2.
Morphological changes during Aβ-(1-42) aggregation time course. An Aβ(1-42) aggregation solution (100 μM) was prepared as described in Figure 1 and incubated at 4°C. Aliquots were removed, diluted to 1 μM in water, and imaged by AFM at 0 h (A), 48 h (C), and 216 h (D). DLS measurements were obtained of the 0 h solution as described in the Methods and a histogram of % mass vs. RH is shown in Panel B. A separate 1.2 mM Aβ(1-42) solution was prepared and imaged at 24 h (D). All AFM images are 5 μm × 5 μm and shown in “height” mode.
Figure 5.
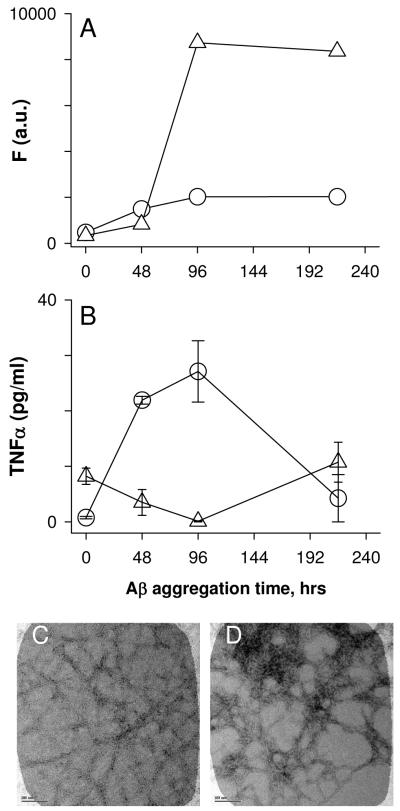
Ionic strength and pH influences Aβ-(1-42) proinflammatory activity. Two lyophylized Aβ(1-42) aliquots were reconstituted in either sterile water (circles) or 100 mM NaOH followed by 20-fold dilution into sterile phosphate-buffered saline (PBS) (triangles) at a concentration of 100 μM. Both solutions were incubated at 4°C. ThT-fluorescence was measured at different time points as described in the Methods (Panel A). For the same time points, THP-1 cells were treated with 15 μM Aβ(1-42) from each solution and secreted TNFα was measured in cell supernatants as in Figure 1 (Panel B). Error bars represent the standard error for n=3 trials. Panels C and D. Aliquots were removed from each sample at 96 h and imaged by TEM as described. Images are of Aβ(1-42) reconstituted in water (Panel C) or NaOH/PBS (Panel D). Scale bars represent 100 nm.
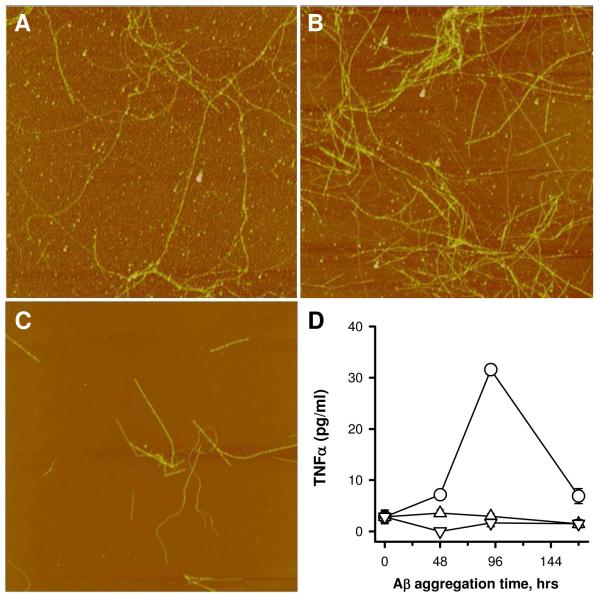
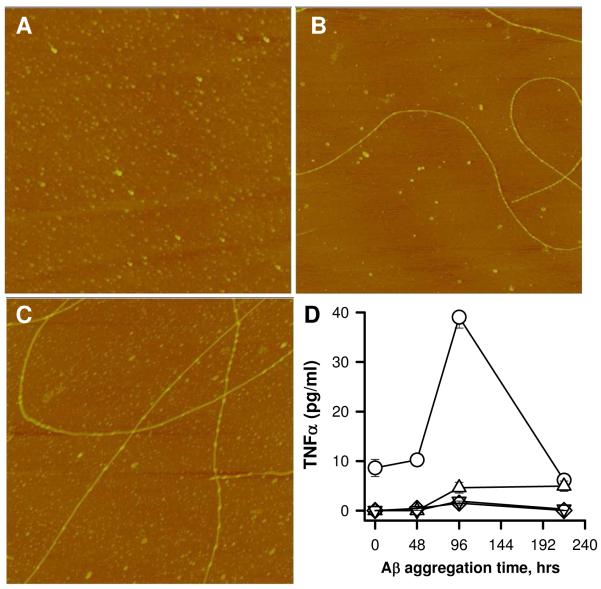
The aggregation rate of the 100 μM Aβ(1-42) solution was accelerated by incubation at higher temperatures. Three solutions of 100 μM Aβ(1-42) were prepared and incubated at 4°C, 25°C, or 37°C. Incubation at higher temperatures significantly decreased the ability of the solution to induce TNFα production. AFM images showed differences in the extent of aggregation at 96 h (Fig 3A-C) yet only the sample incubated at 4°C stimulated TNFα production in THP-1 monocytes (Fig 3D). As in Figure 2, the AFM image of the Aβ(1-42) sample incubated at 4°C contained long flexible fibril structures with a mean height of 5.5 +/- 1.6 nm (SD) along with numerous globular species. The Aβ(1-42) sample at 25°C showed a greater number of fibril structures and also greater dispersity in measured fibril heights (6.9 +/- 2.1 nm). The Aβ(1-42) sample at 37°C was very different by AFM imaging. Although the fibril heights were similar (6.1 +/- 1.6 nm), a lower amount of total Aβ(1-42) species was evident in the image, possibly due to decreased adsorption of the Aβ(1-42) fibrils formed at 37°C to the mica surface. Furthermore, the smaller globular species were no longer observed. Separate experiments measuring ThT fluorescence found much higher levels for Aβ(1-42) incubated at 37°C (470 arbitrary units) compared to incubation at 25°C (80 units) or 4°C (40 units) (data not shown). Aβ(1-42) samples were taken from the three solutions depicted in Figures 3A-C and tested for induction of THP-1 monocyte TNFα production. The dependence of TNFα production on Aβ(1-42) aggregation state for the sample incubated at 4°C (Fig 3D, circles) showed the same profile as in Figure 1, while Aβ(1-42) solutions incubated at higher temperatures were ineffective at inducing an inflammatory response. The cumulative data demonstrated that Aβ(1-42)-induced TNFα production correlated with initial formation of an intermediate fibrillar species yet continued, accelerated, or increased fibril formation abolished the ability of Aβ(1-42) to stimulate the monocyte response.
Figure 3.
Increased incubation temperature accelerates Aβ(1-42) aggregation and reduces its ability to induce a proinflammatory response. A solution of Aβ(1-42) (100 μM) was separated into three tubes and each tube was incubated at different temperatures. At various times, aliquots were removed for both AFM imaging and treatment of the THP-1 monocytes as described in the Methods. Panels A-C. AFM images (5 μm × 5 μm) were obtained as described in Figure 2 from each Aβ(1-42) solution at 96 h prior to cell treatment. Images shown are representative of the solutions incubated at 4°C (A), 25°C (B), and 37°C (C). Panel D. Secreted TNFα levels (SE, n=3 measurements) were determined at each time point for Aβ(1-42) solutions incubated at 4°C (circles), 25°C (triangles), and 37°C (inverted triangles).
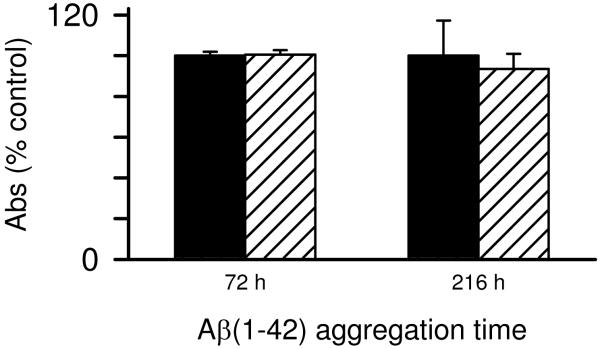
Two possible explanations for the loss of Aβ(1-42) proinflammatory activity at the later stages of fibril formation was solubility (fibril precipitation) and/or fibril toxicity to the monocytes particularly at later stages when significant numbers of fibrils are present. The first possibility was explored and it was observed that many of the late stage fibrillar species formed in water remained in solution after centrifugation of the sample at 18,000g for 10 min based on AFM images pre- and post-centrifugation (data not shown) This result indicated the fibrils were not easily precipitating out of solution. The toxicity of Aβ(1-42) to the monocytes at both intermediate and late aggregation stages was tested using an XTT cell viability assay. Aβ(1-42) was not toxic to the cells at two stages of aggregation as mitochondrial-mediated reduction of XTT was not affected (Fig 4).
Figure 4.
Monocyte viability is not compromised by aggregated Aβ(1-42). Aβ(1-42) solutions were prepared and incubated as in Fig. 1. At 72 h and 216 h of Aβ aggregation, THP-1 monocytes were treated with 15 μM Aβ(1-42) for 6 h. Cell viability was assessed using an XTT assay as described in the Methods. XTT reduction was determined by absorbance at 467nm for both control cells treated with sterile water vehicle (black bars) and Aβ-treated cells (hatched bars). Error bars for each condition represent standard error for n= 6 trials in 2 experiments. Absorbance values are presented as % of control cells for each experiment.
The pH of the Aβ(1-42) aqueous solutions was determined to be 3.6 using a microelectrode. Acidic pH has been shown previously to enhance single fibril formation (11). We hypothesized that Aβ(1-42) at higher ionic strength and buffered at neutral pH may form structures with different proinflammatory-stimulating activity. Aβ(1-42) was either reconstituted in water or treated with 100 mM NaOH followed by dilution into PBS. Both solutions were prepared at a final Aβ concentration of 100 μM and incubated at 4°C. The Aβ(1-42)/PBS solution (pH 7.4) achieved a higher degree of aggregation based on ThT fluorescence measurements compared to the Aβ(1-42)/water solution (Fig 5A) yet Aβ(1-42) incubated in PBS did not stimulate TNFα production to the same extent as Aβ(1-42) incubated in water (Fig 5B). Initially, the Aβ(1-42)/water solutions were monitored by ThT prepared in water which maintained the acidic pH. This method resulted in very low ThT fluorescence (data not shown) and did not accurately reflect the extent of Aβ(1-42) aggregation. Analysis of the (1-42)/water solutions with ThT prepared in Tris-HCl pH 8.0 (Fig 5A, circles) or glycine pH 8.0 (data not shown) produced similar ThT fluorescence values that were both significantly higher than when ThT fluorescence was measured in acidic conditions. Microscopy was utilized to discern morphological differences between Aβ(1-42) incubated in water or PBS. Difficulty was encountered in attempting to adsorb Aβ(1-42) aggregates formed in PBS to mica grids for AFM, therefore TEM was used for morphological evaluation of the two Aβ(1-42) solutions. TEM images obtained of each sample showed that both preparations contained significant fibrillar material. Compared to the Aβ(1-42)/water solution, the Aβ(1-42)/PBS solution possessed more laterally associated fibrils (Fig 5C, D) and a greater number of fibrils when lower magnification was used to observe a larger field (data not shown).
Aβ(1-40) does not have the same proinflammatory activity as Aβ(1-42) under similar aggregation conditions
The data to this point indicated that Aβ(1-42) incubated in water at 4°C formed a species that acted as a proinflammatory stimulus. It was of interest to determine if Aβ(1-40) could form the same species under similar conditions. Solutions of Aβ(1-42) and Aβ(1-40) (100 μM in water) were prepared. The Aβ(1-42) solution was incubated at 4°C while the Aβ(1-40) solution was incubated at three temperatures (4°C, 25°C, or 37°C). AFM imaging indicated that even at 4°C Aβ(1-40) did form fibrils (Fig 6A-C) albeit at a much slower rate compared to Aβ(1-42). The Aβ(1-40) fibrils were much longer (> 5 μm) than those formed by Aβ(1-42) and their measured heights were slightly greater. Aβ(1-40) fibrils presented in Fig 6B and 6C had average heights of 5.9 +/- 1.7 nm (SD) with very little change in the fibril morphology from 96 to 216 h. Concurrent treatment of THP-1 monocytes with aliquots from the Aβ solutions revealed that, under these conditions, only Aβ(1-42) effectively stimulated TNFα production (Fig 6D). Incubation of Aβ(1-40) at increased temperature produced more numerous fibrils as observed by AFM (data not shown), yet did not produce a proinflammatory Aβ species.
Figure 6.
Aβ(1-40) is not as effective as Aβ(1-42) at inducing a proinflammatory response. Aβ(1-42) and Aβ(1-40) were reconstituted in sterile water at the same concentration (100 μM). Aβ(1-42) was incubated at 4°C (circles) while Aβ(1-40) was incubated at multiple temperatures. Aliquots were removed for both AFM imaging and incubation with THP-1 monocytes. Panels A-C. AFM images (5 μm × 5 μm) of Aβ(1-40) incubated at 4°C are shown for 0 (Panel A), 96 (Panel B), and 216 (Panel C) h. Panels D. TNFα production was measured as described and is plotted for Aβ(1-42) incubated at 4°C (circles) and Aβ(1-40) incubated at either 4°C (triangles), 25°C (inverted triangles), or 37°C (diamonds).
The proflammatory Aβ(1-42) species formed in water is soluble and can be recognized by an antibody specific for fibrillar oligomers
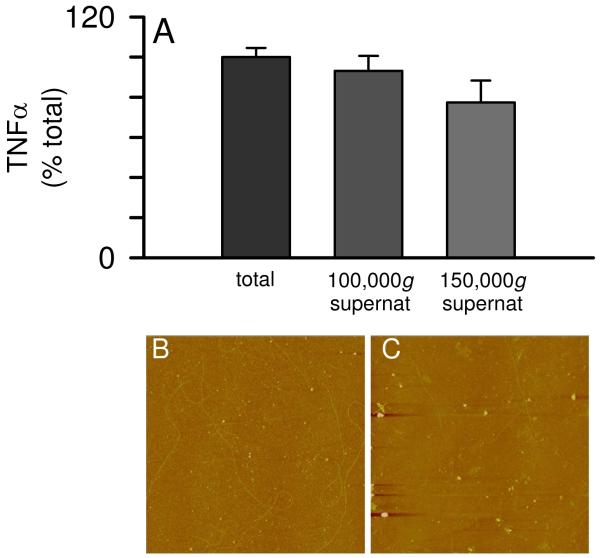
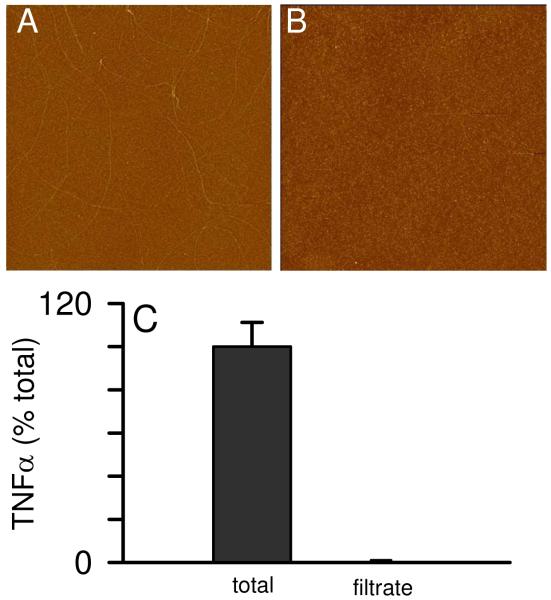
The data in Figure 1 demonstrated that, upon Aβ(1-42) reconstitution in sterile water, a period of incubation is necessary before an aggregated species conducive for inducing TNFα secretion from THP-1 monocytes is formed. The fact that continued aggregation diminished proinflammatory activity indicated that an intermediate Aβ(1-42) species was optimal. In order to better characterize this species, we subjected an Aβ(1-42) solution incubated for 72 h at 4°C to centrifugation of speeds up to 150,000g for 1 h at 4°C. This treatment failed to significantly suppress the ability of the supernatant to induce TNFα production (Fig 7A) yet was effective at removing many of the Aβ(1-42) fibrils from solution at 150,000g (Fig 7B, C). Centrifugal filter units with a 0.2 μm PTFE membrane were used to separate fibrillar material from Aβ(1-42) aggregation solutions. This was effectively done as the filtrate was devoid of fibrils (Fig 8B). Concentration measurements of the Aβ(1-42) solution pre- and post-filtering determined the filters removed 65% of the Aβ concentration with 35% remaining in the filtrate (data not shown). Separate control filtering experiments with monomeric Aβ indicated only a small loss (~10%) due to non-specific adsorption. Monocyte activation experiments comparing the total solution with the filtrate showed that 0.2 μm filtering of the Aβ(1-42) solution completely abolished the ability of Aβ(1-42) to induce proinflammatory activity (Fig 8C). It has been previously reported that Aβ(1-40) protofibrils will pass through a 0.2 μm filter (36) although in these studies no protofibrillar material was observed in the filtrate (Fig 8B).
Figure 7.
Solubility of the proinflammatory Aβ(1-42) species. Aβ(1-42) was reconstituted in sterile water (100 μM) and incubated at 4°C for 72 h. Separate aliquots of the same Aβ(1-42) solution was subjected to centrifugation for 1 h at 4°C at 100,000g and 150,000g. Equal volumes of the supernatants and the pre-centrifuge sample (total) were incubated with THP-1 monocytes for 24 h and secreted TNFα was measured as in Figure 1. AFM images (5 μm × 5 μm) were obtained for the pre-centrifuged total (Panel B) and the 150,000g supernatant (Panel C).
Figure 8.
Filtering of Aβ(1-42) aggregation solution removes proinflammatory ability. Aβ(1-42) was reconstituted in sterile water (100 μM) and incubated at 4°C for 72 or 96 h. An aliquot from the solution was applied to a 0.2 μm PTFE centrifugal filter unit and centrifuged for 3 min at 12,000g at 4°C. AFM images (5 μm × 5 μm) were obtained for the pre-filter total (Panel A) and the filtrate (Panel B). Equal volumes of the pre-filter sample (total) and the filtrate were incubated with THP-1 monocytes for 6 h and secreted TNFα was measured as in Fig 1. TNFα is represented as a percentage of the TNFα induced by pre-filter sample. Secreted TNFα averaged 92 pg/ml in two experiments. Error bars represent the std error for n=6 measurements over two experiments.
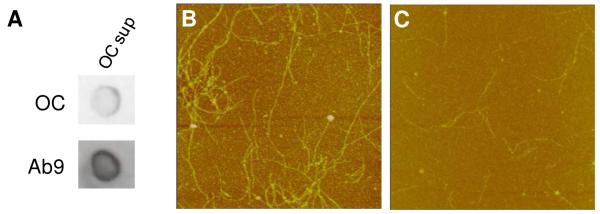
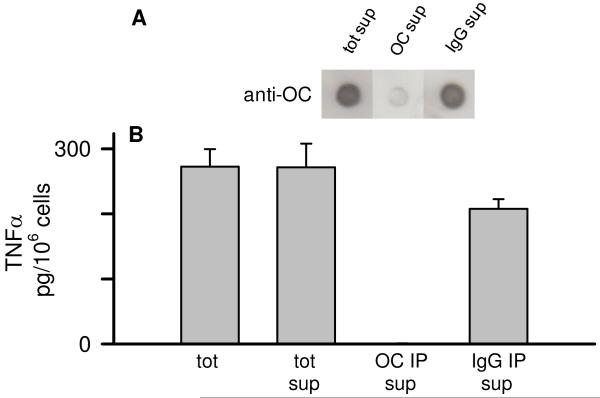
The morphology, solubility, and transient appearance of the proinflammatory Aβ(1-42) species suggested similarities to protofibrils or fibrillar oligomers that have been described previously (10, 37). Fibrillar oligomers are conformationally related to fibrils but have been observed across a broad size distribution. Their size appears to overlap with prefibrillar oligomers yet the structural characteristics of the two oligomeric species are distinct. The ability to distinguish between these structural characteristics has been previously demonstrated with OC antisera, which recognizes an epitope common to fibrils and oligomeric fibrillar precursors of varying size (37). We used OC immune serum in this study to investigate whether fibrillar oligomers were involved in Aβ(1-42)-induced proinflammatory response. Aβ(1-42) solutions were immunodepleted of OC-positive species as described in the Methods and examined for remaining OC-positive material by dot blot. Although there was significant Aβ remaining in the supernatant, as detected by a sequence-specific Aβ antibody that is not dependent on conformation (Ab9), very little of it was OC-positive (Fig 9A). AFM analysis of the Aβ(1-42) supernatant after OC IP and centrifugation indicated a loss of both diffuse and fibrillar material (Fig 9B, C). Subsequent experiments looked at the ability of the OC-immunodepleted supernatants to stimulate TNFα production from THP-1 monocytes. Reprobing of the OC-immunodepleted supernatants with OC antisera again showed the amount of OC-positive Aβ(1-42) material was greatly reduced in the Aβ(1-42) solution after OC IP and centrifugation compared to just centrifugation or IP treatment with a rabbit IgG control (Fig 10A). Immunodepletion of OC-positive material in the Aβ(1-42) solution severely diminished the Aβ(1-42) proinflammatory activity compared to untreated 72 h Aβ(1-42) samples, 18,000g supernatants, or supernatants after IP with rabbit IgG and centrifugation (Fig 10B).
Figure 9.
Immunoprecipitation with OC antisera depletes fibrillar oligomers and fibrils from an Aβ(1-42) solution. Aβ(1-42) was reconstituted in sterile water (100 μM) and stored at 4°C for 72 h. The Aβ(1-42) solution was immunodepleted with OC antisera as described in the Methods and the remaining supernatant was re-examined by dot blot and AFM analysis. Panel A. Dot blot analysis of the 72 h Aβ(1-42) solution supernatant probed with OC antisera and Ab9 antibody following OC IP. Panels B-C. AFM images (5 μm × 5 μm) of untreated 72 h Aβ(1-42) solution (total) and the supernatant after immunodepletion with OC antisera (OC sup).
Figure 10.
Immunodepletion with an anti-fibrillar oligomer antibody reduces the Aβ(1-42)-induced proinflammatory response. Aβ(1-42) was reconstituted in sterile water (100 μM) and stored at 4°C for 72 h. The Aβ(1-42) solution was immunodepleted with OC antisera or rabbit IgG as in Fig 9. The IP supernatants were then re-examined for OC-reactive species by dot blot analysis and also applied to THP-1 monocytes. Panel A. Dot blot probed with OC antisera of the 72 h Aβ(1-42) 18,000g centrifugation supernatant (tot sup), OC IP supernatant (OC IP sup), and rabbit IgG IP supernatant (IgG IP sup). Panel B. Equal volumes of untreated 72 h Aβ(1-42) solution (tot) and 18,000g centrifugation supernatant (tot sup), and the OC- and rabbit IgG-immunodepleted supernatant (OC IP sup and IgG IP sup) were incubated with THP-1 monocytes for 24 h and secreted TNFα was measured as in Fig 1.
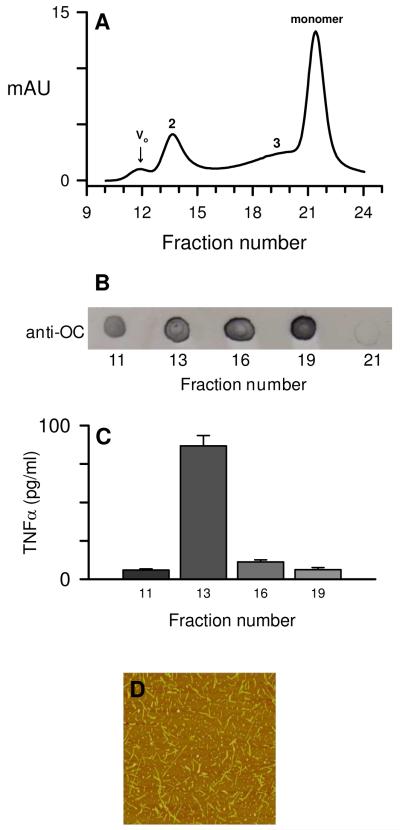
Separation techniques such as SEC allow separation of differently sized aggregates but may also suffer a preferential loss of a particular hydrophobic species due to adsorption to the column matrix or dilution-induced dissociation during column purification. OC-positive Aβ species elute across a broad size spectrum on SEC (37). To further support the ultracentrifugation studies that showed sedimentation of a significant percentage of fibrils without a concomitant loss of cellular activity, an Aβ(1-42)/water solution was incubated for 96 h at 4°C, centrifuged at 18,000g, and the supernatant was chromatographed on SEC (Fig 11A). Multiple peaks were observed by UV absorbance including elution peaks at the void volume (Vo), multiple included volumes (peaks 2 and 3), and monomer volume. Selected fractions were assessed for OC-reactivity (Fig 11B) using dot-blot analysis. OC-positive material was found in all tested peaks except for monomer. The OC-positive fractions were then tested for their ability to induce a proinflammatory response which showed that the included peak 2 induced the highest levels of secreted TNFα from THP-1 monocytes (Fig 11C). Subsequent SEC separations of Aβ(1-42) aggregated for 72-96 h were analyzed by DLS and the higher molecular weight fractions 11-14 showed an expected decrease in size (RH) from 100 nm to 10 nm as elution volume increased. The fractions with the highest proinflammatory activity corresponded to RH values between 10-30 nm and exhibited significant ThT fluorescence (data not shown). AFM images of a fraction from included peak 2 showed a significant population of short rod-like structures between 100-200 nm in length with a mean diameter (height) of 5.4 nm ± 1.6 SD for n= 116 measurements.
Figure 11.
SEC-separation of aggregated Aβ(1-42). Aβ(1-42) reconstituted in sterile water was allowed to incubate for 96 h at 4°C before centrifugation at 18,000g and separation of the supernatant on a Superdex 75 column as described in the Methods. Panel A. 280 nm absorbance elution profile of aggregated Aβ(1-42)/water solution. Tick marks for fractions (0.5 ml) represent the beginning of elution collection for each fraction tube. Aβ concentrations determined by absorbance for the peak maximums were 1.4 μM for the void volume (Vo) and 5.7 μM, 3.5 μM, and 18.3 μM for the included volumes (peak 2, 3, and monomer respectively). Panel B. Dot blot probed with OC-antisera for the fractions listed above (without dilution). Panel C. THP-1 monocytes were treated with 90 μl from the OC-positive fractions in a total volume of 300 μl for 6 h at 37°C and TNFα production was measured as in Figure 1. Panel D. AFM height mode image (3 μm × 3 μm) of a fraction from SEC-separated included peak 2 prepared without dilution.
Discussion
It has been postulated for some time that a sustained inflammatory response to aggregated Aβ may contribute to progressive neurodegeneration in AD (6). This idea emanated from pathology studies, which revealed inflammatory markers such as dystrophic neurites (2), activated microglia (3), and proinflammatory cytokines (5) surrounding Aβ lesions in the human AD brain (15). Interestingly, even though a vast array of Aβ aggregate morphologies ranging from dense core neuritic plaques to granular diffuse wispy Aβ deposits are observed in the AD brain, only the plaques appear to provoke this particular inflammatory response (1). A recent report by Meyer-Luehmann et al highlighted this phenomenon whereupon rapid plaque formation, and an equally rapid microglial response, was observed in an AD transgenic mouse model (4). Microglia were observed surrounding only the dense core plaques as opposed to the diffuse Aβ deposits.
THP-1 human monocytes have been used extensively to investigate the Aβ-induced proinflammatory response and display a similar pattern of activation to that of microglial cells (19-21). Many of the monocyte/macrophage and microglial studies have utilized preformed fibrillar Aβ and some of those studies included costimulators such as interferon-γ (38) or lipopolysaccharide (39) along with the Aβ treatment. In this study we correlated the time-dependent aggregation of Aβ with the ability to induce TNFα secretion from human THP-1 monocytes. We observed that an intermediate Aβ(1-42) species formed in acidic (pH 3.6-4) aqueous conditions was optimal for stimulating the response. While the peak cellular response coincided with the appearance of Aβ(1-42) fibrils, the cell response did not correlate with fibrillar species based on the observation that increased production of Aβ(1-42) fibrils, Aβ(1-40) fibrils, and Aβ(1-42) fibrils formed in PBS at neutral pH were not effective inducers of TNFα secretion. This observation in combination with the OC-immunodepletion studies and SEC-separation in Figures 10 and 11 respectively suggested that small fibrillar precursors were transient species that rapidly progressed to fibrils upon their formation. The neutral pH and increased ionic strength conditions in PBS accelerated Aβ(1-42) fibril formation but reduced the peptide’s ability to stimulate a proinflammatory response. There is some physiological support for Aβ(1-42) aggregates formed in acidic conditions. Although much of the attention is focused on the extracellular neuritic Aβ plaques, a significant amount of research now indicates that Aβ(1-42) aggregates may also form intracellularly in an acidic endosomal environment (40). These aggregates, if secreted, may form the structural basis for fibrils that are recognized by phagocytic cells and optimally induce proinflammatory events.
Significant structural polymorphism within Aβ fibrils at the molecular level has been demonstrated in vitro. Solid state NMR measurements revealed that Aβ(1-42), (1-40), and (10-35) fibrils contained in-register, parallel β-sheets (41, 42), while fibrils formed by the shorter peptides Aβ(16-22), (34-42), and (11-25) adopted anti-parallel β-strand alignments (43-45). The scope was expanded further by the observation that pH (45) and physical aggregation conditions (46) could also alter fibril structure and neuronal toxicity (46). Our finding that pH and ionic strength could alter Aβ(1-42) fibril morphology and its proinflammatory properties was consistent with these observations.
Structural differences at the molecular level are not always obvious by imaging techniques such as AFM or EM which are able to survey dimensional and architectural properties of aggregated Aβ. Recently, conformation-specific antibodies have been used to identify structural similarities between amyloid fibrils (47) and soluble oligomers (48) formed from different proteins. These antibodies are able to recognize a particular assembly state and can distinguish structural differences between monomeric, oligomeric, and fibrillar Aβ species (37, 47). OC antisera recognizes fibrils and fibrillar oligomers, which have been described as small soluble aggregates that are conformationally related to mature fibrils (37). Prefibrillar oligomers, which are recognized by the A11 antibody, but not OC, are structurally distinct from fibrillar oligomers (37). The immunodepletion studies in this report demonstrate that selective removal of fibrillar oligomers from an Aβ(1-42) solution by OC antibodies significantly lowered the THP-1 monocyte proinflammatory response to the peptide (Fig 10). This result indicated that an aggregated Aβ(1-42) species with inherent components of fibril structure is necessary to induce TNFα secretion but smaller units of this structure induce the best response. This possibility is supported by the observation that continued, or accelerated, Aβ(1-42) aggregation diminished the monocyte response (Figs 1 and 3). Furthermore, the time course suggests that the fibrillar oligomers are transient and appear almost simultaneously with fibrils but rapidly disappear as they likely elongate to form additional fibrils. Fibrillar oligomers may be precursors to protofibrils (10-12) and have similar structural properties although further investigation will be needed in order to make a careful comparison. The inability of Aβ(1-40) to stimulate a proinflammatory response under the same conditions as Aβ(1-42) tested in this study may be due to a lower nucleation propensity which would produce a substantially lower concentration of fibrillar oligomers.
Numerous studies suggest that small Aβ(1-42) oligomers may cause early and significant alterations in synaptic function and then as fibrillar structures are formed, concomitant inflammatory responses appear (reviewed in (49)). This description of Aβ(1-42) aggregation progression towards an inflammatory species is consistent with the data in this report demonstrating that a soluble fibrillar precursor or nuclei is optimal for inducing an inflammatory response in a human monocyte cell line. Plaques consist of fibrillar Aβ at the core (50) although the complexities of plaque composition appear to be quite significant. Hyman and colleagues have characterized Aβ plaques as a reservoir of bioactive molecules and proposed that soluble Aβ species surround the plaques (4). New evidence now indicates a halo of oligomeric Aβ surrounding the plaques based on immunostaining with NAB61 antibody (51). NAB61 is able to recognize both oligomeric and fibrillar pathologic forms of Aβ but does not effectively stain diffuse Aβ (52). These studies make a case that different Aβ aggregation states exist not only throughout the brain parenchyma but even within the plaque area. Our studies in a human monocyte cell line show that soluble fibrillar Aβ(1-42) precursors are optimal for triggering an inflammatory response. These findings provide further information into the complexities of Aβ aggregation, inflammation, and the most favorable Aβ structure for interacting with cell surface receptors.
Acknowledgements
We greatly appreciate the gift of OC antisera from Dr. Rakez Kayed (University of Texas Medical Branch, George and Cynthia Mitchell Center for Neurodegenerative Diseases, Department of Neurology) and the Ab9 antibody from Dr. Terrone Rosenberry, Mayo Clinic Jacksonville). We would like to thank the Microscopy Image and Spectroscopy Technology Laboratory in the Center for Nanoscience at University of Missouri-St. Louis for technical assistance and equipment.
Footnotes
This work was supported by grants NIRG-06-27267 (MRN) from the Alzheimer’s Association, R15AG033913 (MRN) from the National Institute on Aging, and by a University of Missouri-St. Louis Dissertation Fellowship (MLDU).
- AD
- Alzheimer’s disease
- Aβ
- amyloid-β
- AFM
- atomic force microscopy
- BSA
- bovine serum albumin
- FBS
- fetal bovine serum
- HFIP
- hexafluoroisopropanol
- HRP
- horseradish peroxidase
- IP
- immunoprecipation
- LPS
- lipopolysaccharide
- PBS
- phosphate-buffered saline
- RAGE
- receptor for advanced glycation end products
- SR
- scavenger receptor
- ThT
- thioflavin T
- TLR
- Toll-like receptor
- TNFα
- tumor necrosis factor-α
- TEM
- transmission electron microscopy
References
- 1.Selkoe DJ. Cell biology of protein misfolding: The examples of Alzheimer’s and Parkinson’s diseases. Nat Cell Biol. 2004;6:1054–1061. doi: 10.1038/ncb1104-1054. [DOI] [PubMed] [Google Scholar]
- 2.Selkoe DJ. The cell biology of β-amyloid precursor protein and presenilin in Alzheimer’s disease. Trends Cell Biol. 1998;8:447–453. doi: 10.1016/s0962-8924(98)01363-4. [DOI] [PubMed] [Google Scholar]
- 3.McGeer PL, Itagaki S, Tago H, McGeer EG. Reactive microglia in patients with senile dementia of the Alzheimer type are positive for the histocompatibility glycoprotein HLA-DR. Neurosci. Lett. 1987;79:195–200. doi: 10.1016/0304-3940(87)90696-3. [DOI] [PubMed] [Google Scholar]
- 4.Meyer-Luehmann M, Spires-Jones TL, Prada C, Garcia-Alloza M, de Calignon A, Rozkalne A, Koenigsknecht-Talboo J, Holtzman DM, Bacskai BJ, Hyman BT. Rapid appearance and local toxicity of amyloid-β plaques in a mouse model of Alzheimer’s disease. Nature. 2008;451:720–724. doi: 10.1038/nature06616. [DOI] [PMC free article] [PubMed] [Google Scholar]
- 5.Dickson DW, Lee SC, Mattiace LA, Yen SHC, Brosnan C. Microglia and cytokines in neurological disease, with special reference to AIDS and Alzheimer disease. Glia. 1993;7:75–83. doi: 10.1002/glia.440070113. [DOI] [PubMed] [Google Scholar]
- 6.McGeer EG, McGeer PL. The importance of inflammatory mechanisms in Alzheimer disease. Exp. Gerontol. 1998;33:371–378. doi: 10.1016/s0531-5565(98)00013-8. [DOI] [PubMed] [Google Scholar]
- 7.Golde TE. Inflammation takes on Alzheimer disease. Nat. Med. 2002;8:936–938. doi: 10.1038/nm0902-936. [DOI] [PubMed] [Google Scholar]
- 8.Bacskai BJ, Kajdasz ST, Christie RH, Carter C, Games D, Seubert P, Schenk D, Hyman BT. Imaging of amyloid-β deposits in brains of living mice permits direct observation of clearance of plaques with immunotherapy. Nat Med. 2001;7:369–372. doi: 10.1038/85525. [DOI] [PubMed] [Google Scholar]
- 9.Harper JD, Wong SS, Lieber CM, Lansbury PT., Jr. Observation of metastable Aβ amyloid protofibrils by atomic force microscopy. Chem. Biol. 1997;4:119–125. doi: 10.1016/s1074-5521(97)90255-6. [DOI] [PubMed] [Google Scholar]
- 10.Walsh DM, Lomakin A, Benedek GB, Condron MM, Teplow DB. Amyloid β-protein fibrillogenesis: Detection of a protofibrillar intermediate. J. Biol. Chem. 1997;272:22364–22372. doi: 10.1074/jbc.272.35.22364. [DOI] [PubMed] [Google Scholar]
- 11.Harper JD, Wong SS, Lieber CM, Lansbury PT., Jr. Assembly of Aβ amyloid peptides: an in vitro model for a possible early event in Alzheimer’s disease. Biochemistry. 1999;38:8972–8980. doi: 10.1021/bi9904149. [DOI] [PubMed] [Google Scholar]
- 12.Walsh DM, Hartley DM, Kusumoto Y, Fezoui Y, Condron MM, Lomakin A, Benedek GB, Selkoe DJ, Teplow DB. Amyloid β-protein fibrillogenesis: Structure and biological activity of protofibrillar intermediates. J. Biol. Chem. 1999;274:25945–25952. doi: 10.1074/jbc.274.36.25945. [DOI] [PubMed] [Google Scholar]
- 13.Stine WBJ, Dahlgren KN, Krafft GA, LaDu MJ. In vitro characterization of conditions for amyloid-β peptide oligomerization and fibrillogenesis. J Biol Chem. 2003;278:11612–11622. doi: 10.1074/jbc.M210207200. [DOI] [PubMed] [Google Scholar]
- 14.Deshpande A, Mina E, Glabe C, Busciglio J. Different conformations of amyloid β induce neurotoxicity by distinct mechanisms in human cortical neurons. J Neurosci. 2006;26:6011–6018. doi: 10.1523/JNEUROSCI.1189-06.2006. [DOI] [PMC free article] [PubMed] [Google Scholar]
- 15.Lorenzo A, Yankner BA. β-amyloid neurotoxicity requires fibril formation and is inhibited by Congo red. Proc Natl Acad Sci USA. 1994;91:12243–12247. doi: 10.1073/pnas.91.25.12243. [DOI] [PMC free article] [PubMed] [Google Scholar]
- 16.Pike CJ, Walencewicz AJ, Glabe CG, Cotman CW. In vitro aging of β-amyloid protein causes peptide aggregation and neurotoxicity. Brain Res. 1991;563:311–314. doi: 10.1016/0006-8993(91)91553-d. [DOI] [PubMed] [Google Scholar]
- 17.Dahlgren KN, Manelli AM, Stine WB, Jr., Baker LK, Krafft GA, LaDu MJ. Oligomeric and fibrillar species of amyloid-β peptides differentially affect neuronal viability. J Biol Chem. 2002;277:32046–32053. doi: 10.1074/jbc.M201750200. [DOI] [PubMed] [Google Scholar]
- 18.Walsh DM, Klyubin I, Fadeeva JV, Cullen WK, Anwyl R, Wolfe MS, Rowan MJ, Selkoe DJ. Naturally secreted oligomers of amyloid β protein potently inhibit hippocampal long-term potentiation in vivo. Nature. 2002;416:535–539. doi: 10.1038/416535a. [DOI] [PubMed] [Google Scholar]
- 19.Klegeris A, Walker DG, McGeer PL. Interaction of Alzheimer β-amyloid peptide with the human monocytic cell line THP-1 results in a protein kinase C-dependent secretion of tumor necrosis factor-α. Brain Res. 1997;747:114–121. doi: 10.1016/s0006-8993(96)01229-2. [DOI] [PubMed] [Google Scholar]
- 20.Yates SL, Burgess LH, Kocsis-Angle J, Antal JM, Dority MD, Embury PB, Piotrkowski AM, Brunden KR. Amyloid beta and amylin fibrils induce increases in proinflammatory cytokine and chemokine production by THP-1 cells and murine microglia. J. Neurochem. 2000;74:1017–1025. doi: 10.1046/j.1471-4159.2000.0741017.x. [DOI] [PubMed] [Google Scholar]
- 21.Combs CK, Karlo JC, Kao SC, Landreth GE. β-amyloid stimulation of microglia and monocytes results in TNFα-dependent expression of inducible nitric oxide synthase and neuronal apoptosis. J. Neurosci. 2001;21:1179–1188. doi: 10.1523/JNEUROSCI.21-04-01179.2001. [DOI] [PMC free article] [PubMed] [Google Scholar]
- 22.Yan SD, Chen X, Fu J, Chen M, Zhu H, Roher A, Slattery T, Zhao L, Nagashima M, Morser J, Migheli A, Nawroth P, Stern D, Schmidt AM. RAGE and amyloid-β peptide neurotoxicity in Alzheimer’s disease. Nature. 1996;382:685–691. doi: 10.1038/382685a0. [DOI] [PubMed] [Google Scholar]
- 23.Bamberger ME, Harris ME, McDonald DR, Husemann J, Landreth GE. A cell surface receptor complex for fibrillar β-amyloid mediates microglial activation. J Neurosci. 2003;23:2665–2674. doi: 10.1523/JNEUROSCI.23-07-02665.2003. [DOI] [PMC free article] [PubMed] [Google Scholar]
- 24.Udan ML, Ajit D, Crouse NR, Nichols MR. Toll-like receptors 2 and 4 mediate Aβ(1-42) activation of the innate immune response in a human monocytic cell line. J Neurochem. 2008;104:524–533. doi: 10.1111/j.1471-4159.2007.05001.x. [DOI] [PubMed] [Google Scholar]
- 25.Fassbender K, Walter S, Kuhl S, Landmann R, Ishii K, Bertsch T, Stalder AK, Muehlhauser F, Liu Y, Ulmer AJ, Rivest S, Lentschat A, Gulbins E, Jucker M, Staufenbiel M, Brechtel K, Walter J, Multhaup G, Penke B, Adachi Y, Hartmann T, Beyreuther K. The LPS receptor (CD14) links innate immunity with Alzheimer’s disease. Faseb J. 2004;18:203–205. doi: 10.1096/fj.03-0364fje. [DOI] [PubMed] [Google Scholar]
- 26.Walter S, Letiembre M, Liu Y, Heine H, Penke B, Hao W, Bode B, Manietta N, Walter J, Schulz-Schuffer W, Fassbender K. Role of the Toll-like receptor 4 in neuroinflammation in Alzheimer’s disease. Cell Physiol Biochem. 2007;20:947–956. doi: 10.1159/000110455. [DOI] [PubMed] [Google Scholar]
- 27.El Khy J, Hickman SE, Thomas CA, Cao L, Silverstein SC, Loike JD. Scavenger receptor-mediated adhesion of microglia to β-amyloid fibrils. Nature. 1996;382:716–719. doi: 10.1038/382716a0. [DOI] [PubMed] [Google Scholar]
- 28.Nichols MR, Moss MA, Reed DK, Lin WL, Mukhopadhyay R, Hoh JH, Rosenberry TL. Growth of β-amyloid(1-40) protofibrils by monomer elongation and lateral association. Characterization of distinct products by light scattering and atomic force microscopy. Biochemistry. 2002;41:6115–6127. doi: 10.1021/bi015985r. [DOI] [PubMed] [Google Scholar]
- 29.Bradford MM. A rapid and sensitive method for the quantitation of microgram quantities of protein utilizing the principle of protein-dye binding. Anal Biochem. 1976;72:248–54. doi: 10.1016/0003-2697(76)90527-3. [DOI] [PubMed] [Google Scholar]
- 30.Nichols MR, Moss MA, Reed DK, Cratic-McDaniel S, Hoh JH, Rosenberry TL. Amyloid-β protofibrils differ from amyloid-β aggregates induced in dilute hexafluoroisopropanol in stability and morphology. J. Biol. Chem. 2005;280:2471–2480. doi: 10.1074/jbc.M410553200. [DOI] [PubMed] [Google Scholar]
- 31.Parvathy S, Rajadas J, Ryan H, Vaziri S, Anderson L, Murphy GM., Jr. Aβ peptide conformation determines uptake and interleukin-1α expression by primary microglial cells. Neurobiol Aging. 2008 doi: 10.1016/j.neurobiolaging.2008.01.011. in press. [DOI] [PubMed] [Google Scholar]
- 32.Scudiero DA, Shoemaker RH, Paull KD, Monks A, Tierney S, Nofziger TH, Currens MJ, Seniff D, Boyd MR. Evaluation of a soluble tetrazolium/formazan assay for cell growth and drug sensitivity in culture using human and other tumor cell lines. Cancer. Res. 1988;48:4827–4833. [PubMed] [Google Scholar]
- 33.Grammas P, Ovase R. Inflammatory factors are elevated in brain microvessels in Alzheimer’s disease. Neurobiol. Aging. 2001;22:837–842. doi: 10.1016/s0197-4580(01)00276-7. [DOI] [PubMed] [Google Scholar]
- 34.Tarkowski E, Andreasen N, Tarkowski A, Blennow K. Intrathecal inflammation precedes development of Alzheimer’s disease. J Neurol Neurosurg Psychiatry. 2003;74:1200–1205. doi: 10.1136/jnnp.74.9.1200. [DOI] [PMC free article] [PubMed] [Google Scholar]
- 35.Jarrett JT, Lansbury PT., Jr. Seeding “one-dimensional crystallization” of amyloid: a pathogenic mechanism in Alzheimer’s disease and scrapie? Cell. 1993;73:1055–1058. doi: 10.1016/0092-8674(93)90635-4. [DOI] [PubMed] [Google Scholar]
- 36.Lashuel HA, Grillo-Bosch D. In vitro preparation of prefibrillar intermediates of amyloid-β and α-synuclein. Methods Mol Biol. 2005;299:19–33. doi: 10.1385/1-59259-874-9:019. [DOI] [PubMed] [Google Scholar]
- 37.Kayed R, Head E, Sarsoza F, Saing T, Cotman CW, Necula M, Margol L, Wu J, Breydo L, Thompson JL, Rasool S, Gurlo T, Butler P, Glabe CG. Fibril specific, conformation dependent antibodies recognize a generic epitope common to amyloid fibrils and fibrillar oligomers that is absent in prefibrillar oligomers. Mol Neurodegener. 2007;2:18. doi: 10.1186/1750-1326-2-18. [DOI] [PMC free article] [PubMed] [Google Scholar]
- 38.Meda L, Cassatella MA, Szendrei GI, Otvos L, Jr., Baron P, Villalba M, Ferrari D, Rossi F. Activation of microglial cells by β-amyloid protein and interferon-γ. Nature. 1995;374:647–650. doi: 10.1038/374647a0. [DOI] [PubMed] [Google Scholar]
- 39.Lorton D, Kocsis JM, King L, Madden K, Brunden KR. β-amyloid induces increased release of interleukin-1β from lipopolysaccharide-activated human monocytes. J. Neuroimmunol. 1996;67:21–29. doi: 10.1016/0165-5728(96)00030-6. [DOI] [PubMed] [Google Scholar]
- 40.Laferla FM, Green KN, Oddo S. Intracellular amyloid-β in Alzheimer’s disease. Nat Rev Neurosci. 2007;8:499–509. doi: 10.1038/nrn2168. [DOI] [PubMed] [Google Scholar]
- 41.Tycko R. Insights into the amyloid folding problem from solid-state NMR. Biochemistry. 2003;42:3151–3159. doi: 10.1021/bi027378p. [DOI] [PubMed] [Google Scholar]
- 42.Burkoth TS, Benzinger TLS, Urban V, Morgan DM, Gregory DM, Thiyagarajan P, Botto RE, Meredith SC, Lynn DG. Structure of the β-amyloid(10-35) fibril. J. Am. Chem. Soc. 2000;122:7883–7889. [Google Scholar]
- 43.Balbach JJ, Ishi Y, Antzutkin ON, Leapman RD, Rizzo NW, Dyda F, Reed J, Tycko R. Amyloid fibril formation by Aβ16-22, a seven-residue fragment of the Alzheimer’s β-amyloid peptide, and structural characterization by solid state NMR. Biochemistry. 2000;39:13748–13759. doi: 10.1021/bi0011330. [DOI] [PubMed] [Google Scholar]
- 44.Lansbury PT, Jr., Costa PR, Griffiths JM, Simon EJ, Auger M, Halverson KJ, Kocisko DA, Hendsch ZS, Ashburn TT, Spencer RG, Tidor B, Griffin RG. Structural model for the β-amyloid fibril based on interstrand alignment of an antiparallel-sheet comprising a C-terminal peptide. Nat Struct Biol. 1995;2:990–998. doi: 10.1038/nsb1195-990. [DOI] [PubMed] [Google Scholar]
- 45.Petkova AT, Buntkowsky G, Dyda F, Leapman RD, Yau WM, Tycko R. Solid state NMR reveals a pH-dependent antiparallel β-sheet registry in fibrils formed by a β-amyloid peptide. J. Mol. Biol. 2004;335:247–260. doi: 10.1016/j.jmb.2003.10.044. [DOI] [PubMed] [Google Scholar]
- 46.Petkova AT, Leapman RD, Guo Z, Yau WM, Mattson MP, Tycko R. Self-propagating, molecular-level polymorphism in Alzheimer’s β-amyloid fibrils. Science. 2005;307:262–265. doi: 10.1126/science.1105850. [DOI] [PubMed] [Google Scholar]
- 47.O’Nuallain B, Wetzel R. Conformational Abs recognizing a generic amyloid fibril epitope. Proc. Natl. Acad. Sci. USA. 2002;99:1485–1490. doi: 10.1073/pnas.022662599. [DOI] [PMC free article] [PubMed] [Google Scholar]
- 48.Kayed R, Head E, Thompson JL, McIntire TM, Milton SC, Cotman CW, Glabe CG. Common structure of soluble amyloid oligomers implies common mechanism of pathogenesis. Science. 2003;300:486–489. doi: 10.1126/science.1079469. [DOI] [PubMed] [Google Scholar]
- 49.Haass C, Selkoe DJ. Soluble protein oligomers in neurodegeneration: lessons from the Alzheimer’s amyloid β-peptide. Nat Rev Mol Cell Biol. 2007;8:101–112. doi: 10.1038/nrm2101. [DOI] [PubMed] [Google Scholar]
- 50.Terry RD, Gonatas NK, Weiss M. Ultrastructural studies in Alzheimer’s presenile dementia. Am. J. Pathol. 1964;44:269–297. [PMC free article] [PubMed] [Google Scholar]
- 51.Koffie RM, Meyer-Luehmann M, Hashimoto T, Adams KW, Mielke ML, Garcia-Alloza M, Micheva KD, Smith SJ, Kim ML, Lee VM, Hyman BT, Spires-Jones TL. Oligomeric amyloid β associates with postsynaptic densities and correlates with excitatory synapse loss near senile plaques. Proc Natl Acad Sci USA. 2009;106:4012–4017. doi: 10.1073/pnas.0811698106. [DOI] [PMC free article] [PubMed] [Google Scholar]
- 52.Lee EB, Leng LZ, Zhang B, Kwong L, Trojanowski JQ, Abel T, Lee VM. Targeting amyloid-β peptide (Aβ) oligomers by passive immunization with a conformation-selective monoclonal antibody improves learning and memory in Aβ precursor protein (APP) transgenic mice. J Biol Chem. 2006;281:4292–4299. doi: 10.1074/jbc.M511018200. [DOI] [PubMed] [Google Scholar]


