

Abstract
The Group VIA-2 Ca2+-independent phospholipase A2 (GVIA-2 iPLA2) is composed of seven consecutive N-terminal ankyrin repeats, a linker region, and a C-terminal phospholipase catalytic domain. No structural information exists for this enzyme, and no information is known about the membrane binding surface. We carried out deuterium exchange experiments with the GVIA-2 iPLA2 in the presence of both phospholipid substrate and the covalent inhibitor methyl arachidonoyl fluorophosphonate and located regions in the protein that change upon lipid binding. No changes were seen in the presence of only methyl arachidonoyl fluorophosphonate. The region with the greatest change upon lipid binding was region 708–730, which showed a >70% decrease in deuteration levels at numerous time points. No decreases in exchange due to phospholipid binding were seen in the ankyrin repeat domain of the protein. To locate regions with changes in exchange on the enzyme, we constructed a computational homology model based on homologous structures. This model was validated by comparing the deuterium exchange results with the predicted structure. Our model combined with the deuterium exchange results in the presence of lipid substrate have allowed us to propose the first structural model of GVIA-2 iPLA2 as well as the interfacial lipid binding region.
The Group VIA phospholipase A2 is a member of the phospholipase A2 superfamily that cleaves fatty acids from the sn-2 position of phospholipids (1, 2). The human Group VIA PLA23 gene yields multiple splice variants, including GVIA-1, GVIA-2, GVIA-3 PLA2, GVIA Ankyrin-1, and GVIA Ankyrin-2 (3, 4). At least two isoforms, GVIA-1 and GVIA-2 iPLA2, are active. Our laboratory purified and characterized the first mammalian iPLA2, the 85-kDa GVIA-2 iPLA2 (5), which became the first cloned iPLA2 (6). This enzyme can hydrolyze the sn-2 fatty acyl bond of phospholipids and also has potent lysophospholipase and transacylase activity (7). GVIA iPLA2 is involved in cell proliferation (8), apoptosis (9–11), bone formation (12), sperm development (13), and glucose-induced insulin secretion (14, 15), so its function may vary by cell and tissue.
The human GVIA-2 iPLA2 (806 amino acids), the form of the enzyme studied here, contains seven ankyrin repeats (residues 152–382), a linker region (residues 383–474) with the eighth repeat disrupted by a 54-amino acid insert (16), and a catalytic domain (residues 475–806). The active site serine of the GVIA iPLA2 lies within a lipase consensus sequence (Gly-X-Ser519-X-Gly) (1). The activity of GVIA iPLA2 has been reported to be regulated through several mechanisms. A caspase-3 cleavage site at the N terminus of the enzyme has been identified that is clipped in vitro (17). This truncated form of the enzyme was hyperactive and reduced cell viability when overexpressed in HEK293 cells (17). Another possible control mechanism is through ATP binding on the 485GXGXXG motif (18).
The activity of phospholipases depends critically on the interaction of the protein with phospholipid membranes. In vitro, GVIA iPLA2 does not have any specificity for the fatty acid in the sn-2 position of substrate phospholipids (5). GVIA-2 iPLA2 was found to be membrane-associated when overexpressed in COS-7 cells, and this was further confirmed in rat vascular smooth muscle cells (4, 19). The other active splice variant, GVIA-1, is cytosolic and not specific in targeting membrane surfaces (4, 19), indicating two different regulatory mechanisms between these two splice variants. The 54-residue insertion in the eighth ankyrin repeat alters the property of GVIA-2 iPLA2 for membrane association. The ankyrin repeats have been reported to be involved in protein-protein interactions, such as 53BP2-p53, GA-binding protein α-GA-binding protein β, p16INK4a-CDK6, and IκBα-NFκB (16). The ankyrin repeats of GVIA iPLA2 may directly or indirectly assist membrane association because the catalytic domain by itself does not have activity (3). Determining the regions of the protein that interact with the membrane surface will allow for a more in-depth analysis of the regulatory mechanisms of the enzyme.
There is an increasing interest in GVIA iPLA2 because of its various newly discovered functions in vivo and in vitro. However, there is no published crystal or NMR structure to facilitate analysis on the molecular level. Amide hydrogen/deuterium exchange coupled with mass spectrometry (DXMS) has been widely used to analyze the interface of protein-protein interactions (20), protein conformational changes (21, 22), and protein dynamics (23), and we have now introduced it to study protein-phospholipid interactions (24, 25). There are also reports of using DXMS with homology modeling to validate enzymes where structural information does not exist (26). We used deuterium exchange along with homology modeling to generate models of the ankyrin repeats based on the Ankyrin-R (Protein Data Bank code 1N11) and of the catalytic domain based on patatin (Protein Data Bank code 1OXW). To study the interfacial activation of GVIA iPLA2, we generated 1-palmitoyl-2-arachidonoyl-sn-phosphatidylcholine (PAPC) vesicles containing the methyl arachidonyl fluorophosphonate (MAFP) inhibitor, which binds to the active site and irreversibly inhibits GVIA iPLA2 (7). By applying DXMS to the iPLA2 and using our structural model, we were now able to monitor how GVIA iPLA2 associates with phospholipid membranes.
EXPERIMENTAL PROCEDURES
Materials
D2O (99.96%) was obtained from Cambridge Isotope Laboratories. Methyl arachidonyl fluorophosphonate was from Cayman Chemical. 1-Palmitoyl-2-arachidonoyl-sn-phosphatidylcholine was from Avanti Polar Lipids. All other reagents were analytical reagent grade or better.
Protein Expression and Purification
An N-terminal His6-tagged insertion at the second residue of GVIA-2 iPLA2 and GVIA Ankyrin-1 protein were expressed using recombinant baculovirus in a suspension culture of Sf9 insect cells. The cell pellet was lysed in 25 mm Tris-HCl, pH 8.0, 100 mm NaCl, 10 mm dithiothreitol, 2 mm ATP, and 0.1% methyl-β-cyclodextrin, and then the insoluble portion was collected by centrifugation at 12,000 × g for 30 min. The cell pellet was subjected to the Dounce homogenizer 20 times and resuspended in 25 mm Tris-HCl, pH 8.0, 100 mm NaCl, 1 m urea, 10 mm β-mercaptoethanol, and 2 mm ATP. After centrifugation at 12,000 × g for 30 min, the supernatant was passed through a column comprising 6 ml of nickel-nitrilotriacetic acid-agarose (Qiagen, Valencia, CA). The protein was eluted in the “protein buffer” (25 mm Tris-HCl, pH 7.5, 50 mm NaCl, 10 mm urea, 250 mm imidazole, 2 mm ATP, and 30% glycerol). The protein concentration was measured using the Bradford assay. Purified GVIA iPLA2 (1.6 mg/ml) was stored in the protein buffer with 5 mm dithiothreitol at −80 °C.
PAPC PLA2 Activity Assay
For the basal specific activity of GVIA PLA2, assays were performed in buffer composed of 100 mm HEPES at pH 7.5, 2 mm ATP, and 5 mm dithiothreitol. The mixed micelles were composed of 0.1 mm PAPC (80,000 cpm) and 0.4 mm Triton X-100 in a final volume of 500 μl. The reaction was initiated by the addition of 1 μg of GVIA PLA2 to mixed micelles preequilibrated and incubated at 40 °C for 10 min. After incubation, the reaction was quenched, and the fatty acids were extracted using a modified Dole protocol as described previously (27).
Preparation of PAPC Small Unilamellar Vesicles
PAPC (10 mg) was dried by N2 gas and lyophilized for 1 h. The PAPC sample was then vortexed and sonicated in 1 ml of 100 mm KCl on ice to form vesicles. The solution was centrifuged at 10,000 × g for 5 min to remove the PAPC in large vesicles. Then 2 μl of GVIA iPLA2 inhibitor MAFP in methyl acetate (0.54 mm final concentration) was added to 1 ml of 10 mm PAPC vesicles.
Preparation of Deuterated Samples
Before hydrogen/deuterium exchange experiments, 1.25 μl of PAPC/MAFP vesicles was added to 23.75 μl of GVIA iPLA2 and incubated at 23 °C for 10 min. The binding of MAFP to GVIA iPLA2 was evaluated by incubating GVIA iPLA2 with 27 μm MAFP at 23 °C for 30 min. Hydrogen/deuterium exchange experiments were initiated by mixing 25 μl of GVIA iPLA2 (containing 40 μg of GVIA iPLA2) in protein buffer with 75 μl of D2O buffer to a final concentration of 71% D2O at pH 7.0. The final concentration of lipid vesicles after addition of deuterium was 125 μm. D2O buffer contained 50 mm MOPS, pH 6.9, 100 mm NaCl, 2 mm dithiothreitol, and 2 mm ATP. The samples were incubated at 23 °C for an additional 10, 30, 100, 300, 1000, 3000, or 10,000 s. The deuterium exchange was quenched by adding 100 μl of ice-cold quench solution (0.8% formic acid and 2 m guanidine hydrochloride) that acidified the sample to final pH = 2.5. The samples were then immediately frozen on dry ice. Back-exchange levels were calculated as reported previously (28). Vials with frozen samples were stored at −80 °C until analysis, which was usually within 3 days.
Proteolysis-Liquid Chromatography-Mass Spectrometry Analysis of Samples
All steps were performed at 0 °C as described previously (20). The procedure of data processing is described elsewhere (28). Because of the fast off-exchange rate of the two N-terminal residues, those residues should not retain any deuterons after liquid chromatography.
Data Analysis of Deuterium Incorporation
The rate of amide hydrogen/deuterium exchange in each pepsin-digested peptide was determined by a combination of multiple exponential associations described by the equation (29)
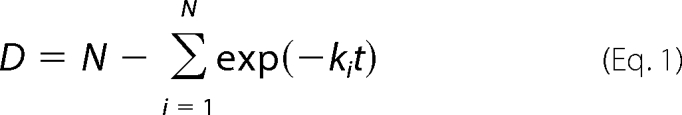 |
where D is the deuterium content, N is the amide hydrogens, and ki is the rate constant of the amide hydrogen (30). Because each amide carried its own dissociation constant, it was impossible to calculate the accurate dissociation constants for all amides in our current DXMS data. However, utilizing curve fitting to separate these amides into groups according to their rates of exchange allowed us to quantify our results (31, 32). The rates of amide hydrogens were divided into four groups: fast (K > 4.15 min−1), intermediate (4.15 > K > 0.1 min−1), slow (0.1 > K > 0.004 min−1), and non-exchangeable (K < 0.004 min−1). The selected regions shown in the figures were fit to a two- or three-phase exponential association curve in GraphPad Prism 4.0. The fast exchanging amide hydrogens have half-lives smaller than 10 s, and the non-exchangeable amide hydrogens are those whose exchange half-lives are longer than 10,000 s.
Construction of the Structural Model for GVIA iPLA2
The model of GVIA iPLA2 was initiated by an NCBI protein blast of the protein data bank (33, 34). Residues 88–474 have 51% homology to the crystal structure of human Ankyrin-R (Protein Data Bank code 1N11) (35) with an E-value of 2e−23. Residues 475–806 have 40% homology to the crystal structure of patatin, a potato lipase (Protein Data Bank code 1OXW) (36) with an E-value of 0.11. These highly homologous structures are ideal for model building. The program predictprotein (PP), which uses numerous different methods to calculate protein structure, was used to calculate the catalytic domain of GVIA iPLA2 (37). PHDsec calculation was applied to predict the secondary structure of the GVIA iPLA2.The ensemble fold recognition system-based protein prediction program Phyre generated a model of residues 88–474 and a model of the catalytic domain of GVIA iPLA2. Phyre performs structure matching based on the predicted secondary structure, modifies the backbone of the template structure, and then inserts compatible loops in the loop library. Phyre specializes in improving the remote homology annotation by false data reduction (38). The precision of the predicted structure was estimated by TM-score, an algorithm to calculate the similarity of topologies of two protein structures (39). The TM-score 0 indicates a random model, and TM-score 1 indicates an ideal model. The model of the catalytic domain has a TM-score of 0.76. The model of the ankyrin repeats has a TM-score of 0.77. We then screened the computational models by examining for discrepancies between deuterium exchange information and predicted structure. Specifically we looked for regions predicted to have low levels of exchange exhibiting higher than expected levels.
RESULTS
GVIA iPLA2 Coverage Map of Pepsin Fragmentation
The protein digestion procedure was optimized by changing denaturant concentrations, flow rates, and pepsin incubation times to produce the optimized map shown in Fig. 1. This procedure gave 110 different identifiable peptides, which covered 88% of the total protein sequence. From these 110 peptides, 69 different peptides were selected and analyzed for the data shown in the figures. These peptides are indicated as bold lines in Fig. 1. Peptides were selected based on their signal to noise ratio.
FIGURE 1.

Pepsin-digested peptide coverage map of GVIA-2 iPLA2. Identified and analyzed peptides resulting from pepsin-digestion are shown below the primary sequence of GVIA-2 iPLA2. Only the peptides shown as solid lines were used in this study.
Deuterium On-exchange of GVIA iPLA2
Activity measurements were performed on the recombinant GVIA PLA2 after purification to check for proper folding, and the activity of 1780 ± 83 nmol min−1 mg−1 corresponded well to previously published activity values of 1600 nmol min−1 mg−1 (7). Deuterium exchange experiments were carried out as described previously with GIA and GIVA PLA2 (24, 25, 28). In summary GVIA PLA2 was incubated with 75% D2O for seven different time points varying from 10 to 10,000 s, then quenched, and injected onto the HPLC on-line digestion system.
The results of the amide hydrogen/deuterium exchange at seven time points ranging from 10 s to 166 min are shown in Fig. 2. To optimally present the results when there were several overlapping peptides, the peptides with the highest intensity and the best coverage were selected to represent a specific region denoted. Because of the fast off-exchange rate of the two N-terminal residues on each of the peptides, those residues would not be able to retain any deuterons under the experimental conditions used; hence these residues are not shown in the results. Also all side chain hydrogens are lost in the aqueous HPLC separation. The pepsin-digested peptide coverage map shows the actual physical peptic peptides that were isolated, detected, and identified. The results of deuterium exchange experiments reported in a subsequent figure (Fig. 2) only show the deuterium exchange levels of various effective regions of the protein, not the peptides per se. In this study, when we use the term “peptide,” we are referring to an actual peptide that was identified in the pepsin digestion. When we use the term “region,” we are referring to a section of the protein for which the deuterium exchange was calculated, but it may or may not correspond to an actual pepsin peptide. Overall the representative peptides selected to show the DXMS results account for 71% coverage of the GVIA iPLA2. Some overlapping peptides that were not selected in Fig. 2 had similar trends in deuteration level over the time course, such as peptide 629–655 and peptide 630–655. Also some peptides could be used to calculate the differences between two overlapping peptides to provide even better resolution.
FIGURE 2.

Deuterium exchange of the GVIA-2 iPLA2. Each bar under the primary sequence is divided into rows corresponding to each time point from 10 to 10,000 s (top to bottom). The color coding indicates the percentage of hydrogen/deuterium exchange in the given time period.
GVIA-2 PLA2 contains an N-terminal region from residues 1 to 151 of unknown structure followed by seven ankyrin repeats from residues 152 to 382 as well as a linker region from 383 to 474 and a catalytic domain from 475 to 806 containing the active site Ser at 519. The deuterium exchange in the N-terminal region from 1 to 151 showed low levels of exchange at early time points with no peptide having greater than 50% deuteration at 30 s of on-exchange. The seven ankyrin repeats and linker region from 152 to 474 had numerous regions of extremely fast exchange, specifically at 205–211, 390–404, 439–450, and 458–470. These regions exchanged beyond 70% deuteration at 10 s of on-exchange. The rest of the ankyrin and linker region showed levels of exchange similar to those of the N-terminal region. The catalytic region from 474 to 805 has two regions that showed extremely fast exchange at 617–629 and 708–730. These regions exchanged greater than 70% of amide hydrogens in the first 10 s of exchange. The rest of the catalytic domain had no regions with greater than 50% deuteration at 10 s of on-exchange. Most regions in the catalytic domain had between 0 and 40% deuteration in the first 10 s of exchange. The catalytic domain had an excellent spread of exchange rates ranging from 10 to 100% after 10,000 s of hydrogen/deuterium exchange.
Phospholipid Binding Effects on GVIA iPLA2
On-exchange experiments were performed on the GVIA-2 PLA2 in the presence of phospholipid vesicles to determine how the enzyme orients on the surface. These experiments were carried out in the presence of 125 μm PAPC vesicles with MAFP present to prevent hydrolysis of the substrate vesicles. Activity assays were done under deuterium exchange conditions, and even at 166 min of enzyme substrate mixing the total hydrolysis was under 1%. These experiments were carried out at seven different time points from 10 s to 166 min as shown in Fig. 3. The error for these experiments was determined from the average of two independent experiments of seven time points. For all regions with significant changes in exchange we include overlapping peptide data (supplemental Fig. 1).
FIGURE 3.

Phospholipid membrane effects on hydrogen/deuterium exchange of the GVIA-2 iPLA2. The number of incorporated deuterons in GVIA iPLA2 (▴) and GVIA iPLA2 with MAFP and PAPC vesicles (♦) is shown for regions in which deuterium exchange changed upon vesicle interaction. The scale of the y axis is the maximum deuteron number. S.E. (bars) was determined by two individual experiments. Regions 378–389 and 708–730 at 1000, 3000, and 10,000 s are single determinations.
The DXMS data were analyzed by curve fitting of a multiexponential association and are shown in Table 1. The rates of amide hydrogen exchange were divided into four groups: fast (K > 4.15 min−1), intermediate (4.15 > K > 0.1 min−1), slow (0.1 > K > 0.004 min−1), and non-exchangeable (K < 0.004 min−1) (Table 1). The decrease of the deuteration can be quantitated by the shift in the number of deuterons in different groups.
TABLE 1.
The number of amide hydrogens in regions of GVIA-2 iPLA2 within a different range of rate constants
| Exchangeregion | Totalamides | PAPC/MAFP | Number of amide hydrogens indifferent exchange rate constants |
|||
|---|---|---|---|---|---|---|
| Fasta(K > 4.15 min−1) | Intermediatea(4.15 > K > 0.1 min−1) | Slowa(0.1 > K > 0.002 min−1) | Non-exchangeableb(K < 0.004 min−1) | |||
| 87–104 | 16 | − | 2.9 ± 0.2 | 3.7 ± 0.2 | 3.3 ± 0.2 | 6.1 ± 0.6 |
| + | 3.0 ± 0.1 | 3.7 ± 0.1 | 3.1 ± 0.1 | 6.2 ± 0.3 | ||
| 277–299 | 21 | − | 3.7 ± 0.1 | 2.0 ± 0.1 | 5.0 ± 0.1 | 10.3 ± 0.3 |
| + | 4.1 ± 0.3 | 2.0 ± 0.4 | 3.8 ± 0.4 | 11.1 ± 1.1 | ||
| 378–389 | 10 | − | 2.7 ± 0.1 | 2.2 ± 0.1 | 1.2 ± 0.1 | 3.9 ± 0.3 |
| + | 2.5 ± 0.4 | 3.6 ± 0.4 | 0 | 3.9 ± 0.8 | ||
| 631–655 | 23 | − | 7.7 ± 0.2 | 3.5 ± 0.2 | 4.6 ± 0.1 | 7.2 ± 0.5 |
| + | 6.4 ± 0.1 | 3.0 ± 0.2 | 0 | 13.6 ± 0.3 | ||
| 658–664 | 6 | − | 1.4 ± 0.1 | 0.8 ± 0.0 | 1.0 ± 0.0 | 2.8 ± 0.1 |
| + | 1.1 ± 0.1 | 0.6 ± 0.1 | 0.7 ± 0.1 | 3.6 ± 0.3 | ||
| 708–730 | 21 | − | 16.9 ± 0.2 | 0.3 ± 0.2 | 0 | 3.8 ± 0.4 |
| + | 3.2 ± 0.3 | 0 | 9.6 ± 0.4 | 8.2 ± 0.7 | ||
| 773–778 | 6 | − | 2.9 ± 0.1 | 1.2 ± 0.1 | 0 | 1.9 ± 0.2 |
| + | 2.5 ± 0.1 | 0.9 ± 0.1 | 0 | 2.6 ± 0.2 | ||
a From the curve fit of three-phase association or two-phase association in GraphPad Prism 4.0.
b Calculation by (Total exchangeable amides) − (Fast + intermediate + slow) = Non-exchangeable.
Five different regions of the protein showed changes in exchange upon addition of PAPC substrate vesicles. Four of these regions, (631–655, 658–664, 708–730, and 773–778) were located on the catalytic domain, and all showed decreases in exchange. Only one region in the ankyrin repeat and linker region showed a change in exchange (378–389), and this was an increase in exchange. The region 708–730 had a dramatic 74% decrease at the 10-s time point in the presence of PAPC vesicles. Region 708–730 had 16.9 fast exchanging amide hydrogens (K > 4.15 min−1) under basal conditions. The presence of PAPC vesicles caused the rate of hydrogen/deuterium exchange to shift to 3.2 fast exchanging deuterons, 9.6 slow exchanging deuterons, and 8.2 non-exchangeable deuterons. Thirteen fast exchanging amides had a dramatic decrease in exchange rates in the presence of phospholipid substrate. This indicates that a highly solvent-accessible region had been removed from bulk solution. Multiple peptides at different charge states were detected in this region. The vesicle binding effects within the region 708–730, residues 708–717, 710–722, 710–730, and 725–730, showed a 49, 71, 72, and 72% decrease at 10 s, respectively. This region contains numerous hydrophobic regions and may be important in penetrating the hydrophobic membrane.
Interestingly regions 631–655, 658–664, and 773–778 showed no detectable changes in exchange at early time points with the greatest difference in exchange rates seen at 166 min. The changes in region 631–655 involved the shift of one fast and four slow exchanging amide hydrogens to non-exchangeable amide hydrogens (K < 0.004 min−1) in the presence of phospholipid. This may be caused by this region contacting phospholipid or conformational changes upon substrate binding. The region 773–778 had a similar trend but showed a smaller effect than the region 631–655. The region 378–389 in the ankyrin repeat domain of the protein had an increase of 10–20% at time points from 30 s to 16 min. This region showed a shift from one slow exchanging deuteron to an intermediate exchanging deuteron, implying that the binding of PAPC may also affect the relative position between ankyrin repeats and the catalytic domain.
MAFP Binding Effects on GVIA iPLA2
To separate the phospholipid binding effects from the MAFP binding effects, we carried out further independent DXMS experiments with MAFP-bound GVI iPLA2 at seven time points from 10 s to 166 min at 23 °C. MAFP binding caused no significant changes in exchange (supplemental Fig. 2). No peptide we identified contains the active site Ser519, which we believe to be the site of covalent modification by MAFP.
Structural Model for GVIA iPLA2
To assist in the analysis of the changes of deuterium exchange due to phospholipid binding a structural model was needed. No NMR or crystal structure exists for the GVIA PLA2. Residues 88–474 have 51% homology to the crystal structure of human Ankyrin-R (Protein Data Bank code 1N11), and the catalytic domain from 475 to 806 has a 40% homology to the lipase patatin (Protein Data Bank code 1OXW). Any structure with greater than 30% homology is usually considered a suitable candidate for computational modeling and can be considered as reliable as a low resolution crystal structure (40). The results of our homology models are shown in Fig. 4. In this figure the amount of deuterium exchange at 3000 s is plotted on the structure. The models are composed of an ankyrin repeat and linker domain from 88 to 474 and the catalytic domain from 475 to 804. No information on the relative positions of these two domains is available based on our homology modeling.
FIGURE 4.

Deuteration level of GVIA-2 iPLA2. A, schematic representation of GVIA-2 iPLA2. The seven ankyrin repeats are in green. Three helix-turn-helix-loop structures are the three blocks upstream of ankyrin repeats. The eighth ankyrin repeat (red) is interrupted by a 54-residue insertion (white). B, the deuterium exchange map of GVIA-2 iPLA2 is shown after 3000 s of on-exchange with the color coding indicating the percentage of hydrogen/deuterium exchange.
To help validate the model we examined the exchange rates versus the predicted structure and looked for a correlation between them. Previous work has used deuterium exchange with homology modeling to validate structures (26). Regions of the protein that are composed of turns and loops should be more deuterated than α helices and β sheets. Also regions that are deeply embedded in the hydrophobic core should have very low levels of exchange. From viewing the exchange rates of the catalytic domain it appears that the homology model corresponds very well to the experimental exchange rates. The catalytic domain is predicted to be composed of an α/β-hydrolase domain with six α helices and six β sheets that showed levels of exchange less than 50% even at 3000 s of on-exchange. The only two regions with rapid exchange (>60% at 10 s of on-exchange) are regions 617–629 and 708–730. Region 617–629 has no predicted α helix or β sheet secondary structure and is located at the exterior of the protein. Region 708–730 has some α helices within this region, but they are surrounded by loops and are not packed against the central core of the protein. Because of the extremely high rates of exchange in region 708–730, there most likely is very little secondary structure, and the two α helices are only transiently formed.
To further validate this model we compared the exchange rates of the catalytic domain of the GVIA PLA2 with the GIVA PLA2 at 30 s of on-exchange (supplemental Fig. 3) (28). The exchange rates of the proposed α/β-hydrolase core of GVIA PLA2 and the α/β-hydrolase core of GIVA PLA2 in both proteins were very low level. In GIVA PLA2 the 180-residue cap region showed >60% deuteration. The deuteration levels of region 708–730 in GVIA PLA2 mimicked the exchange rates of the cap region of GIVA PLA2.
The model of the ankyrin repeat and linker regions from 88 to 474 contains the seven ankyrin repeats predicted from sequence homology at 152–382 (41), but our homology modeling and secondary structure calculations also predicted that the region 50–151 contains three pseudo ankyrin repeats. Two of them can be modeled into the Ankyrin-R structure as shown in Fig. 4. Of course, these proposed three ankyrin homologous repeats may have different functions or pack differently from the other downstream seven ankyrin repeats. In the proposed seven-ankyrin repeat regions (residues 152–382), ankyrin repeats 2, 3, 4, and 5 showed higher solvent accessibility than ankyrin repeats 1, 6, and 7. The proposed loop of the second ankyrin repeat was highly exchanged even at the 10-s time point. The second through fifth ankyrin repeats did not show fast exchange rates in all regions. The slow exchanging regions 238–240 and 273–274 also appeared in these ankyrin repeats. The linker region (residues 383–474) with a 54-amino acid insertion in the middle of the eighth ankyrin repeat showed very high solvent accessibility (70–100%) after 166 min of exchange. This region is predicted to be a collection of three helix-turn-helix-loop structures. This indicates that the proposed ankyrin repeats present in the linker region are not as compact or well structured as the seven previously reported ankyrin repeats.
Phospholipid Binding Effects Mapped on the Structural Model of GVIA iPLA2
The changes in deuteration upon binding phospholipid substrate were mapped on the homology models of the catalytic domain (Fig. 5A) and the ankyrin repeat region (Fig. 5B). The major change is in region 708–730, which is located near the active site Ser519. All of the other regions with decreases in exchange are located on the same face of the enzyme as 708–730. Regions 631–655, 658–664, and 773–778 also showed a similar trend of a decrease in exchange in amides with slow exchange rates (rate of exchange >0.1 min−1; Table 1). From examining the model these regions are all predicted to be near the slow exchanging central core near the active site. There are a total of three different peptides in the region of 631–665, two different peptides in the region of 658–664, six different peptides in the region of 708–730, and one peptide in the region of 773–778 that carry similar trends (supplemental Fig. 1).
FIGURE 5.

Phospholipid membrane effects on hydrogen/deuterium exchange of the GVIA-2 iPLA2 mapped onto the model. The number of incorporated deuterons in the catalytic domain (A) and in residues 88–474 (B) of GVIA iPLA2 in the presence (♦) and absence of PAPC/MAFP vesicles (▴) is shown for regions in which deuterium exchange changed upon vesicle interaction as indicated in green or blue on the structural diagram. The difference of the deuteration percentage mapped onto the model is the maximal difference shown in the plots. The catalytic residues are shown in stick mode. The scale of the y axis is the maximum deuteron number. S. E. (bars) was determined by two individual experiments.
The hydrogen/deuterium exchange data in the N terminus and the ankyrin repeats did not have a significant change upon PAPC vesicle binding except region 378–389. Two examples of the amide hydrogen/deuterium exchange without any change in the ankyrin repeats (87–104 and 277–299) are shown in Fig. 5B. Region 378–389 in the linker region showed a 2.2 deuteron or 18% increase of hydrogen/deuterium exchange at 5 min, indicating that this region became more flexible or exposed to solvent upon phospholipid membrane interaction. From our homology modeling the reason for this increase in exchange is not clear.
To understand whether the ankyrin repeats affect binding to vesicles and clarify the interaction between the ankyrin repeats and the catalytic domain, we tried on-exchange experiments on the GVI Ankyrin-1 protein in the presence and absence of PAPC vesicles at two time points, 30 s and 50 min. The results are clear that the GVI Ankyrin-1 protein did not associate with PAPC vesicles. We also found that regions 378–389, 391–405, 408–412, and 468–479 in the linker region of the Ankyrin-1 showed a faster hydrogen/deuterium exchange at 30 s than the intact enzyme (supplemental Fig. 4). The whole linker region had extremely fast rates of exchange after the deletion of the catalytic domain. However, the changes were only located in the linker region, indicating that the ankyrin repeats do not physically contact the catalytic domain. The contact region to the catalytic domain is localized to the linker region.
DISCUSSION
This is the first comprehensive structural study of the GVIA iPLA2. We carried out deuterium exchange studies in the presence and absence of substrate vesicles and using these exchange rates created a homology model of the two different domains of the GVIA iPLA2. We expect that there will still be inevitable differences between the calculated model and the NMR or x-ray crystal structure should it be solved. This model is intended for the interpretation of amide hydrogen/deuterium exchange results. Specifically the model was developed to determine the orientation of the enzyme on the membrane surface. This is a continuation of our previous work exploring the phospholipase A2 superfamily of enzymes and their membrane binding using deuterium exchange mass spectrometry (24, 25, 28).
The deuterium exchange results showed a strong correlation to the predicted rates of the homology model. Deuterium exchange has been used previously with homology modeling to model the structure of dual specific protein kinase A-anchoring protein 2 (D-AKAP-2) (26). This report used predicted exchange rates based on secondary structure to validate a homology model. Here we used a correlation between the exchange rates of the proposed α/β-hydrolase central core of GVIA iPLA2 and the core of GIVA cPLA2 (supplemental Fig. 3) (28). The exchange rates of the secondary structures in the iPLA2 model matched well with the exchange rates of the secondary structures in cPLA2 at the early time points of less than 30 s. The proposed central core of the GVIA iPLA2 did show higher levels of deuteration at later time points unlike the GIVA cPLA2. This is most likely due to the fact that the proposed structure of the GVIA iPLA2 does not contain the 180-residue cap region including a lid covering the active site as in the GIVA cPLA2. The active site Ser519 is very likely more exposed in the GVIA iPLA2 compared with the GIVA cPLA2. This could explain the lack of specificity for the fatty acid in the sn-2 position of GVIA iPLA2 compared with the arachidonic specificity of GIVA cPLA2. From this correlation we are confident that the catalytic domain structure is accurate enough to model the location and orientation of membrane binding.
The most striking difference between the GIVA PLA2 crystal structure (42) and the GVIA PLA2 structural model is the absence of any cap or lid region. The GVIA PLA2 has no specificity for fatty acids in the sn-2 position (5, 43). GIVA PLA2 is highly specific for arachidonic acid in the sn-2 position (44). The difference in this sensitivity may be due to the active site Ser519 of GVIA PLA2 being much closer to the surface in the proposed model of GVIA PLA2 compared with GIVA PLA2. Also we have showed previously that both natural substrate vesicles and the inhibitor MAFP cause increases in exchange in regions of the GIVA PLA2 underneath the cap region, implying a shift in a lid covering the active site (24). No concurrent increases in exchange were seen in the catalytic domain of GVIA PLA2 upon either substrate binding or MAFP binding. This indicates that the mechanisms that regulate the activity of GVIA PLA2 are very different from that of GIVA PLA2.
The results of the intact GVIA PLA2 binding to a membrane surface showed changes in exchange in five different regions. Only one of these regions was located in the ankyrin repeat linker region of the protein. Region 378–389 located in the middle of the linker region had a 2.2 deuteron increase in exchange at 5 min of on-exchange. When deuterium exchange experiments were done with the isolated ankyrin repeat linker construct the entire linker region had increases in exchange compared with the intact enzyme. This implies that the linker region is in contact with the catalytic domain. The increase in exchange at 378–389 may imply that upon lipid binding there is a conformational change in the orientation of the catalytic domain relative to the ankyrin repeat linker region.
Four of the changes in deuterium exchange were localized to the catalytic domain, and all were decreases in exchange. The decreases in exchange on the catalytic domain occurred in areas that have numerous different hydrophobic residues (Fig. 6). The region with the greatest decrease in exchange is 708–730. This region had a 13.2 deuteron decrease in exchange at the 10-s time point with only a 3.5 deuteron decrease at 166 min. This region is the most highly solvent-exposed region in the protein in the absence of vesicles. The almost total absence of exchange at 10 s of on-exchange in the presence of lipid vesicles implies that this region is penetrating into the membrane surface. This region contains hydrophobic residues Val708, Phe709, Trp715, Leu717, Val721, Phe722, and Leu727 that may mediate penetration into the lipid surface.
FIGURE 6.

The electrostatic potential of the GVIA-2 iPLA2 and the affected regions in the deuteration level upon PAPC vesicle binding. A, the electrostatic potential mapped to the molecular surface was calculated by Swiss-PdbViewer 3.7 based on simple coulombic interactions. B, the regions with decreases of amide hydrogen/deuterium exchange are shown on the molecular surface of the catalytic domain. C and D, the corresponding back views of A and B, respectively.
Region 773–778 had a one deuteron decrease in hydrogen/deuterium exchange at 166 min, and it is negatively charged. The main decreases in exchange in this region occurred in slowly exchanging amide hydrogens as shown in Table 1. This region consists of an α helix that is part of the catalytic core, which explains the low rates of exchange. There are no hydrophobic regions in this region, and most likely decreases here are due to either electrostatic interactions between the charged membrane head group and the charged residues Asp771, Glu772, and Asp775 or conformational changes induced by substrate binding. Regions 631–655 and 658–664 are both spatially very close to the active site Ser519 and are on the same face of the enzyme as the proposed membrane penetration region of 708–730. Both of these regions do not have hydrophobic regions and are also most likely interacting with the charged surface of the membrane rather than mediating penetration.
Our model of GIVA PLA2 membrane binding involves the penetration of the region from 708–730 into the membrane surface with regions 631–655, 658–664, and 773–778 interacting with the charged head group of the phospholipid substrate. This study showed the first information on the orientation of the GVIA PLA2 upon binding phospholipid as well as the first structural model of the ankyrin repeat linker region and catalytic domain of GVIA PLA2.
Supplementary Material
Acknowledgment
We thank Raymond A. Deems for valuable discussion.
This work was supported, in whole or in part, by National Institutes of Health Grants GM20501 (to E. A. D.) and CA099835, CA118595, and AI076961 (to V. L. W.).
 The on-line version of this article (available at http://www.jbc.org) contains supplemental Figs. 1–4.
- PLA2
- phospholipase A2
- GVIA
- Group VIA
- GIVA
- Group IVA
- GIA
- Group IA
- iPLA2
- Ca2+-independent phospholipase A2
- DXMS
- deuterium exchange coupled with mass spectrometry
- PAPC
- 1-palmitoyl-2-arachidonoyl-sn-phosphatidylcholine
- MAFP
- methyl arachidonyl fluorophosphonate
- MOPS
- 4-morpholinepropanesulfonic acid
- HPLC
- high pressure liquid chromatography.
REFERENCES
- 1.Six D. A., Dennis E. A. (2000) Biochim. Biophys. Acta 1488,1–19 [DOI] [PubMed] [Google Scholar]
- 2.Burke J. E., Dennis E. A. (2009) Cardiovasc. Drugs Ther. 23,49–59 [DOI] [PMC free article] [PubMed] [Google Scholar]
- 3.Larsson P. K., Claesson H. E., Kennedy B. P. (1998) J. Biol. Chem. 273,207–214 [DOI] [PubMed] [Google Scholar]
- 4.Larsson Forsell P. K., Kennedy B. P., Claesson H. E. (1999) Eur. J. Biochem. 262,575–585 [DOI] [PubMed] [Google Scholar]
- 5.Ackermann E. J., Kempner E. S., Dennis E. A. (1994) J. Biol. Chem. 269,9227–9233 [PubMed] [Google Scholar]
- 6.Balboa M. A., Balsinde J., Jones S. S., Dennis E. A. (1997) J. Biol. Chem. 272,8576–8580 [DOI] [PubMed] [Google Scholar]
- 7.Lio Y. C., Dennis E. A. (1998) Biochim. Biophys. Acta 1392,320–332 [DOI] [PubMed] [Google Scholar]
- 8.Roshak A. K., Capper E. A., Stevenson C., Eichman C., Marshall L. A. (2000) J. Biol. Chem. 275,35692–35698 [DOI] [PubMed] [Google Scholar]
- 9.Balsinde J., Pérez R., Balboa M. A. (2006) Biochim. Biophys. Acta 1761,1344–1350 [DOI] [PubMed] [Google Scholar]
- 10.Pérez R., Balboa M. A., Balsinde J. (2006) J. Immunol. 176,2555–2561 [DOI] [PubMed] [Google Scholar]
- 11.Bao S., Li Y., Lei X., Wohltmann M., Jin W., Bohrer A., Semenkovich C. F., Ramanadham S., Tabas I., Turk J. (2007) J. Biol. Chem. 282,27100–27114 [DOI] [PMC free article] [PubMed] [Google Scholar]
- 12.Ramanadham S., Yarasheski K. E., Silva M. J., Wohltmann M., Novack D. V., Christiansen B., Tu X., Zhang S., Lei X., Turk J. (2008) Am. J. Pathol. 172,868–881 [DOI] [PMC free article] [PubMed] [Google Scholar]
- 13.Bao S., Miller D. J., Ma Z., Wohltmann M., Eng G., Ramanadham S., Moley K., Turk J. (2004) J. Biol. Chem. 279,38194–38200 [DOI] [PMC free article] [PubMed] [Google Scholar]
- 14.Bao S., Bohrer A., Ramanadham S., Jin W., Zhang S., Turk J. (2006) J. Biol. Chem. 281,187–198 [DOI] [PMC free article] [PubMed] [Google Scholar]
- 15.Bao S., Song H., Wohltmann M., Ramanadham S., Jin W., Bohrer A., Turk J. (2006) J. Biol. Chem. 281,20958–20973 [DOI] [PMC free article] [PubMed] [Google Scholar]
- 16.Sedgwick S. G., Smerdon S. J. (1999) Trends Biochem. Sci. 24,311–316 [DOI] [PubMed] [Google Scholar]
- 17.Atsumi G., Murakami M., Kojima K., Hadano A., Tajima M., Kudo I. (2000) J. Biol. Chem. 275,18248–18258 [DOI] [PubMed] [Google Scholar]
- 18.Hemmer W., McGlone M., Tsigelny I., Taylor S. S. (1997) J. Biol. Chem. 272,16946–16954 [DOI] [PubMed] [Google Scholar]
- 19.Ma Z., Wang X., Nowatzke W., Ramanadham S., Turk J. (1999) J. Biol. Chem. 274,9607–9616 [DOI] [PMC free article] [PubMed] [Google Scholar]
- 20.Hamuro Y., Anand G. S., Kim J. S., Juliano C., Stranz D. D., Taylor S. S., Woods V. L., Jr. (2004) J. Mol. Biol. 340,1185–1196 [DOI] [PubMed] [Google Scholar]
- 21.Englander J. J., Del Mar C., Li W., Englander S. W., Kim J. S., Stranz D. D., Hamuro Y., Woods V. L., Jr. (2003) Proc. Natl. Acad. Sci. U.S.A. 100,7057–7062 [DOI] [PMC free article] [PubMed] [Google Scholar]
- 22.Hsu Y. H., Johnson D. A., Traugh J. A. (2008) J. Biol. Chem. 283,36397–36405 [DOI] [PMC free article] [PubMed] [Google Scholar]
- 23.Hochrein J. M., Lerner E. C., Schiavone A. P., Smithgall T. E., Engen J. R. (2006) Protein Sci. 15,65–73 [DOI] [PMC free article] [PubMed] [Google Scholar]
- 24.Burke J. E., Hsu Y. H., Deems R. A., Li S., Woods V. L., Jr., Dennis E. A. (2008) J. Biol. Chem. 283,31227–31236 [DOI] [PMC free article] [PubMed] [Google Scholar]
- 25.Burke J. E., Karbarz M. J., Deems R. A., Li S., Woods V. L., Jr., Dennis E. A. (2008) Biochemistry 47,6451–6459 [DOI] [PMC free article] [PubMed] [Google Scholar]
- 26.Hamuro Y., Burns L., Canaves J., Hoffman R., Taylor S., Woods V. (2002) J. Mol. Biol. 321,703–714 [DOI] [PubMed] [Google Scholar]
- 27.Six D. A., Dennis E. A. (2003) J. Biol. Chem. 278,23842–23850 [DOI] [PubMed] [Google Scholar]
- 28.Hsu Y. H., Burke J. E., Stephens D. L., Deems R. A., Li S., Asmus K. M., Woods V. L., Jr., Dennis E. A. (2008) J. Biol. Chem. 283,9820–9827 [DOI] [PMC free article] [PubMed] [Google Scholar]
- 29.Englander S. W., Kallenbach N. R. (1983) Q. Rev. Biophys. 16,521–655 [DOI] [PubMed] [Google Scholar]
- 30.Zhang Z., Post C. B., Smith D. L. (1996) Biochemistry 35,779–791 [DOI] [PubMed] [Google Scholar]
- 31.Kim M. Y., Maier C. S., Reed D. J., Deinzer M. L. (2002) Protein Sci. 11,1320–1329 [DOI] [PMC free article] [PubMed] [Google Scholar]
- 32.Yan X., Zhang H., Watson J., Schimerlik M. I., Deinzer M. L. (2002) Protein Sci. 11,2113–2124 [DOI] [PMC free article] [PubMed] [Google Scholar]
- 33.Altschul S. F., Madden T. L., Schäffer A. A., Zhang J., Zhang Z., Miller W., Lipman D. J. (1997) Nucleic Acids Res. 25,3389–3402 [DOI] [PMC free article] [PubMed] [Google Scholar]
- 34.Schäffer A. A., Aravind L., Madden T. L., Shavirin S., Spouge J. L., Wolf Y. I., Koonin E. V., Altschul S. F. (2001) Nucleic Acids Res. 29,2994–3005 [DOI] [PMC free article] [PubMed] [Google Scholar]
- 35.Michaely P., Tomchick D. R., Machius M., Anderson R. G. (2002) EMBO J. 21,6387–6396 [DOI] [PMC free article] [PubMed] [Google Scholar]
- 36.Rydel T. J., Williams J. M., Krieger E., Moshiri F., Stallings W. C., Brown S. M., Pershing J. C., Purcell J. P., Alibhai M. F. (2003) Biochemistry 42,6696–6708 [DOI] [PubMed] [Google Scholar]
- 37.Rost B., Yachdav G., Liu J. (2004) Nucleic Acids Res. 32,W321–W326 [DOI] [PMC free article] [PubMed] [Google Scholar]
- 38.Bennett-Lovsey R. M., Herbert A. D., Sternberg M. J., Kelley L. A. (2008) Proteins 70,611–625 [DOI] [PubMed] [Google Scholar]
- 39.Zhang Y., Skolnick J. (2004) Proteins 57,702–710 [DOI] [PubMed] [Google Scholar]
- 40.Xiang Z. (2006) Curr. Protein Pept. Sci. 7,217–227 [DOI] [PMC free article] [PubMed] [Google Scholar]
- 41.Winstead M. V., Balsinde J., Dennis E. A. (2000) Biochim. Biophys. Acta 1488,28–39 [DOI] [PubMed] [Google Scholar]
- 42.Dessen A., Tang J., Schmidt H., Stahl M., Clark J. D., Seehra J., Somers W. S. (1999) Cell 97,349–360 [DOI] [PubMed] [Google Scholar]
- 43.Tang J., Kriz R. W., Wolfman N., Shaffer M., Seehra J., Jones S. S. (1997) J. Biol. Chem. 272,8567–8575 [DOI] [PubMed] [Google Scholar]
- 44.Clark J. D., Lin L. L., Kriz R. W., Ramesha C. S., Sultzman L. A., Lin A. Y., Milona N., Knopf J. L. (1991) Cell 65,1043–1051 [DOI] [PubMed] [Google Scholar]
Associated Data
This section collects any data citations, data availability statements, or supplementary materials included in this article.