Abstract
Purpose
We determined the prognostic value of carcinoembryonic antigen (CEA) clearance after tumor resection with serial evaluation of postoperative CEA levels in rectal cancer.
Methods
Between 1994 and 2004, we retrospectively reviewed 122 patients with rectal cancer whose serum CEA levels were measured on the preoperative day and postoperative days 7 and 30. Patients with preoperative CEA levels <5.0 ng/ml were excluded. An exponential trend line was drawn using the three CEA values. Patients were categorized into three groups based on R2 values calculated through trend line, which indicates the correlation coefficient between exponential graph and measured CEA values: exponential decrease group (group 1: 0.9 < R2 ≤ 1.0), nearly exponential decrease group (group 2: 0.5 < R2 ≤ 0.9), and randomized clearance group (group 3: 0.5 ≤ R2). We then analyzed the CEA clearance pattern as a prognostic indicator.
Results
With a median follow-up of 57 months, the 5-year overall survival was 62.3% vs. 48.1% vs. 25% and the 5-year disease-free survival was 58.6% vs. 52.7% vs. 25% among groups 1, 2, and 3 (P = 0.014, P = 0.027, respectively) in patients with stage III rectal cancer. For those with stage II rectal cancer, the 5-year overall survival rate of group 1 was significantly better than groups 2 and 3 (88.8% vs. 74.1%, respectively, P = 0.021).
Conclusions
The postoperative pattern of CEA clearance is a useful prognostic determinant in patients with rectal cancer. Patients with a randomized pattern of CEA clearance after tumor resection should be regarded as having the possibility of a persistent CEA source and may require consideration of intensive follow-up or adjuvant therapy.
The major prognostic determinant of colorectal cancer (CRC) is the pathologic stage of the tumor. Since 1987, the American Joint Committee on Cancer (AJCC) and the International Union Against Cancer (UICC) have proposed a worldwide categorization of cancer staging based on localized tumor invasion depth, nodal involvement, and the status of metastasis (TNM).1 However, a recent analysis has suggested that CRC is heterogeneous in survival patterns even within staging categories.2,3 Thus, there have been many efforts to determine the prognostic significance of subgroup stratification in staging patients with node-positive CRC, including molecular and biochemical markers.4–6 However, the validity of those markers remains controversial and their clinical application is limited due to their complexity, the difficulties of standardization, and the cost of measurement. Carcinoembryonic antigen (CEA) is the most widely used and readily available tumor marker for the management of CRC and quantitative measurements of serum CEA can be performed easily and cost effectively. Many clinical scientists have evaluated the kinetic patterns of tumor markers as prognostic variables and have discovered that there are characteristic patterns of exponential changes in the tumor marker levels after surgical resection or tumor recurrence.5–8,9–11
In this study, we assessed the pattern of serum CEA clearance after radical colectomy by evaluating the postoperative CEA levels to determine its potential application as a surrogate maker for predicting cancer-specific mortality.
Patients and Methods
A total of 368 patients with stage II and III rectal cancer, whose serum CEA levels were measured preoperatively and on postoperative days 7 and 30, were selected using the rectal cancer database at Severance Hospital, Yonsei University Healthcare System. Data were collected from between June 1994 and October 2004 and were corrected prospectively. All of the serum CEA assays were performed within one laboratory by the Elecsys 2010 electrochemiluminescence immunoassay (Roche Diagnostics GmbH, Mannheim, Germany) in which the reference cutoff line was 5 ng/ml. Forty-three patients who underwent preoperative chemotherapy or radiation therapy were excluded because their preoperative serum CEA levels may have been influenced by neoadjuvant treatment. From the remaining patients, we further excluded 203 patients whose preoperative CEA value was <5 ng/ml. We considered a group of patients with serum CEA values <5 ng/ml as a subgroup with non-CEA-producing tumors, and therefore, there was no need to calculate the CEA clearance for this group in this particular study. Following these exclusions, a total of 122 patients with stage II and III rectal cancer were analyzed.
Pathological Analysis
Standardized pathologic analysis was performed on all of the specimens collected via radical rectal resection. The rectal tumor was staged according to the 6th UICC TNM staging system. Resection specimens were evaluated for depth of tumor penetration, lymph node involvement, histological type, and lymphovascular invasion.
Follow-Up
Patients received follow-up every 3 months for the first 3 years after surgery, every 6 months for the next 2 years, and yearly thereafter. Follow-up examinations, including clinical history, physical examination, serum CEA levels, chest x-ray, abdominopelvic CT or MRI, and colonoscopy, were performed. Positron emission tomography (PET) scanning was used if necessary. Determination of recurrence was made by clinical and radiological examinations or by histological confirmation.
Calculation of CEA Clearance
The serum CEA of every patient was measured at the same time points before and after tumor resection. Perioperative serum CEA was collected and measured at three different time points, including a preoperative value and values on postoperative days 7 and 30. Because more frequent sampling is very difficult in postoperative patients, the time points were carefully chosen based on tumor cell biology. The first CEA measurement was a preoperative value intended to reflect aggressive tumor activity. The second CEA measurement obtained on postoperative day 7 correlated with the average circulatory half-life of CEA, and the third measurement collected on postoperative day 30 approximated the CEA wash-out phase.11–15
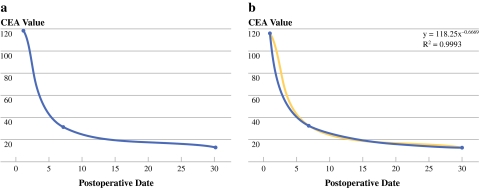
Because of the nature of CEA, decay and production have an exponential distribution depending on the state of tumor activity. As such, many researchers have used the natural log transformation of tumor marker values over time to plot a scatter graph.9,10 In this study, we chose the exponential curve drawn by using the trend line, which is used in demographic research and also biochemical marker study.15 The preoperative CEA values correspond to the starting point of the exponential graph and CEA levels from postoperative days 7 and 30 correspond to the half-life value and the primary end point of this study, respectively (Fig. 1).
Fig. 1.
CEA values (preoperative, postoperative day 7, postoperative day 30) over time (a). An exponential trend line was drawn using each CEA value. R2 values were calculated as the deviation between calculated curves and the measured CEA value. The function of the exponential curve also was calculated (Y = pX−q). The value “q” represents the gradient; it refers to the acute or slow decrease in CEA following tumor resection (b)
Our initial hypothesis held that if there was no source of CEA production after tumor resection, the serum CEA level should be cleared following an exponential kinetics format. If the slope no longer follows exponential kinetics and instead has a randomized pattern of clearance, then one must suspect the possibility of a persistent source of CEA, perhaps in the form of hidden metastasis or the regrowth of remnant tumors due to the failure of complete tumor resection. Using the trend line, R2 values were calculated (Fig. 1). R2 indicates the correlation coefficient between the trend line illustrating the exponential decrease and measured CEA values. If R2 = 1, all data points fall on the exponential line. Therefore, the closer the R2 value is to 1, the more the CEA values tend to fit the exponential curve. We categorized groups using the R2 value to facilitate easier interpretation. We categorized the R2 values twice because there is no ideal cutoff value. First, we divided the patients into three groups: (1) exponential decrease group (group 1: 0.9 < R2 ≤ 1), (2) nearly exponential decrease group (group 2: 0.5 < R2 ≤ 0.9), and (3) randomized clearance group (group 3: R2 ≤ 0.5). We next divided patients into two groups: (1) exponential decrease group (group I: 0.9 < R2 ≤ 1.0), and (2) nonexponential decrease group (group II: 0.9 < R2). For stage II rectal cancer, there were an insufficient number of cases belonging to Group 3, and therefore, we were unable to perform separate analyses of the tri-category variable.
The degree of slope (gradient) was calculated using the exponential trend line (value q, Y = px−q) (Fig. 1b). The gradient is illustrative of the velocity of clearance, acutely vs. slowly decreased. We also categorized the gradient into three groups: gradient ≤ 0.4 (slow rate of decline); 0.4 < gradient ≤ 0.7 (moderate rate of decline); 0.7 < gradient (rapid rate of decline).
Finally, we analyzed the CEA clearance patterns and the gradients as prognostic factors and determined the oncologic outcomes between the patients with exponential CEA clearance kinetics and those with nonexponential CEA clearance kinetics.
Statistical Analysis
Statistical evaluation was performed using the statistical package SPSS for Windows (Version 11.0; SPSS Inc., Chicago, IL). Univariate disease-free survival (DFS) rates and overall survival (OS) rates were calculated with the Kaplan-Meier method for categorized variables. Univariate survival analysis was conducted with the Cox regression hazards model for R2 values. Multivariate survival analysis was conducted with the Cox proportional hazards model. The Cox proportional hazards model was generated by a forward stepwise selection of variables, and a P value of 0.1 was adopted as the limit for inclusion of a covariant. DFS and OS curves were calculated with the Kaplan-Meier method. P < 0.05 was considered statistically significant.
Results
Patient Characteristics
A summary of patient characteristics is presented in Table 1. The mean age was 57.56 ± 12.24 years. Fifty-four patients (44.3%) with stage II rectal cancer and 68 patients (55.7%) with stage III rectal cancer were included. The mean preoperative CEA value was estimated to be 28.73 (range, 5.03–447.20) ng/ml. The mean CEA value on postoperative day 7 was 6.77 (range, 0.20–55.00) ng/ml, and the mean CEA value on postoperative day 30 was 3.34 (range, 0.10–39.21) ng/ml. The R2 ranged from 0.02 to 1.00.
Table 1.
Patient characteristics
| N = 122 | |
|---|---|
| Age (yr) | 57.56 ±12.24 |
| Sex | |
| Female | 46 (37.7%) |
| Male | 76 (62.3%) |
| UICC 6th TNM stage | |
| Stage II | 54 (44.3%) |
| Stage III | 68 (55.7%) |
| Preoperative mean CEA | 28.73 (5.03–447.20) |
| POD 7 mean CEA (ng/ml) | 6.77 (0.20–55.00) |
| POD 30 mean CEA (ng/ml) | 3.34 (0.10–39.21) |
| Mean gradient (value “q”) | 0.6050 (−0.0639–3.07) |
| R2 value | 0.8778 (0.02–1.00) |
CEA carcinoembryonic antigen; POD postoperative day
R2 value and gradient (value “q”) were calculated through trend line illustrating exponential decrease (Y = px−q). R2 values indicate the correlation coefficient between exponential graph and measured CEA values and the gradient (value “q”) is illustrative of the velocity of clearance. The greater values “q” tended to show more rapid decline
Disease-Free Survival and Overall Survival According to Stratified R2 Values
The median follow-up period was 57.61 (range, 4–167) months. In stage II rectal cancer, the Cox regression method demonstrated that the R2 value was not significantly related to DFS but was significantly associated with OS (P = 0.339, P = 0.021, respectively). With categorized evaluation of the R2 values, group I (exponential decrease group) had 4.18 times better OS compared with group II (hazards ratio (HR) 4.186; 95% confidence interval (CI), 1.121–5.635; P = 0.033; Table 2). In stage III rectal cancer, the R2 value was significantly associated with both DFS and OS (P = 0.016, P = 0.004; respectively; Table 3). With categorized evaluation of R2 values, group 1 (exponential decrease group) had 3.12 times better DFS (95% CI, 1.14–8.542, P = 0.027) and 3.812 times better OS compared with group 3 (randomized clearance group) (HR, 3.812; 95% CI, 1.555–9.347; P = 0.003; Table 3).
Table 2.
Cox regression with R2 value and gradient in stage II rectal cancer
| Disease-free survival | Overall survival | |||||
|---|---|---|---|---|---|---|
| HR | 95% Cl | P value | HR | 95% CI | P value | |
| R2 value | 0.252 | 0.015–4.247 | 0.339 | 0.055 | 0.004–0.768 | 0.021 |
| R2 (cutoff) | ||||||
| 0.9–1.0 (group I) | 1.724 | 0.517–5.753 | 0.376 | 4.186 | 1.121–15.63 | 0.033 |
| 0.3–0.9 (group II) | 1 | 1 | ||||
| Gradient (value “q”) | 1.045 | 0.316–3.460 | 0.942 | 1.284 | 0.326–5.063 | 0.721 |
HR hazards ratio; CI confidence interval
R2 value and gradient (value “q”) were calculated through trend line illustrating exponential decrease (Y = px−q). Group I is the exponential decrease group, and group II is the nonexponential decrease group. Group 1 is the exponential decrease group, group 2 is the nearly exponential decrease group, and group 3 is the randomized clearance group. The gradient (value “q”) is illustrative of the velocity of clearance
Table 3.
Cox regression with R2 value and gradient in stage III rectal cancer
| Disease-free survival | Overall survival | |||||
|---|---|---|---|---|---|---|
| HR | 95% Cl | P value | HR | 95% CI | P value | |
| R2 value | 0.178 | 0.044–0.722 | 0.016 | 0.154 | 0.043–0.555 | 0.004 |
| R2(triple) | ||||||
| 0.9–1.0 (group 1) | 3.121 | 1.140–8.542 | 0.027 | 3.812 | 1.555–9.347 | 0.003 |
| 0.5–1.0 (group 2) | 1.454 | 0.567–3.728 | 0.436 | 1.355 | 0.532–3.451 | 0.141 |
| 0.3–0.5 (group 3) | 1 | 1 | ||||
| R2 (cutoff) | ||||||
| 0.9–1.0 (group I) | 1.720 | 0.795–3.719 | 0.168 | 2.111 | 1.021–4.366 | 0.044 |
| 0.3–0.9 (group II) | 1 | 1 | ||||
| Gradient (value “q”) | 0.527 | 0.156–1.778 | 0.302 | 0.551 | 0.175–1.736 | 0.309 |
HR hazards ratio; CI confidence interval
R2 value and gradient (value “q”) were calculated through trend line illustrating exponential decrease (Y = px−q). Group I is the exponential decrease group, and group II is the nonexponential decrease group. Group 1 is the exponential decrease group, group 2 is the nearly exponential decrease group, and group 3 is the randomized clearance group. The gradient (value “q”) is illustrative of the velocity of clearance
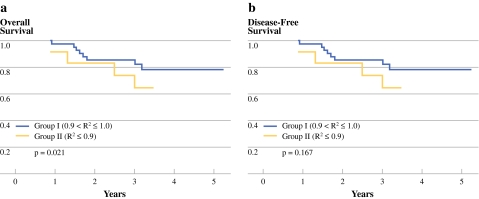
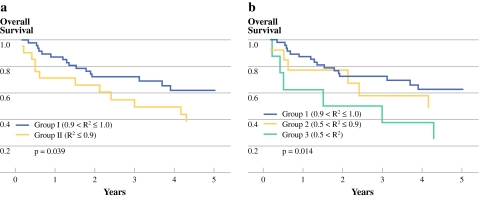
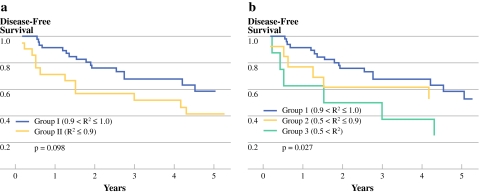
In stage II rectal cancer, the 5-year OS rates in groups I and II were 88.8% and 74.1%, respectively (P = 0.021; Fig. 2a) and the 5-year DFS rates in groups I and II were 78.4% and 64.8%, respectively (P = 0.167; Fig. 2b). In stage III rectal cancer, the 5-year OS rates in groups I and II were 62.3% and 38.7%, respectively (P = 0.039; Fig. 3a). The 5-year DFS rates were 58.6% vs. 41.6% between two groups (P = 0.098; Fig. 4a). The 5-year OS rates were 62.3% vs. 48.1% vs. 25% among groups 1, 2, and 3 (P = 0.014; Fig. 3b). The 5-year DFS rates were 58.6% vs. 52.7% vs. 25%, respectively among groups (P = 0.027; Fig. 4b).
Fig. 2.
The survival curves according to the R2 value in stage II rectal cancer. Group I represents the exponential decrease group compared with group II, the nonexponential decrease group. a There was a significant difference between the two groups in OS (P = 0.021). b There was no statistically significant difference between the groups in DFS (P = 0.167)
Fig. 3.
The overall survival (OS) curves according to the R2 value in stage III rectal cancer. Group I was the exponential decrease group compared with group II, the nonexponential decrease group. a There was a significant difference between the two groups (P = 0.039). The group also was divided to three subgroups: group 1 was the exponential decrease group; group 2 was the nearly exponential decrease group; and group 3 was the randomized clearance group. b Group 3 had significantly worse OS than group 1 (P = 0.014)
Fig. 4.
The disease-free survival (DFS) curves according to the R2 value in stage III rectal cancer. Group I was the exponential decrease group compared with group II, the nonexponential decrease group. a There was no significant difference between the two groups (P = 0.098). The group was further divided into three groups: group 1 was the exponential decrease group; group 2 was the nearly exponential decrease group; and group 3 was the randomized clearance group. b Group 3 had significantly worse DFS than group 1 (P = 0.027)
Prognostic Factors for Disease-Free Survival and Overall Survival in Stage III Rectal Cancer
In stage III, one set of univariate analysis demonstrated that pathologic N stage and CEA value on postoperative day 30 were significantly associated with the DFS rates (P = 0.032, P = 0.028, respectively). This result was confirmed by multivariate analysis with both N stage and R2 value (P = 0.033, P = 0.02; Table 4). Another set of univariate analysis indicated that the pathologic N stage and CEA value on postoperative days 7 and 30 were associated with OS rates (P = 0.003, P = 0.003, P = 0.005, respectively). This result was confirmed by multivariate analysis with N stage, R2 value, and CEA value on postoperative day 7 (P = 0.023, P = 0.002, P = 0.013, respectively; Table 4).
Table 4.
Multivariate analysis of risk factors for 5-year DFS and OS in stage III rectal cancer
| Disease-free survival | Overall survival | |||||
|---|---|---|---|---|---|---|
| HR | 95% Cl | P value | HR | 95% CI | P value | |
| R2 value | 2.467 | 0.029–0.735 | 0.020 | 0.110 | 0.027–0.459 | 0.002 |
| POD 7 CEA (ng/ml) | 0.566–3.356 | 0.480 | 1.243–6.407 | 0.013 | ||
| ≤5 | 1.378 | 2.882 | ||||
| >5 | 1 | 1 | ||||
| POD 30 CEA (ng/ml) | 0.781–6.702 | 0.131 | 0.567–4.078 | 0.413 | ||
| ≤5 | 2.288 | 1.513 | ||||
| >5 | 1 | 1 | ||||
| Pathologic N stage | 1.076–5.656 | 0.033 | 1.130–5.401 | 0.023 | ||
| N1 | 2.467 | 2.470 | ||||
| N2 | 1 | 1 | ||||
HR hazards ratio; CI confidence interval; CEA carcinoembryonic antigen; POD postoperative day
Gradients
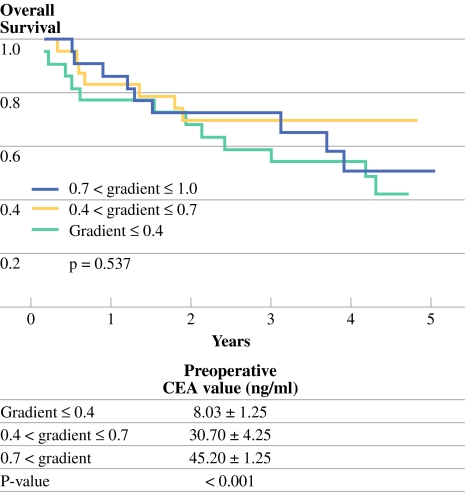
The gradients did not prove to be significant factors in DFS or OS in stage II rectal cancer (P = 0.942, P = 0.721, respectively; Table 2) and stage III rectal cancer (P = 0.527, P = 0.551, respectively; Table 3). With categorized evaluation of gradients, the gradients were significantly related to the preoperative CEA level but, again, were not a significant factor of OS (P < 0.001, P = 0.537, respectively; Fig. 5).
Fig. 5.
Overall survival curves according to gradients with categorized. Using gradients, patients were divided into three groups: gradient ≤ 0.4 (slow rate of decline); 0.4 < gradient ≤ 0.7 (moderate rate of decline); 0.7 < gradient (rapid rate of decline). The categorized three groups were significantly related to the preoperative CEA value (8.03 ± 1.25 ng/ml vs. 30.70 ± 4.25 ng/ml vs. 45.20 ± 1.25 ng/ml, respectively; P < 0.001); however, there was no significant difference in OS among them (P = 0.537)
Discussion
This study illustrates how intimately related the clinical behaviors of carcinomas and the survival rates are to the biochemical kinetics of tumor markers immediately after tumor resection. Many oncologic researchers have investigated the role of serum CEA as a prognostic indicator in CRC.16–19 Some have focused primarily on the prognostic value of preoperative CEA levels, whereas others have focused solely on postoperative CEA values. Before this study, our group demonstrated the utility of CEA values as a prognostic indicator in rectal cancer. In that study, we categorized three groups using preoperative and postoperative day 7 CEA values. Group A included patients with normal CEA levels (≤5 ng/mL) in both the pre- and postoperative periods, group B was comprised of patients with elevated preoperative and normal postoperative CEA levels, and group C included patients with persistently elevated CEA levels during both periods. Patients with stage III rectal cancer in group C demonstrated higher systemic recurrence and worse 5-year survival rates compared with the other groups.20
In this study, we sought to determine the prognostic value of CEA clearance after tumor resection with serial evaluation of postoperative CEA levels in those patients with an elevated preoperative CEA. First, we evaluated the R2 values as a prognostic indicator, which was calculated by drawing exponential trend lines using serial CEA values. Our data showed that patients with greater R2 values tended to have better OS rates and better DFS rates in stages II and III rectal cancer. Using the R2 value, we performed two separate categorizations to evaluate survival rate. With both categorizations, the results were the same: the exponential decrease group had significantly better survival compared with the nonexponential decrease groups in both stages II and III rectal cancer. In stage III rectal cancer, there was a significant difference in the 5-year OS rates (62.3% vs. 48.1% vs. 25%; P = 0.014) and in 5-year DFS between groups (5-year DFS rates were 58.6% vs. 52.7% vs. 25%; P = 0.027) among the exponential decrease, nearly exponential decrease, and randomized clearance groups. We hypothesized that when there is no longer a tissue source producing CEA, the CEA levels would be washed out with a regular clearance rate demonstrating exponential kinetics. Actually our data showed that the closer the R2 value is to 1, the patients tend to have better oncologic outcomes. Conversely, patients who demonstrated a randomized CEA clearance pattern, for which R2 values were <0.5, showed poor prognosis. In patients with randomized CEA clearance pattern, there would be a higher likelihood of a persistent CEA source or undefined mechanism to disturb of CEA clearance, such as in the form of microscopic metastasis or a newly formed CEA-producing tumor possibly resulting from tumor seeding.
In stage III rectal cancer, R2 values were significant prognostic values in OS and DFS by multivariate analysis of prognostic factors, such as N-staging (P = 0.02, P = 0.002, respectively). However, the single CEA values, measured on postoperative days 7 and 30, did not have more significance in DFS or OS in multivariate analysis when analyzed with R2 values. The CEA value on postoperative day 7 was significantly related to OS by multivariate analysis but was not found to be related to DFS, although it was significantly related to both by univariate analysis. The CEA value obtained on postoperative day 30 was significantly related to both OS and DFS by univariate analysis but not by multivariate analysis. We expected that postoperative CEA values would be less capable of providing prognostic information compared with exponential trend lines because they are representative of one point in time and because the effective postoperative sampling date and ideal cutoff value remain controversial. Furthermore, a single CEA value obtained after tumor resection has limited ability to reflect the change in tumor biology as our study showed that the postoperative day 7 CEA did not have any more significance in DFS by multivariate analysis with the R2 value.
The gradient, calculated from the exponential curve, did not have prognostic significance in DFS and OS in stages II and III rectal. In categorized evaluation of gradients, the rapid rate of decline was significantly related to high preoperative CEA values, which averaged 45.2 ± 1.25 ng/ml. Although there is no scientific evidence, there was some consideration of whether the rapid rate of CEA clearance would provide better oncologic outcomes. However, as our data showed, the rate of CEA clearance was not related to oncologic outcomes but was significantly related to the preoperative CEA value (P < 0.001). CEA clearance velocity is known to be significantly influenced by the liver function of individual patients;13 data suggest that one more factor, preoperative CEA value, influences the velocity of CEA clearance.
The limitations of our study are as follows: 1) the retrospective nature of the investigation comprised of a small patient population; 2) the limited number of data points of serum CEA levels. More postoperative CEA values would likely have resulted in greater significance of our results. Despite these limitations, it is apparent from our data that patients with random CEA clearance kinetics have poorer oncologic outcomes compared with those with exponential kinetics clearance. This study asserted the potential of serum CEA clearance as a useful prognostic tool based on clear evidence of biomolecular kinetics. The pattern of CEA clearance using perioperative serum changes may become an authentic and reliable prognostic method for predicting both OS and DFS rates in rectal cancer with the same clinical staging with the ultimate goal of designing more tailored antitumor therapies for individual patients.
Conclusions
Serial measurement of perioperative serum CEA clearance patterns during the preoperative and early and late postoperative periods are important indicators for both OS and DFS rates of patients with stage III rectal cancer with high preoperative CEA levels. If the serum CEA level is cleared via randomized kinetics, one must suspect the possibility of micrometastasis or the regrowth of remnant tumors due to the failure of complete tumor resection and consider intensive follow-up or the addition of adjuvant chemotherapy or radiation therapy.
Acknowledgment
This work was supported by a grant from the Korea Health 21 R&D project, Ministry of Health and Welfare, Republic of Korea (0412-CR01-0704-0001, 0405-BC01-0604-0002).
Open Access
This article is distributed under the terms of the Creative Commons Attribution Noncommercial License which permits any noncommercial use, distribution, and reproduction in any medium, provided the original author(s) and source are credited.
References
- 1.Hutter RV. At last–worldwide agreement on the staging of cancer. Arch Surg. 1987;122:1235–1239. doi: 10.1001/archsurg.1987.01400230021002. [DOI] [PubMed] [Google Scholar]
- 2.Greene FL, Stewart AK, Norton HJ. A new TNM staging strategy for node-positive (stage III) colon cancer: an analysis of 50, 042 patients. Ann Surg. 2002;236:416–421. doi: 10.1097/00000658-200210000-00003. [DOI] [PMC free article] [PubMed] [Google Scholar]
- 3.Merkel S, Mansmann U, Papadopoulos T, et al. The prognostic inhomogeneity of colorectal carcinomas Stage III: a proposal for subdivision of Stage III. Cancer. 2001;92:2754–2759. doi: 10.1002/1097-0142(20011201)92:11<2754::AID-CNCR10083>3.0.CO;2-4. [DOI] [PubMed] [Google Scholar]
- 4.Ahnen DJ, Feigl P, Quan G, et al. Ki-ras mutation and p53 overexpression predict the clinical behavior of colorectal cancer: a Southwest Oncology Group study. Cancer Res. 1998;58:1149–1158. [PubMed] [Google Scholar]
- 5.Andreyev HJ, Norman AR, Cunningham D, et al. Kirsten ras mutations in patients with colorectal cancer: the ‘RASCAL II’ study. Br J Cancer. 2001;85:692–696. doi: 10.1054/bjoc.2001.1964. [DOI] [PMC free article] [PubMed] [Google Scholar]
- 6.McDermott U, Longley DB, Johnston PG. Molecular and biochemical markers in colorectal cancer. Ann Oncol. 2002;13:235–245. doi: 10.1093/annonc/mdf665. [DOI] [PubMed] [Google Scholar]
- 7.Han SJ, Yoo S, Choi SH, et al. Actual half-life of alpha-fetoprotein as a prognostic tool in pediatric malignant tumors. Pediatric Surg Int. 1997;12:599–602. doi: 10.1007/BF01371908. [DOI] [PubMed] [Google Scholar]
- 8.Walhof CM, Van Sonderen L, Voûte PA, et al. Half-life of alpha-fetoprotein in patients with a teratoma, endodermal sinus tumor, or hepatoblastoma. Pediatric Hematol Oncol. 1988;5:217–227. doi: 10.3109/08880018809031272. [DOI] [PubMed] [Google Scholar]
- 9.D’Amico AV, Moul JW, Carroll PR, et al. Surrogate end point for prostate cancer-specific mortality after radical prostatectomy or radiation therapy. J Natl Cancer Inst. 2003;95:1376–1383. doi: 10.1093/jnci/djg043. [DOI] [PubMed] [Google Scholar]
- 10.Spiess PE, Lee AK, Leibovici D, et al. Presalvage prostate-specific antigen (PSA) and PSA doubling time as predictors of biochemical failure of salvage cryotherapy in patients with locally recurrent prostate cancer after radiotherapy. Cancer. 2006;107:275–280. doi: 10.1002/cncr.21979. [DOI] [PubMed] [Google Scholar]
- 11.Choi JS, Min JS. Significance of postoperative serum level of carcinoembryonic antigen (CEA) and actual half life of CEA in colorectal cancer patients. Yonsei Med J. 1997;38:1–7. doi: 10.3349/ymj.1997.38.1.1. [DOI] [PubMed] [Google Scholar]
- 12.Arnaud JP, Koehl C, Adloff M. Carcinoembryonic antigen (CEA) in diagnosis and prognosis of colorectal carcinoma. Dis Colon Rectum. 1980;23:141–144. doi: 10.1007/BF02587615. [DOI] [PubMed] [Google Scholar]
- 13.Behr TM, Sharkey RM, Juweid MI, et al. Factors influencing the pharmacokinetics, dosimetry, and diagnostic accuracy of radioimmunodetection and radioimmunotherapy of carcinoembryonic antigen-expressing tumors. Cancer Res. 1996;56:1805–1816. [PubMed] [Google Scholar]
- 14.Fletcher RH. Carcinoembryonic antigen. Ann Intern Med. 1986;104:66–73. doi: 10.7326/0003-4819-104-1-66. [DOI] [PubMed] [Google Scholar]
- 15.Yoshimasu T, Maebeya S, Suzuma T, et al. Disappearance curves for tumor markers after resection of intrathoracic malignancies. Int J Biol Markers. 1999;14:99–105. doi: 10.1177/172460089901400207. [DOI] [PubMed] [Google Scholar]
- 16.Harrison LE, Guillem JG, Paty P, et al. Preoperative carcinoembryonic antigen predicts outcomes in node-negative colon cancer patients: a multivariate analysis of 572 patients. J Am Coll Surg. 1997;185:55–59. doi: 10.1016/s1072-7515(97)00012-4. [DOI] [PubMed] [Google Scholar]
- 17.Moertel CG, O’Fallon JR, Go VL, et al. The preoperative carcinoembryonic antigen test in the diagnosis, staging, and prognosis of colorectal cancer. Cancer. 1986;58:603–610. doi: 10.1002/1097-0142(19860801)58:3<603::AID-CNCR2820580302>3.0.CO;2-K. [DOI] [PubMed] [Google Scholar]
- 18.Slentz K, Senagore A, Hibbert J, et al. Can preoperative and postoperative CEA predict survival after colon cancer resection? Am Surg. 1994;60:528–531. [PubMed] [Google Scholar]
- 19.Wolmark N, Fisher B, Wieand HS, et al. The prognostic significance of preoperative carcinoembryonic antigen levels in colorectal cancer. Results from NSABP (National Surgical Adjuvant Breast and Bowel Project) clinical trials. Ann Surg. 1984;199:375–382. doi: 10.1097/00000658-198404000-00001. [DOI] [PMC free article] [PubMed] [Google Scholar]
- 20.Park YA, Lee KY, Kim NK, et al. Prognostic effect of perioperative change of serum carcinoembryonic antigen level: a useful tool for detection of systemic recurrence in rectal cancer. Ann Surg Oncol. 2006;13:645–650. doi: 10.1245/ASO.2006.03.090. [DOI] [PubMed] [Google Scholar]


