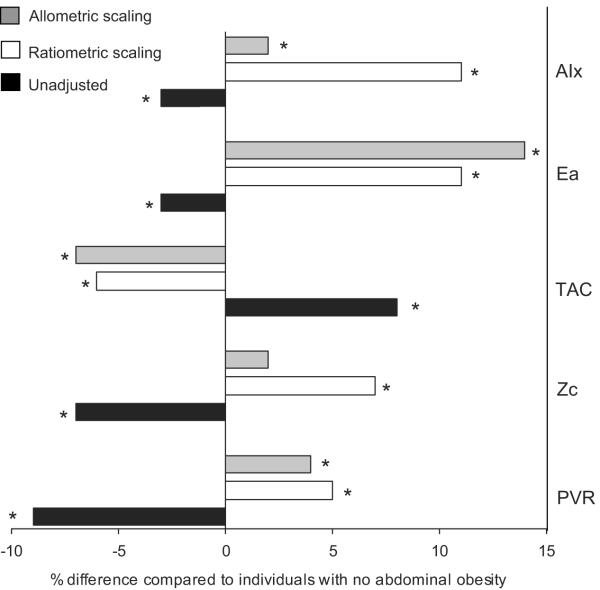
Figure 1.
The percentage difference in peripheral vascular resistance (PVR), characteristic impedance (Zc), total arterial compliance (TAC), arterial elastance (Ea) and augmentation index (AIx) in individuals with abdominal obesity compared to those without. Data obtained from Table 6 in Chirinos et al1. *P<0.05 compared to individuals without abdominal obesity. It is noticeable that the differences in arterial parameters between abdominal vs. no abdominal obesity are in the opposite direction when unadjusted vs. when scaled. Furthermore, apart from Zc, both ratiometric and allometric scaling successfully discriminated between lean and obese individuals.

