Abstract
Atomic force microscopy (AFM) was used to analyze the interactions between fibrinogen and model surfaces having different levels of water wettability. In contrast to most AFM studies, proteins were coupled to the substrate while model surface colloids were attached to the end of the AFM probe, thereby ensuring that proteins undergo only a single compression/decompression cycle. Similar values of adhesion force were observed between fibrinogen and all of the highly wettable surfaces, in the same manner, fibrinogen showed similar adhesion forces against all poorly wettable surfaces, with a step-like transition observed between the two groups. Relationships between the adhesion forces and loading rates were used to analyze the energy profiles involved in protein/surface interactions. Multiple energy barriers were found in the interaction of proteins with poorly-wettable surfaces while a single energy barrier was found for protein interactions with highly-wettable surfaces. Contact time-dependent adhesion data were fit to an exponential model and showed that the rate constants of the protein unfolding process on highly wettable surface were smaller at low loading rates, but increased rapidly to yield similar values as the poorly wettable surfaces at high loading rates. The activation energies of protein unfolding derived from the data offer insight into the role of surface wettability in affecting adhesion, conformational changes and ultimately the activity of proteins at biomaterial surfaces.
Introduction
Protein adsorption onto biomaterial surfaces has been recognized as a critical early event during the interaction of blood with implanted biomaterials, as adsorbed proteins mediate a variety of biological responses including blood platelet adhesion and thrombus formation on surfaces.1–3 Fibrinogen is the most third abundant protein plasma in blood and plays a prominent role in development of surface-induced thrombosis due to its multi-functional role in serving as a ligand for platelet adhesion, linking platelets together into aggregates and stabilizing thrombi by forming a fibrin polymer.4–6 Fibrinogen is a ligand for the platelet integrin receptor αIIbβ3 (GPIIb/IIIa) and the interaction between this ligand/receptor is responsible for immobilization, activation, and aggregation of platelets.7–9 An improved understanding of the initial biological response, particularly with regard to fibrinogen, is important for the development and application of new blood contacting biomaterials.
Surface properties of implanted materials are a critical determinant of protein adsorption and the biological response to biomaterials.1,10,11 Surface wettability (hydrophobicity/hydrophilicity) is an important parameter that affects not only protein adsorption but also the subsequent structural and biological activity of the proteins, thereby affecting platelet adhesion/activation and blood coagulation.6,12–16 Generally poorly wettable (hydrophobic) surfaces are considered to be more protein-adsorbent than highly wettable (hydrophilic) surfaces due to the strong hydrophobic forces found near these surfaces.17 Previously, we used atomic force microscopy (AFM) to measure adhesion forces between proteins and a series of low density polyethylene (LDPE) surfaces possessing a range of surface wettability. These results illustrated a stark transition between protein adherent and protein non-adherent materials that occurred in the range of water contact angles 60–65°.18 Sethuraman et al. also observed a similar step change in protein adhesion on various self-assembled monolayer surfaces.19 This range is consistent with the appearance of hydrophobic interactions.20 However, it is still not clear how surface wettability affects protein interactions with surfaces in terms of the protein structure/function changes that ultimately drive the biological response.
Protein adhesion and conformation/activity are time-dependent processes mediated by surface chemistry and wettability. The process can involve relatively large energy scales and dynamic conformational reorientation following contact the surface.21–24 Several groups have addressed the energy profiles in the processes of protein adsorption and its conformational changes. The Santore group found an activation energy of 23–28 kT for fibrinogen adsorption on hydrophobic surface.25,26 We measured the time-dependent adhesion forces of fibrinogen to LDPE surfaces and obtained an unfolding energy of 18–23 kT on hydrophobic surfaces, and suggested a 2-step reorientation model, with the first step being very rapid and involving rearrangement of protein surface amino acids and the second step taking much longer and involving rearrangement of internal amino acids.18
AFM has been used to examine the interaction forces between proteins and surfaces at the nN scale by either modifying AFM probes with the protein of interest27 or by utilizing a protein-coated colloid.28 These interaction force measurements can also be extended to address the dynamic response by changing the time between initial contact and subsequent separation of the probe from surface.29 However, it has also been shown that the measured interaction force is dependent on several parameters used in the AFM experiment, including the loading force and loading rate.30,31 Furthermore, in the above techniques the protein is generally attached to the probe and therefore undergoes repeated compression and decompression cycles. Although we are not aware of any studies that directly address this problem, the potential exists for erroneous conclusions based on measurements of a protein that changes conformation during the experiment. In the work described herein, we utilized a colloidal AFM probe to study the influences of several physical parameters on fibrinogen interactions with surfaces. The colloid probes were modified with self-assembled monolayers (SAMs) to produce surfaces with a variety of wettability values, while the proteins were immobilized to the underlying substrate and only one force measurement was performed at any single location, ensuring that proteins were perturbed only one time during the force measurements. We utilized these measurements to address the energy landscapes for fibrinogen interactions with both hydrophobic and hydrophilic surfaces. These results provide new insights into the fundamental interactions between proteins and surfaces and the effects of surface wettability on protein structure/function.
Materials and Methods
Colloids and surfaces
Glass beads (~4 µm, Polyscience, PA) and polystyrene (PS) microspheres (4.5 µm, Polyscience, PA) were used as the colloids and attached to tipless AFM probes. In some cases, glass beads were modified with SAMs to produce a variety of surfaces having different degrees of water wettability. Round glass coverslips (15 mm diameter, Ted Pella, CA) were used as substrates for protein immobilization. All glass beads and coverslips were cleaned in chloroform for 30 min and rinsed with fresh chloroform three times, then rinsed with Millipore water three times prior to use or any subsequent modifications.
Modification of colloids with self-assembled monolayers
Surface modification of colloid probes was performed for the 4 µm glass beads only, and was done using one of three types of alkylsiloxane SAMs: 3-aminopropyltrichlorosilane (APS), n-butyltrichlorosilane (BTS) and octadecyltrichlorosilane (OTS). The colloid probes were cleaned in a glow discharge plasma for 30 min, and then incubated in either 1% APS in ethanol, 1% BTS in chloroform, and 1 % OTS in chloroform, for 1 hr. The probes were rinsed with the respective solvent and allow to air dry. The extent of surface modification of the colloids was estimated by making contact angle measurements on witness samples. These samples were 15 mm diameter glass coverslips modified by the same procedures as used for the colloid probes.
Preparation of colloid AFM probes
The colloid probe was prepared by gluing either a modified or unmodified glass bead/PS microsphere to a tipless silicon nitride cantilever (NP-OW, Veeco, CA) with an epoxy (DEVCON epoxy S-31/31345). A drop of solution containing clean beads was placed on a mica surface and the beads were allowed to spread and dry on the surface under a N2 gas stream. A small drop of epoxy was spread into a thin layer using N2 gas, and the epoxy was placed onto the end of cantilever by dipping the cantilever into the epoxy and then retracting. An optical microscope was used to position the cantilever over a single bead and the cantilever was then lowered into contact with the colloid. The colloid-modified cantilever was placed into a clean container overnight while the epoxy cured. All probes were tested against bare glass samples prior to use in any protein experiment, and probes that showed any strange force curves, including higher than expected background forces, were discarded.
Contact angle measurements
The water wettability of the colloid surface was determined by sessile drop measurements of the advancing water contact angle (θ) on witness samples. Measurements were made using a Krüss contact angle goniometer with 18 MΩ Millipore water as a probe liquid. Advancing contact angles were measured by a minimum of eight independent measurements and are presented as mean ± standard deviation.
Immobilization of fibrinogen to glass coverslip surfaces
Glass coverslips were treated by glow discharge plasma at 100 W power for 30 min and then incubated in a 1% (v/v) solution of aminopropyltriethoxysilane (Gelest Inc, PA) in ethanol for 1 hr to provide reactive amine groups on the surface. After thoroughly rinsing with Millipore water, the coverslips were reacted with 10% glutaraldehyde in aqueous solution for 1 hr and were again rinsed with Millipore water. Finally these coverslips were incubated in fibrinogen solution (250 µg/ml) in PBS for 1 hr. This attachment method has been shown to provide sufficient mobility and flexibility for proteins to rotate and orient themselves for binding32,33. The coverslips were rinsed six times with PBS to remove any non-chemically coupled proteins and used for measurements immediately and without any drying.
Spring constant measurements
The spring constants of cantilevers (all taken from the same wafer) were determined using the thermal tuning method (Nanoscope V6.12r2) using a multimode AFM with a PicoForce attachment and Nanoscope IIIa control system (Veeco Instruments, Santa Barbara, CA).
AFM Measurements
All AFM force measurements were performed under Phosphate Buffered Saline (PBS) using a Multimode AFM equipped with a Nanoscope IIIa controller system (Veeco Instruments, Santa Barbara, CA). The vertical scan rates varied from 0.05 Hz to 29.7 Hz in order to yield the desired loading rates. Loading rate (rf) was defined as the product of retraction velocity and spring constant of cantilever. The instrument was set for a fixed deflection threshold so that the loading force applied on surface could be calculated. In order to study the effects of contact time on adhesion forces, a delay in probe turnaround was implemented using the standard AFM software. The delay time was defined as the time between the loading force reaching the final desired value and the time that the probe begins retraction. Force measurements were performed with delay times ranging from 0–20 s at 20–30 random locations on each sample. Only one force curve was obtained at any location on the sample.
Data analysis
The adhesion force was calculated from the distance between the zero deflection value to the point of maximum deflection during probe separation from the surface. The relationship between adhesion force and the logarithm of loading rate can be used to determine the energy landscape profile for receptor/ligand bonds.34,35 Here, we use this same analysis method to explore the energy profiles for interactions of proteins with surfaces. Based on the Bell model,36 the most probable unbinding force (reflected by the adhesion force), F, versus ln(rf), follows the equation as described below 31,35,37,38
| (1) |
where kB is the Boltzman constant, T is the absolute temperature, koff is the thermal off-rate at zero force, and χβ is the effective distance between the bound and transition states along the direction of applied force
Quantitative evaluation of the change in adhesion forces with contact time was used to evaluate the dynamics of the protein unfolding process during the period of contact, which was modeled by a simple exponential of the form:
| (2) |
where Fe is the adhesion force at equilibrium, F0 is an empirical coefficient related to the initial interaction force, t is the contact time, and ks is the rate constant determined by regression using the commercial software Microcal Origin 6.0. The rate constant (ks) was used to calculate the activation energy for unfolding of the protein by using the Arrhenius equation:
| (3) |
where Ea is the activation energy for protein unfolding and A(T) is a prefactor of 107–109 s−1.25
Results and Discussion
Surface wettability of model surfaces
The surface wettability of a variety of modified surfaces was determined by water contact angle measurements, as shown in Table 1. The BTS and OTS produced the most hydrophobic surfaces (θ>90°), while the APS surface was more hydrophilic with water contact angle of 57°. Polystyrene after glow discharge plasma treatment for 30 min became more hydrophilic; the corresponding water contact angle decreased from 82° to 22°. Based on our previous results,18 we designate PS, BTS and OTS as hydrophobic, protein-adherent materials and glass, plasma-treated PS and APS as hydrophilic, non-adherent surfaces.
Table 1.
Surface wettability of colloid surface
| Colloid surface | Glass (bare) |
PS (plasma treated) |
APS | PS | BTS | OTS |
|---|---|---|---|---|---|---|
| Contact angle (°) | 11.3±1.7 | 22.3±1.6 | 57.2±1.7 | 82.2±1.5 | 90.4±1.2 | 103.0±1.9 |
| Wettability | Highly Wettable | Poorly Wettable | ||||
Adhesion forces between fibrinogen and surfaces
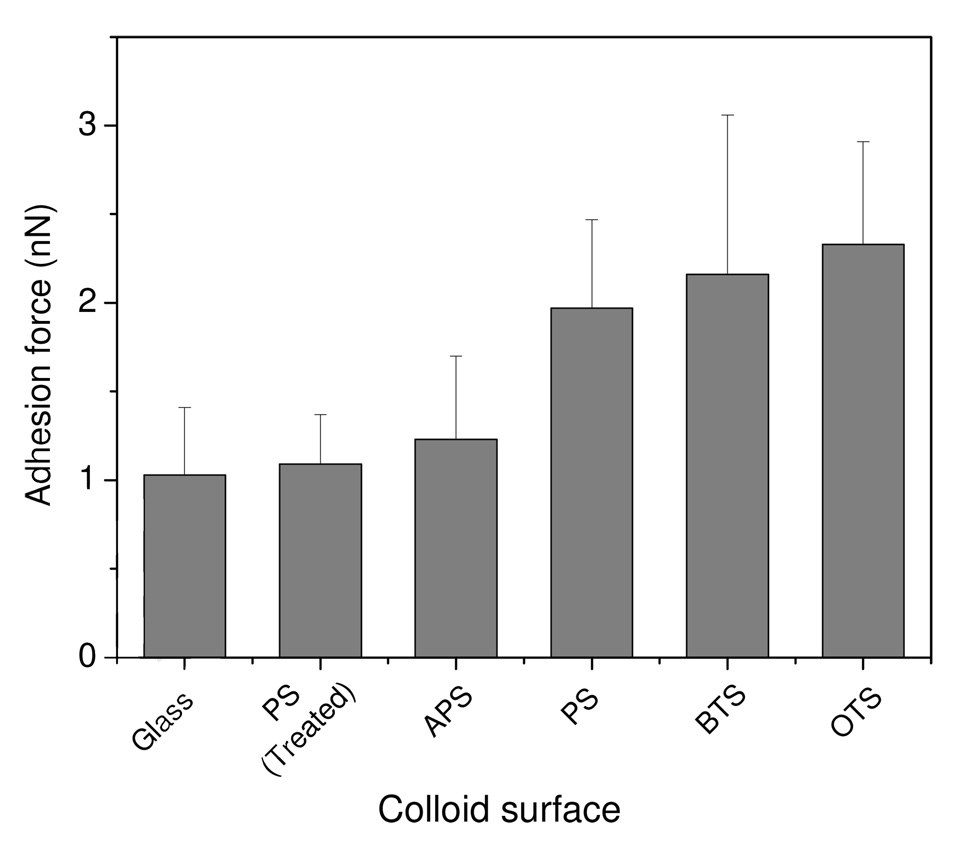
A series of background experiments were conducted to verify that the modified experimental approach of utilizing protein on the substrate with the test surface on the probe yields similar results for the effects of surface wettability that we had previously observed.18 Under conditions of the same loading force and loading rate, larger adhesion forces were consistently observed on the poorly wettable (more hydrophobic) surfaces than on the more wettable surfaces (Figure 1), as expected, due to the presence of attractive hydrophobic forces.20,39 Furthermore, the adhesion forces were remarkably similar between fibrinogen and the surfaces having contact angle <60° with an average adhesion force of 1.1 nN. Similarly, the adhesion forces between fibrinogen and poorly wettable surfaces (PS, BTS and OTS) were also found to be similar with a mean value of 2.2 nN. Thus, once again we observe a step-like transition in the protein-surface adhesion forces with water contact angles, suggesting that this new configuration with proteins on the surface rather than on the probe yields similar results to our earlier work.
Figure 1.
Adhesion forces between colloid surface and fibrinogen.
Effect of loading force on adhesion forces between fibrinogen and surfaces
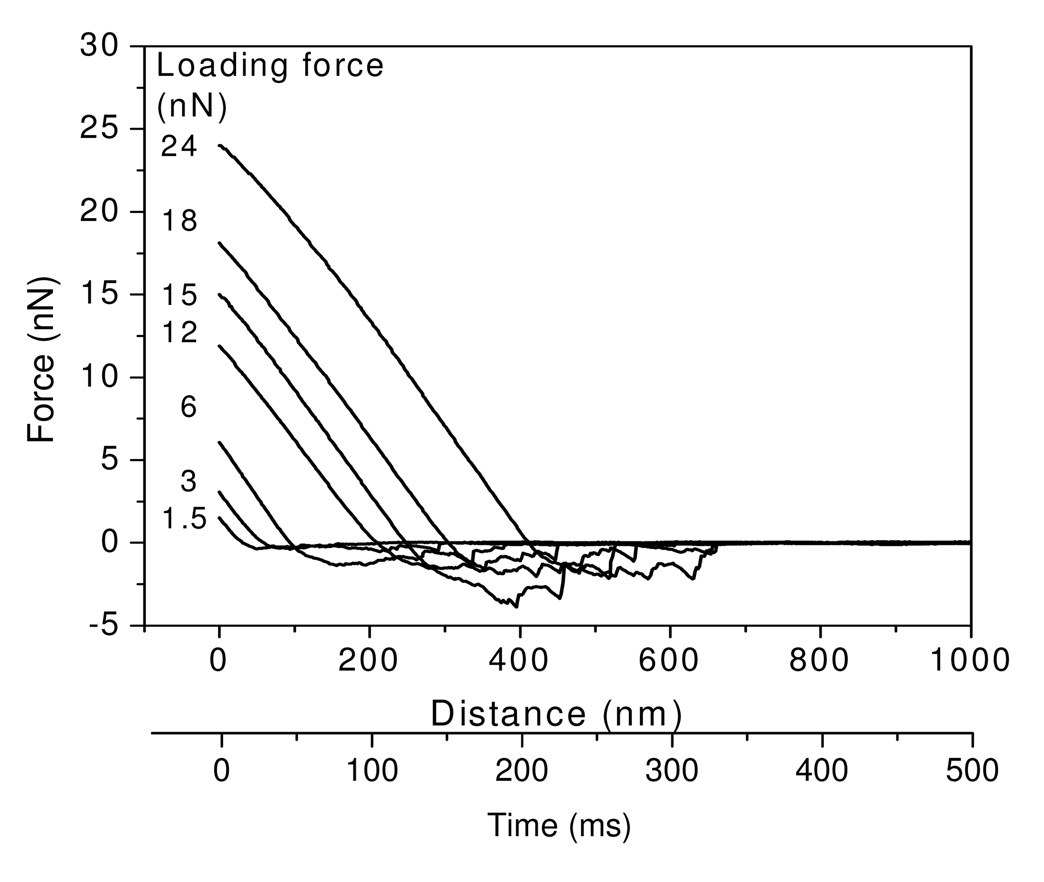
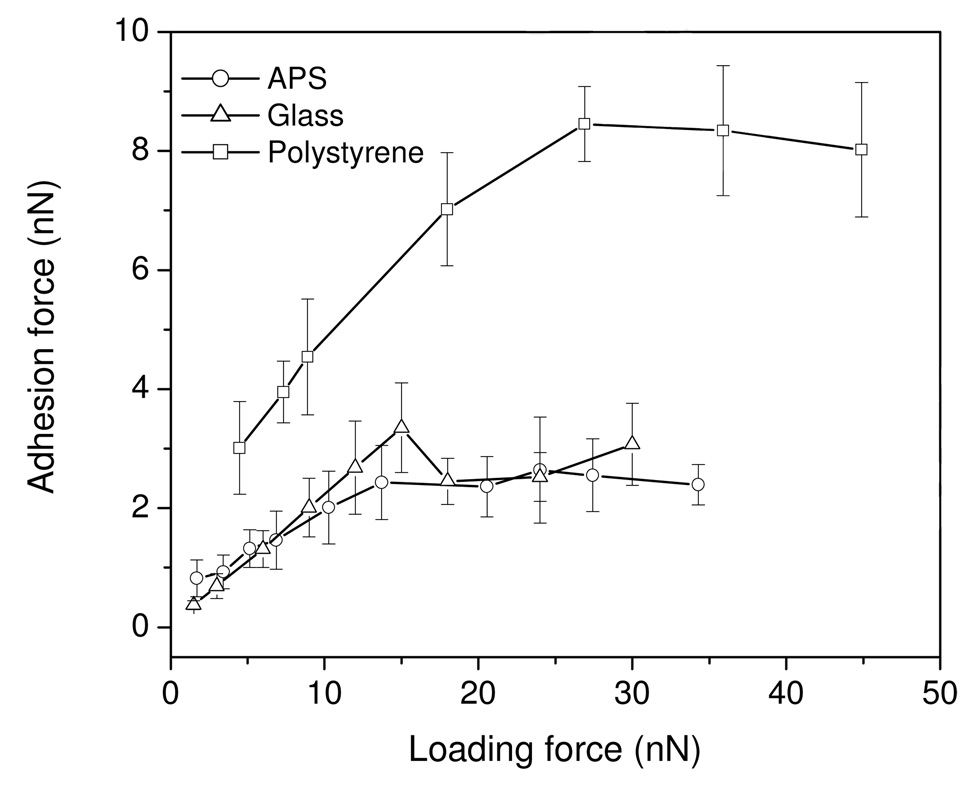
Regardless of colloid surface wettability, the adhesion forces between fibrinogen and colloid surfaces increased with increases in applied loading force. However, adhesion forces approached a maximum after loading forces reached a value that was dependent on the surface chemistry. Representative examples of retraction force curves for glass colloid and fibrinogen measured under peak loading forces of 1.5 – 24 nN at a fixed cantilever velocity are shown in Figure 2, and demonstrate the trends for increased adhesion forces with loading forces. The second x-axis is shown to indicate the contact time when the probe underwent retraction and separation from the surface. The retraction force curves indicated that the adhesion force increased by as much as 10 times when the loading force increased from 1.5 to 15 nN, while the adhesion forces dropped to 2.1 nN and 2.2 nN as the peak loading forces were further increased to 18 and 24 nN, although it should be noted that the total contact time was extended by ~400 ms in this case. Similar trends were also observed for the other surfaces. The mean adhesion forces between fibrinogen and three of these test surfaces (glass, APS and polystyrene) measured under different loading forces are illustrated in Figure 3. Results show that the maximum adhesion forces were obtained at the loading forces of 15, 24, and 27 nN, on above three surfaces, respectively. Comparing the forces among the surfaces, similar magnitudes of adhesion forces are observed for the hydrophilic (water contact angle < 60°) glass and APS surfaces, while much larger adhesion forces were measured on the polystyrene surface.
Figure 2.
Representative retraction force curves between glass colloid probes and fibrinogen under different loading forces at a fixed velocity of cantilever of 2µm/s.
Figure 3.
Effects of loading force on the adhesion between fibrinogen and colloid surfaces.
Effect of loading rate on adhesion forces between fibrinogen and surfaces
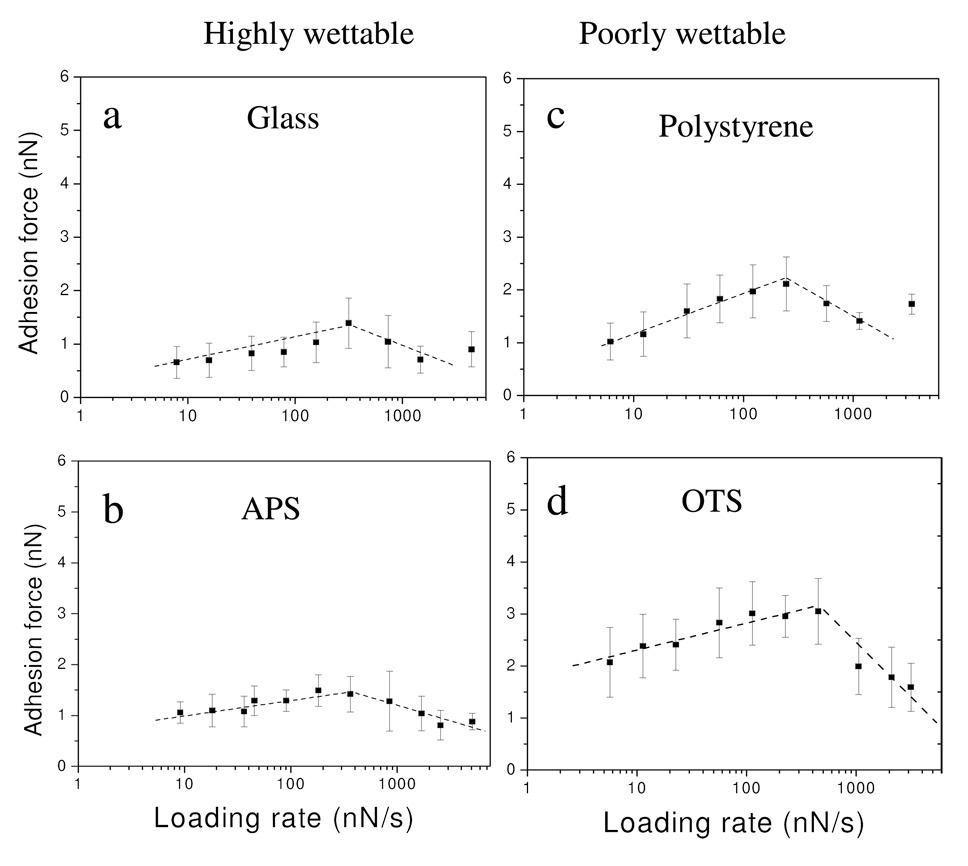
As the interactions between proteins and surface are non-covalent and possess dynamic, time dependent properties, the strength measured by AFM is dependent on the loading rate.34,40 Examining the dynamic properties of protein/surface interactions through measurement of the adhesion force as a function of the loading rate is useful in exploring the energy profiles in interactions of protein/surface. The effect of loading rate on the adhesion of fibrinogen to the colloid surfaces was investigated under two conditions: residence time = 0 s and residence time = 1 s. At residence time = 0 s, the probe was brought into contact with the surface at a fixed loading rate and retracted from surface immediately (delay time =0 s) once the force applied on probe reached the desired value (~6 nN). In this case, the forces applied on probe ramping on surface are constantly changing with contact time. The adhesion forces between fibrinogen and the test surfaces, regardless of wettability, were found to increase linearly with the logarithm of the loading rate at lower loading rates (<200 nN/s); the adhesion force reached a maximum in the range of loading rates of 200–500 nN/s, and decreased thereafter (Figure 4).
Figure 4.
Adhesion forces between fibrinogen and colloid surfaces at different loading rates (residence time=0s). (a) glass, (b) APS, (c) polystyrene, and (d) OTS.
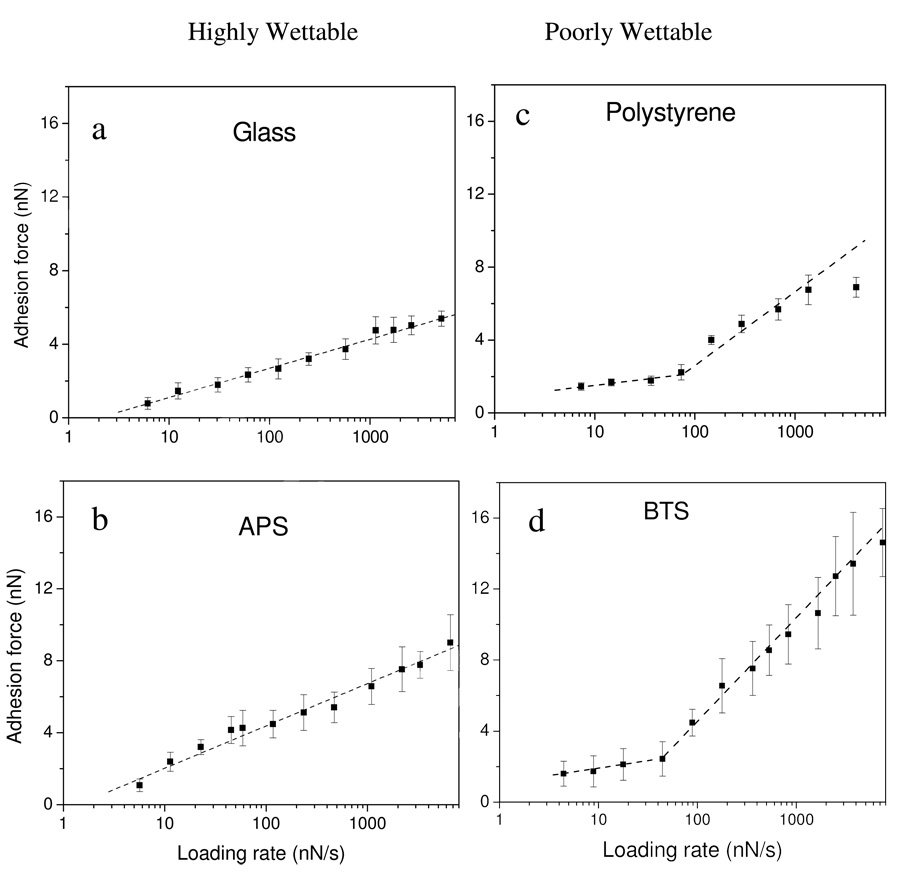
The second series of experiments were performed with a residence time of 1 s. In this case, the colloid probe resides on the test surface for 1 s under a constant loading force (~6 nN in these experiments) before beginning to retract. A linear relationship between adhesion forces and ln(rf) on all highly wettable (hydrophilic) surfaces was observed (Figs. 5a and 5b), while two line segments with ascending slopes were observed on all poorly wettable (hydrophobic) surfaces (Figs. 5c and 5d). The two distinct linear regions suggest that there are multiple energy barriers and transition states present in the interaction of fibrinogen with the hydrophobic surfaces, while the linear plots indicated a single energy barrier for interactions between proteins and hydrophilic surfaces. This dynamic force spectroscopy data was quantitatively analyzed by plotting the adhesion force against ln(rf) and solving for the variables in equation (1). Information on the dissociation of the complex, including koff and the binding lifetime τ (=1/koff), were derived and are summarized in Table 2. Comparing the off-rates (koff) for both surfaces, the quantitative analysis shows that the lifetime of protein interactions with hydrophobic surfaces is in the range of 3–10 fold higher than that seen on hydrophilic surfaces. This result is consistent with the higher adhesion forces that are measured on the hydrophobic surfaces.
Figure 5.
Adhesion forces of fibrinogen and colloid surfaces under different loading rates (residence time=1s). (a) glass, (b) APS, (c) polystyrene, and (d) BTS.
Table 2.
Bell model parameters from fitting of equation (1)
| Colloid Surface | Loading rate (nN/s) |
koff (s−1) |
τ (s) |
|
|---|---|---|---|---|
| Highly wettable |
Glass | 6–5100 | 2.92 | 0.34 |
| PS (plasma treated) |
6–3100 | 1.99 | 0.50 | |
| APS | 5–6500 | 1.35 | 0.74 | |
| Poorly wettable |
PS | 6–100 | 0.23 | 4.35 |
| 100–4100 | 4.98 | 0.20 | ||
| BTS | 4–100 | 0.19 | 5.12 | |
| 100–7400 | 5.50 | 0.18 | ||
| OTS | 5–100 | 0.42 | 2.38 | |
| 100– 3200 | 13.8 | 0.07 | ||
The different trends in adhesion forces as a function of loading rates at residence time =0 s and 1 s demonstrate the importance of contact time in these dynamic force spectroscopy experiments. Generally, the contact time between protein and surface will decrease with increasing loading rate. With a residence time = 0 s, for example, the protein still has a surface contact time of approximately 1200 ms, 24 ms, and 2.4 ms at loading rates of 10, 500, and 5000 nN/s, respectively. At sufficiently high loading rates, it appears that the decrease in contact time leads to poor adhesion between protein and surface, as shown by the drop in adhesion forces at higher loading rates. An alternative explanation for the decrease in adhesion force at higher loading rates in the absence of any probe time delay is the potential for the measurements to be affected by hydrodynamic drag forces. To test this, we calculated the drag forces present when the cantilever is near the surface. Under low Reynolds number conditions (Re<1), the hydrodynamic drag force (Fd) on the colloid approaching a flat surface can be calculated as:41
| (4) |
where η is the viscosity of buffer, ν is the velocity of cantilever, b is the radius of bead and a is the distance between the bead and the flat surface. As the dimensions of fibrinogen are about 45 × 5 × 5 nm, the longest possible separation distance between the bead and the glass surface would be about 45 nm (i.e., a = 45nm in eq 4). Calculation of the hydrodynamic drag force at the height of protein layer varies over the range of 0.02 – 0.13 nN for the higher loading rates of 500 nN/s – 4000 nN/s. The hydrodynamic forces therefore appear to contribute only 1–10 % of the adhesion force measured at these higher loading rates. This is consistent with the observation of Lo et al.,40 who found that hydrodynamic drag did not have a significant effect on the cantilever deflection for force measurements obtained at loading rates up to 8000 nN/s. Experimental measurements of these colloid probes with protein-free glutaraldehyde-modified surfaces show low background deflection/forces at all of the rates measured. Together, these theoretical and experimental observations suggest that the drop in adhesion forces at high loading forces is primarily due to the short contact times found in the measurement, and is not a result of hydrodynamic drag forces, and furthermore this result suggests that the early interactions between proteins and surfaces require some finite period of time for protein conformational changes to occur.
Effect of contact time on adhesion forces between fibrinogen and surfaces
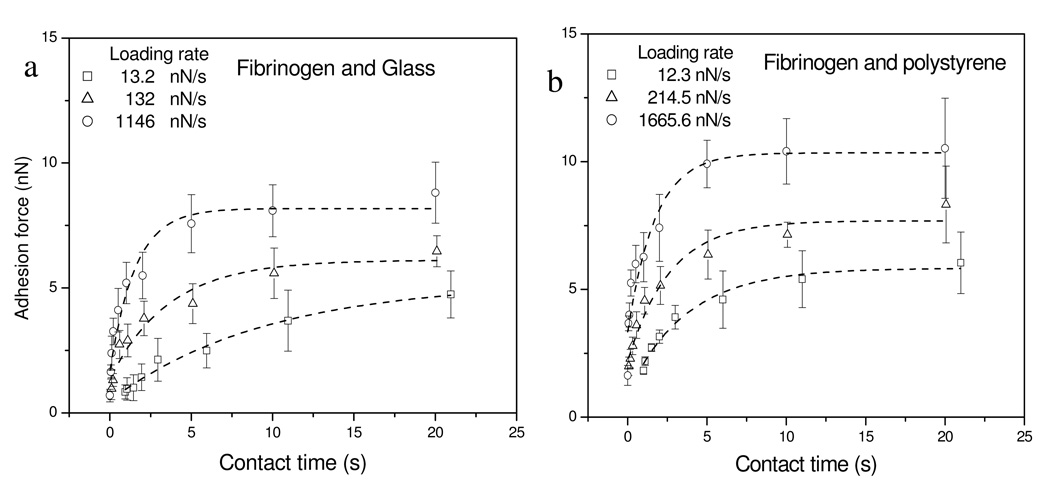
The time-dependence of protein-surface adhesion was further investigated on highly wettable (hydrophilic) glass and poorly wettable (hydrophobic) polystyrene colloid surfaces by increasing the residence times up to 20 s at fixed loading rates. Here contact time is measured between the point where protein initially contacts with colloid surface in extending and the point where protein separates from surface in retraction. The average adhesion forces against contact time are summarized in Figure 6. Again, both wettable and poorly-wettable surfaces showed larger adhesion forces for the same contact time when higher loading rates were used. In all cases, the adhesion forces between protein and surfaces were found to increase with increasing protein-surface contact time until a plateau is reached, similar to the results observed on the low-density polyethylene surfaces.18 The observation demonstrates the effects of time-dependent changes in proteins, strongly suggesting that there are adsorption-induced conformational changes that stabilize the protein-surface interaction. However, recall that in these experiments the protein is physically held in contact with the surface. While such a situation may seem a reasonable approximation for hydrophobic surfaces, this may not be a realistic view of the interactions of hydrophilic surfaces with proteins where the driving forces for partitioning of protein to the surfaces are much weaker.
Figure 6.
Average adhesion forces between fibrinogen and colloid surfaces with varying contact times. (a) glass, and (b) polystyrene. Curves illustrate fit of the exponential model described in Eq. (2) to the experimental data.
Increasing the contact time allows the proteins additional opportunity for reorientation; on hydrophobic surfaces this would presumably involve moving hydrophobic amino acids from the interior core of the protein to the surface. In this study proteins were immobilized on substrate surface and perturbed only one time when a colloid approached, significantly different than numerous compression/decompression cycles that proteins experience when they are attached to the AFM probes.29,42 We have previously observed experimental evidence that proteins on hydrophobic surfaces undergo a 2 stage spreading process, the first step being the interaction of external amino acids of the protein with the surface, and the second step being movement of hydrophobic amino acids from the core to the hydrophobic interface. These new results showing 2 steps involved in interactions of proteins with hydrophobic surfaces are consistent with our earlier, direct observations of conformational changes in individual fibrinogen molecules on hydrophobic highly ordered pyrolitic graphite.43
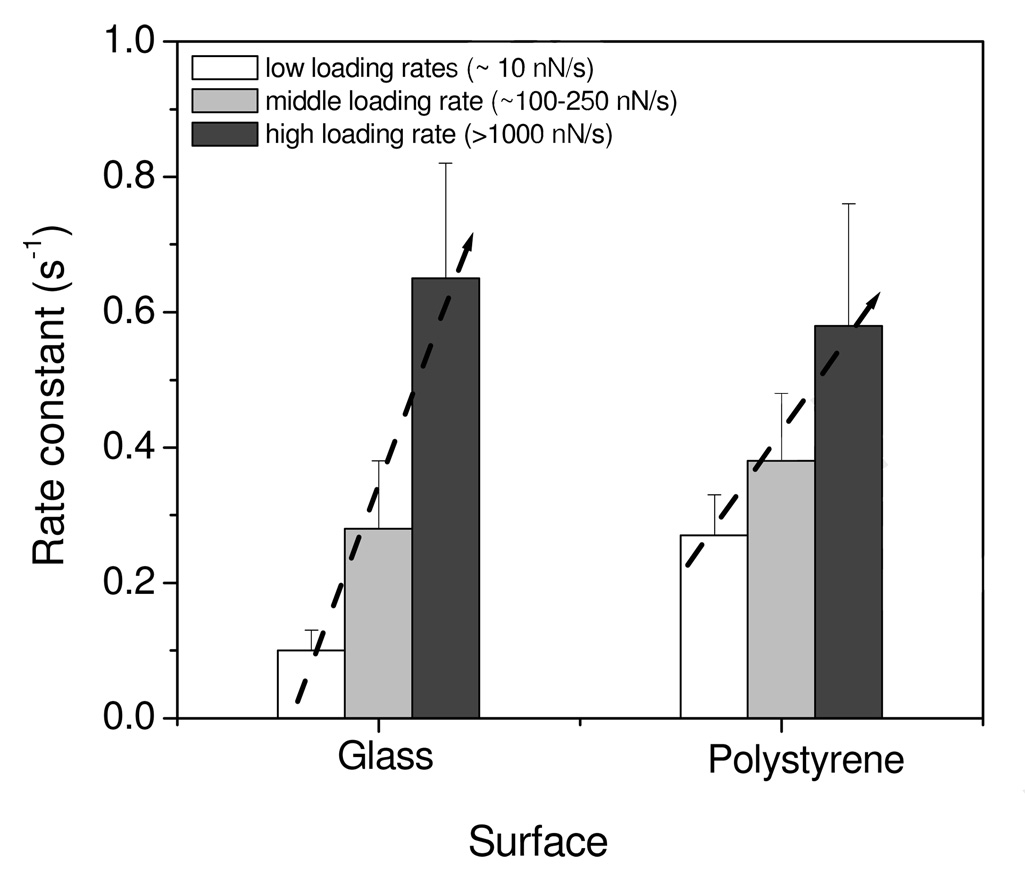
The exponential model in equation (2) yielded good fits to the data in Figure 6 with R2 values ≥ 0.93. The fitting parameters shown in Table 3 suggested the unfolding processes of protein on surfaces measured by AFM were affected by the applied loading rates. The rate constants for protein unfolding process on surfaces increased with the loading rates, regardless of surface wettability. Comparing the rate constants between two kinds of surfaces, however, the highly-wettable surface generally produced smaller rate constants than the poorly-wettable surfaces across the entire range of loading rates. The data shows that the change in rate constants as a function of loading rates on the highly-wettable surfaces was much faster than that on the poorly wettable surfaces, indicated by the slope of lines in Figure 7. At low loading rates (~10 nN/s), the rate constant for poorly-wettable surface is about 3-fold that of the wettable surface. At the mid-range loading rates (100–200 nN/s), the rate constant for poorly-wettable surface is only slightly more than that for the wettable surface, while at high loading rates (>1000 nN/s), the rate constants for both surfaces are similar. Application of these rate constants into the Arrhenius equation utilizing temperature-dependent prefactors of 107–109 25 yields quantitative values for the energies of unfolding of fibrinogen on these surfaces as listed in Table 3. The energies varied over the range of 15–23 kT, consistent with the values measured on the polyethylene surfaces in our previous study,18 although these numbers are slightly lower than the values measured by the Santore group using total internal reflection fluorescence that yielded activation energies of 23–28 kT.26
Table 3.
Fitting parameters from exponential model and calculated unfolding energies (Ea)
| Surface | Loading rate (nN/s) |
Fe (nN) | F0 (nN) | ks(s−1) | Ea (kT) | R2 |
|---|---|---|---|---|---|---|
| Glass | 13 | 5.2±0.5 | 4.8±0.4 | 0.10±0.03 | 18.4–23.0 | 0.98 |
| 132 | 6.1±0.5 | 4.8±0.5 | 0.28±0.10 | 17.4–22.0 | 0.94 | |
| 1146 | 8.2±0.5 | 6.5±0.6 | 0.65±0.17 | 15.7–21.2 | 0.95 | |
| Polystyrene | 12 | 5.8±0.2 | 4.9±0.4 | 0.27±0.06 | 17.4–22.0 | 0.98 |
| 215 | 7.7±0.4 | 5.5±0.4 | 0.38±0.10 | 17.1–21.7 | 0.96 | |
| 1665 | 10.3±0.6 | 7.0±0.7 | 0.58±0.18 | 16.7–21.3 | 0.93 | |
Figure 7.
Rate constants for protein unfolding processes on glass and polystyrene surfaces measured under different loading rates regimes.
The trends between rate constants and loading rates also implied there are different energy barriers for the interactions between proteins and hydrophobic/hydrophilic surfaces. Due to the presence of multiple energy barriers, poorly wettable surfaces produced only a small change in rate constants with loading rates. The wettable surface produced relatively larger changes since only a single energy barrier is present. It was somewhat surprising that similar rate constants were seen at high loading rates on both types of surfaces. At this point, nothing in the data allows us to determine whether this is an effect of decreased bond formation at the higher rates or whether the energy applied by the probe during compression is somehow altering the kinetics of the system.
Conclusions
The adhesion forces between fibrinogen and surfaces having different water wettabilities were measured as functions of loading force, loading rate, and contact time. In a variation from the normal AFM methods, proteins were attached to a substrate while a colloidal probe was used as the model material surface, thereby ensuring that each protein undergoes only a single compression/decompression cycle. Similar adhesion forces were observed on all of the highly wettable surfaces; while larger adhesion forces were measured against all the poorly wettable surfaces, exhibiting a step dependence on the wettability of surfaces. Protein adhesion forces were found to increase with the loading force initially and reached a maximum at a loading force dependent on surface properties. These results strongly suggest that the adhesion forces of fibrinogen on surfaces are mediated by water and the stability of proteins on these material surfaces. Through the analysis of relationships between loading rates and adhesion forces, multiple energy barriers were found in the interactions of proteins with poorly wettable surfaces while a single energy barrier was found for proteins on the highly wettable surfaces. The lifetime of binding between proteins and highly wettable surfaces was found to be much shorter than that of proteins on poorly wettable surfaces, consistent with the low strength of the adhesion forces measured. Increasing contact time increased adhesion forces, indicating that conformational changes in these proteins occurred following interactions with synthetic surfaces. Calculated activation energies of protein unfolding were consistent with the results in previously published studies. The analysis of these energies helps in understanding the role that surface wettability has in controlling protein interactions with biomaterial surfaces and offers insight into the fundamental processes that occur when proteins contact a surface.
Acknowledgements
The authors would like to acknowledge Dr. Bruce Logan for assistance with modification of colloid AFM probes and measurements of spring constant of cantilevers. The authors acknowledge financial support for this work provided by the National Institutes of Health (RO1 HL69965), the National Science Foundation (DMR-0804873), the Dorothy Foehr Huck and J. Lloyd Huck Institutes of the Life Sciences and by a grant from the Pennsylvania Department of Health. The Pennsylvania Department of Health specifically disclaims responsibility for any analyses, interpretations or conclusions
References
- 1.Horbett TA. Cardiovascular Pathology. 1993;2:S137–S148. [Google Scholar]
- 2.Montdargent B, Letourneur D. Infection Control and Hospital Epidemiology. 2000;21:404–410. doi: 10.1086/501782. [DOI] [PubMed] [Google Scholar]
- 3.Roach P, Eglin D, Rohde K, Perry CC. Journal of Materials Science-Materials in Medicine. 2007;18:1263–1277. doi: 10.1007/s10856-006-0064-3. [DOI] [PubMed] [Google Scholar]
- 4.Geer CB, Rus IA, Lord ST, Schoenfisch MH. Acta Biomaterialia. 2007;3:663–668. doi: 10.1016/j.actbio.2007.03.004. [DOI] [PubMed] [Google Scholar]
- 5.Hantgan RR, Francis CW, Mardner VJ. Fibrinogen structure and physiology. In: Colman RW, Hirsh J, Marder VJ, Salzman EW, editors. Hemostasis and Thrombosis: Basic Priciples and Clinical Practice. 3rd ed. Philadelphiia: J.B. Lippincott Company; 1994. pp. 277–300. [Google Scholar]
- 6.Evans-Nguyen KM, Fuierer RR, Fitchett BD, Tolles LR, Conboy JC, Schoenfisch MH. Langmuir. 2006;22:5115–5121. doi: 10.1021/la053070y. [DOI] [PubMed] [Google Scholar]
- 7.Goodman SL, Cooper SL, Albrecht RM. Journal of Biomedical Materials Research. 1993;27:683–695. doi: 10.1002/jbm.820270516. [DOI] [PubMed] [Google Scholar]
- 8.Hussain MA, Agnihotri A, Siedlecki CA. Langmuir. 2005;21:6979–6986. doi: 10.1021/la046943h. [DOI] [PubMed] [Google Scholar]
- 9.Rodrigues SN, Goncalves IC, Martins MCL, Barbosa MA, Ratner BD. Biomaterials. 2006;27:5357–5367. doi: 10.1016/j.biomaterials.2006.06.010. [DOI] [PubMed] [Google Scholar]
- 10.Wang YX, Robertson JL, Spillman WB, Claus RO. Pharmaceutical Research. 2004;21:1362–1373. doi: 10.1023/b:pham.0000036909.41843.18. [DOI] [PubMed] [Google Scholar]
- 11.Castner DG, Ratner BD. Surface Science. 2002;500:28–60. [Google Scholar]
- 12.Hylton DM, Shalaby SW, Latour RA. Journal of Biomedical Materials Research Part A. 2005;73A:349–358. doi: 10.1002/jbm.a.30295. [DOI] [PubMed] [Google Scholar]
- 13.Choee JH, Lee SJ, Lee YM, Rhee JM, Lee HB, Khang G. Journal of Applied Polymer Science. 2004;92:599–606. [Google Scholar]
- 14.Steiner G. Analytical Chemistry. 2007;79:1311–1316. doi: 10.1021/ac061341j. [DOI] [PubMed] [Google Scholar]
- 15.Vogler EA. Journal of Biomedical Materials Research. 1995;29:1005–1016. doi: 10.1002/jbm.820290813. [DOI] [PubMed] [Google Scholar]
- 16.Evans-Nguyen KM. Langmuir. 2005;21:1691–1694. doi: 10.1021/la047303h. [DOI] [PubMed] [Google Scholar]
- 17.Sagvolden G, Giaever I, Feder J. Langmuir. 1998;14:5984–5987. [Google Scholar]
- 18.Xu L-C, Siedlecki CA. Biomaterials. 2007;28:3273–3283. doi: 10.1016/j.biomaterials.2007.03.032. [DOI] [PMC free article] [PubMed] [Google Scholar]
- 19.Sethuraman A, Han M, Kane RS, Belfort G. Langmuir. 2004;20:7779–7788. doi: 10.1021/la049454q. [DOI] [PubMed] [Google Scholar]
- 20.Yoon RH, Flinn DH, Rabinovich YI. Journal of Colloid and Interface Science. 1997;185:363–370. doi: 10.1006/jcis.1996.4583. [DOI] [PubMed] [Google Scholar]
- 21.Lee SJ, Park K. Journal of Vacuum Science & Technology a-Vacuum Surfaces and Films. 1994;12:2949–2955. [Google Scholar]
- 22.Buijs J, Hlady V. Journal of Colloid and Interface Science. 1997;190:171–181. doi: 10.1006/jcis.1997.4876. [DOI] [PMC free article] [PubMed] [Google Scholar]
- 23.Dupont-Gillain CC, Fauroux CMJ, Gardner DCJ, Leggett GJ. Journal of Biomedical Materials Research Part A. 2003;67A:548–558. doi: 10.1002/jbm.a.10092. [DOI] [PubMed] [Google Scholar]
- 24.Fang F, Satulovsky J, Szleifer I. Biophysical Journal. 2005;89:1516–1533. doi: 10.1529/biophysj.104.055079. [DOI] [PMC free article] [PubMed] [Google Scholar]
- 25.Santore MM, Wertz CF. Langmuir. 2005;21:10172–10178. doi: 10.1021/la051059s. [DOI] [PubMed] [Google Scholar]
- 26.Wertz CF, Santore MM. Langmuir. 2002;18:706–715. [Google Scholar]
- 27.Kidoaki S, Matsuda T. Colloids and Surfaces B-Biointerfaces. 2002;23:153–163. [Google Scholar]
- 28.Xu LC, Logan BE. Langmuir. 2006;22:4720–4727. doi: 10.1021/la053443v. [DOI] [PubMed] [Google Scholar]
- 29.Mondon M, Berger S, Ziegler C. Analytical and Bioanalytical Chemistry. 2003;375:849–855. doi: 10.1007/s00216-003-1751-2. [DOI] [PubMed] [Google Scholar]
- 30.Xu LC, Vadillo-Rodriguez V, Logan BE. Langmuir. 2005;21:7491–7500. doi: 10.1021/la0509091. [DOI] [PubMed] [Google Scholar]
- 31.Lu SQ, Ye ZY, Zhu C, Long M. Polymer. 2006;47:2539–2547. [Google Scholar]
- 32.Chowdhury PB, Luckham PF. Colloids and Surfaces a-Physicochemical and Engineering Aspects. 1998;143:53–57. [Google Scholar]
- 33.Agnihotri A, Siedlecki CA. Ultramicroscopy. 2005;102:257–268. doi: 10.1016/j.ultramic.2004.10.006. [DOI] [PubMed] [Google Scholar]
- 34.Merkel R, Nassoy P, Leung A, Ritchie K, Evans E. Nature. 1999;397:50–53. doi: 10.1038/16219. [DOI] [PubMed] [Google Scholar]
- 35.Marshall BT, Sarangapani KK, Lou JH, McEver RP, Zhu C. Biophysical Journal. 2005;88:1458–1466. doi: 10.1529/biophysj.104.050567. [DOI] [PMC free article] [PubMed] [Google Scholar]
- 36.Bell GI. Science. 1978;200:618–627. doi: 10.1126/science.347575. [DOI] [PubMed] [Google Scholar]
- 37.Yu JP, Jiang YX, Ma XY, Lin Y, Fang XH. Chemistry-an Asian Journal. 2007;2:284–289. doi: 10.1002/asia.200600230. [DOI] [PubMed] [Google Scholar]
- 38.Liu C, Jiang Z, Zhang Y, Wang Z, Zhang X, Feng F, Wang S. Langmuir. 2007;23:9140–9142. doi: 10.1021/la7013804. [DOI] [PubMed] [Google Scholar]
- 39.Berg JM, Eriksson LGT, Claesson PM, Borve KGN. Langmuir. 1994;10:1225–1234. [Google Scholar]
- 40.Lo YS, Zhu YJ, Beebe TP. Langmuir. 2001;17:3741–3748. [Google Scholar]
- 41.Craig VSJ, Neto C. Langmuir. 2001;17:6018–6022. [Google Scholar]
- 42.Hemmerle J, Altmann SM, Maaloum M, Horber JKH, Heinrich L, Voegel JC, Schaaf P. Proceedings of the National Academy of Sciences of the United States of America. 1999;96:6705–6710. doi: 10.1073/pnas.96.12.6705. [DOI] [PMC free article] [PubMed] [Google Scholar]
- 43.Agnihotri A, Siedlecki CA. Langmuir. 2004;20:8846–8852. doi: 10.1021/la049239+. [DOI] [PubMed] [Google Scholar]


