Abstract
Disease biomarkers play critical roles in the management of various pathological conditions of diseases. This involves diagnosing diseases, predicting disease progression and monitoring the efficacy of treatment modalities. While efforts to identify specific disease biomarkers using a variety of technologies has increased the number of biomarkers or augmented information about them, the effective use of disease-specific biomarkers is still scarce. Here, we report that a high expression of protein tyrosine kinase 7 (PTK7), a transmembrane receptor protein tyrosine kinase-like molecule, was discovered in a series of leukemia cell lines using whole cell aptamer selection. With the implementation of a two-step strategy (aptamer selection and biomarker discovery), combined with mass spectrometry, PTK7 was ultimately identified as a potential biomarker for T-cell acute lymphoblastic leukemia (T-ALL). Specifically, the aptamers for T-ALL cells were selected using the cell-SELEX process, without any prior knowledge of the cell biomarker population, conjugated with magnetic beads and then used to capture and purify their binding targets on the leukemia cell surface. This demonstrates that a panel of molecular aptamers can be easily generated for a specific type of diseased cells. It further demonstrates that this two-step strategy, that is, first selecting cancer cell-specific aptamers and then identifying their binding target proteins, has major clinical implications in that the technique promises to substantially improve the overall effectiveness of biomarker discovery. Specifically, our strategy will enable efficient discovery of new malignancy-related biomarkers, facilitate the development of diagnostic tools and therapeutic approaches to cancer, and markedly improve our understanding of cancer biology.
Keywords: Biomarker, Aptamer, Cancer cell, Membrane Protein
Introduction
The field of biomarker discovery owes its remarkable advancement to the combination of mass spectrometry (MS) and two-dimensional gel electrophoresis (2D-GE), which enables investigators to analyze the whole cell proteome and identify cell-specific proteins. However, the most under-represented group in proteome analysis remains membrane proteins. Since an estimated 30% of proteins consist of membrane proteins and since only less than 5% of this total is recognized by 2D-GE-MS, a serious limitation arises.1 To address this limitation, we have developed a novel strategy for the specific recognition and detection of cancer cells, and we have used it to identify cell-specific membrane markers. In contrast to conventional methods of biomarker discovery, such as 2D-GE-MS, we generate molecular probes that are highly specific for cancer cells. The rationale behind this strategy is that molecular level differences exist between any two given types of cells. Hence, locating and identifying these differences will result in the generation of cell-specific molecular signatures for effective cell marker discovery.
As noted above, we accomplish this by implementing a cell-based SELEX (Systematic Evolution of Ligands by Exponential Enrichment) strategy2 that first generates a group of aptamers (designer DNA/RNA probes) to specifically recognize an individual cancer cell type. Using cell-SELEX, we have been able to generate a panel of aptamers for the molecular recognition of diseased cells. Aptamers are single-stranded DNAs or RNAs that have high affinity and selectivity for the target molecules.3 These probes are then utilized to facilitate extraction and purification of the membrane markers on the cancer cells. The approach therefore represents an effective and realistic method of discovering novel disease biomarkers. Particularly, the identification of the membrane targets is realized through routine affinity chromatography coupled with mass spectrometry. Targets of aptamers are usually pure molecules, such as proteins and small molecules. Recently, more complex biological species, including red blood cell membranes, live trypanosomes and whole cells, have also been used as targets in SELEX.4-9 Two significant protein targets of such aptamers have now been confirmed, tenascin-C and human receptor tyrosine kinase RET; the cell lines used for selection were previously known to express the target proteins at high level.8,9 It is worth noting that, even before the identification of the cell-specific membrane biomarkers, aptamer probes are already available for the recognition of these molecules and for the detection of the corresponding disease cells, which greatly expedites the clinical application of the newly discovered markers.
Using our cell-based SELEX strategy, a group of DNA aptamers were generated for a T-cell acute lymphoblastic leukemia (T-ALL) cell line, CCRF-CEM.2 A series of cultured cell lines and clinical patient samples were tested for recognition by the selected aptamers.2,10 One of the selected aptamers, sgc8, showed high specificity and affinity for surface target on most of the T-ALL cells and acute myeloid leukemia (AML) cells, as well as some B-cell acute lymphoblastic leukemia (B-ALL) cells. However, sgc8 did not show a comparable detectable level of binding to either lymphoma cells or normal human bone marrow cells. The elevated expression of the target of sgc8 on leukemia cells, especially on T-ALL cells and AML cells, seems, therefore, to imply its importance in the development of leukemia and, significantly, to indicate, as well, a cell-specific membrane biomarker. In this paper, this biomarker was subsequently determined and confirmed to be protein tyrosine kinase-7 (PTK7), a receptor protein tyrosine kinase-like molecule.
PTK7, also known as colon carcinoma kinase-4 (CCK-4), contains a catalytically inactive tyrosine kinase domain. PTK7 was first identified by the cloning of its cDNA fragment obtained from normal melanocyte mRNAs.11 It was later found to be highly expressed on colon carcinoma tissues, and the full-length cDNA of CCK-4 (PTK7) was cloned from such tissues.12 Since PTK7 is defective in several motifs important for kinase activity, it is presumed to also lack catalytic activity. However, it has been suggested that PTK7 might have a tumor characteristic role, that is, as a signal amplifier or modulator.13 Further, it was recently reported that mRNA levels of PTK7 were higher in CD34+ hematopoietic progenitors and in AML samples compared to bone marrow samples.13 In contrast, the expression of PTK7 was found to be decreased or lost in metastastic melanomas.14 Deletions of chromosome 6p, where the human PTK7 gene is located (6p21.1), were frequently found in a number of cancers. The exact functions of PTK7 in different tumors still remain unclear.
Experimental Procedures
Cell Lines and Reagents
CCRF-CEM (CCL-119, T-cell lines, human acute lymphoblastic leukemia), Ramos (CRL-1596, B-cell line, human Burkitt’s lymphoma), Jurkat (TIB-152, human acute T cell leukemia), Molt-4 (CRL-1582, T-cell lines, human acute lymphoblastic leukemia), Sup-T1(CRL-1942, T-cell lines, human lymphoblastic leukemia) and Toledo (CRL-2631, B-cell line, human diffuse large cell lymphoma) were all obtained from ATCC (American type Culture Collection); NB-4 (acute promyelocytic leukemia) were obtained from the Department of Pathology, University of Florida). All the cells were cultured in RPMI 1640 medium (ATCC) supplemented with 10% fetal bovine serum (FBS) (heat inactivated, GIBCO) and 100 IU/mL penicillin-Streptomycin (Cellgro). Cells were washed before and after incubation with wash buffer (4.5 g/L glucose and 5 mM MgCl2 in Dulbecco’s phosphate buffered saline with calcium chloride and magnesium chloride (Sigma)). The binding buffer used for selection was prepared by adding yeast tRNA (0.1 mg/mL) (Sigma) and BSA (1 mg/mL) (Fisher) into the wash buffer to reduce background binding. Monoclonal anti-PTK7 antibody conjugated to R-phycoerythrin (PE) was purchased from Miltenyi Biotec, Inc. (Auburn, CA). Magnetic streptavidin beads were purchased from Dynal Biotech ASA (Oslo, Norway). Homo sapiens PTK7 transcript variant PTK7-1 transfection-ready DNA was purchased from OriGene Technologies, Inc. (Rockville, MD). Cell Line Nucleofector Kit V was purchased from Amaxa, Inc. (Gaithersburg, MD).
Oligodeoxynucleotide Probe Synthesis
Biotin-Rb1 (B-TACCCCTTTAATCCCAAACCC; B denotes biotin), a nonbinding sequence; Biotin-sgc8c (Biotin-S-S-S-S-ATCTAACTGCTGCGCCGCCGGGAAAATACTGTACGGTTAGA; S denotes an 18-atom ethylene glycol spacer); and Biotin-sgc3b (Biotin-S-S-ACTTATTCAATTCCTGTGGGAAGGCTATAGAGGGGCCAGTCTATGAATAAG) were synthesized according to the standard phosphoramidite chemistry on an ABI 3400 synthesizer. Oligonucleotide building blocks were obtained from Glen Research Corporation (Sterling, VA). Purification was performed twice for each oligonucleotide using RP-HPLC with the DMT-on mode on a Varian HPLC system.
Biomarker Purification and Identification
CCRF-CEM cells (4 × 10⁸ cells) were washed three times at 4 °C with a PBS buffer and lysed in 5 mL of hypotonic buffer [50 mM Tris-HCl (pH 7.5) containing protease inhibitors (0.1 mM PMSF and 2 μg/mL pepstatin, leupeptin, and aprotinin)] at 4 °C for 30 min. After centrifugation, the debris was washed three times with 5 mL of hypotonic buffer and dissolved in 1.5 mL of lysis buffer (PBS containing 5 mM MgCl2 and 1% Triton X-100) at 4 °C for 30 min. After centrifugation, the supernatant was incubated with 150 pmol nonbinding sequences of Biotin-Rb1 in the presence of 1000-fold excess of 88mer random DNA sequence library (150 nmol), as a nonspecific competitor, at 4 °C for 30 min. The protein—DNA complex was captured by incubating it with 2 mg (200 μL) of magnetic streptavidin beads at 4 °C for 15 min and collected on a magnet stand. The resulting supernatant was incubated with 150 pmol Biotin-sgc8c at 4 °C for 30 min, and the protein—sgc8c complex was captured by incubating it with 2 mg (200 μL) of magnetic streptavidin beads at 4 °C for 15 min and collected on a magnet stand. The resulting supernatant was incubated with 150 pmol Biotin-sgc3b at 4 °C for 30 min. The protein—sgc3b complex was captured by incubating it with 2 mg (200 μL) of magnetic streptavidin beads at 4 °C for 15 min and collected on a magnet stand. The collected magnetic beads were washed four times with 1 mL of PBS containing 5 mM MgCl2. The proteins were eluted by heating in 30 μL of loading buffer and analyzed by polyacrylamide gel electrophoresis (12%) (SDS-PAGE) stained with Colloidal Blue.
The aptamer-purified protein bands were excised and digested in situ and analyzed by QSTAR LC-MS/MS and a MASCOT database search at the Protein Chemistry Core Facility, University of Florida.
Flow Cytometric Analyses
A total of 5 × 10⁵ cells were incubated with excess anti-PTK7-PE and/or 200 nM FITC-labeled aptamer sgc8 in 200 μL of binding buffer (PBS containing 5 mM MgCl2, 4.5 g/L glucose, 0.1 mg/mL yeast tRNA, 1 mg/mL BSA and 20% FBS) on ice for 30 min. Cells were washed twice with 0.7 mL of binding buffer (with 0.1% NaN2) and suspended in 0.3 mL of binding buffer (with 0.1% NaN2). The fluorescence was determined with a FACScan cytometer (Becton Dickinson Immunocytometry Systems, San Jose, CA) and 30000-50000 events were measured for each cell sample. The FITC-labeled unenriched ssDNA library and PE-labeled IgG were used as negative controls.
For competition experiments, 5 × 10⁵ cells were incubated with 2 μM unlabeled sgc8 in binding buffer on ice for 20 min; then anti-PTK7-PE was added and incubated for 30 min. After washing, the fluorescence of anti-PTK7-PE was determined with a FACScan cytometer and compared with samples to which sgc8 had not been added.
Confocal Imaging of Cells Bound with Aptamer
A total of 1 × 10⁶ CCRF-CEM cells were incubated with 50 nM FITC-labeled aptamer sgc8 and 10 μL of PE-labeled anti-PTK7 in 200 μL of binding buffer containing 20% FBS on ice for 30 min. Cells were washed twice with 0.5 mL of binding buffer and suspended in 0.2 mL of binding buffer. Twenty microliters of cell suspension was dropped on a thin glass slide placed above a 60× objective on the confocal microscope and then covered with a coverslip. Imaging of the cells was performed on an Olympus FV500-IX81 confocal microscope (Olympus America, Inc., Melville, NY). A 5 mW 488 nm Argon ion laser was the excitation source throughout the experiments. The objective used for imaging was a PLAPO60XO3PH 60× oil immersion objective with a numerical aperture of 1.40 from Olympus (Melville, NY). FITC-labeled unselected Library and PE-labeled IgG, which does not bind to CCRF-CEM cells, were used as control.
PTK7 Gene Transfection
A total of 2-4 μg of plasmid DNA containing full-length cDNA of PTK7 (Vector: pCMV6-XL4) was transfected into 2 × 10⁶ Ramos and Toledo cells following the protocols of Cell Line Nucleofector Kit V. Positive control with vector pmaxGFP and 2 negative controls were used to assess the transfection efficiency. The transfected cells were analyzed by flow cytometry after 20 h.
Results and Discussion
To find cancer-specific cell membrane markers, we have used cell-SELEX to select aptamers against whole leukemia cells. Briefly, a T-cell acute lymphoblastic leukemia (T-ALL) cell line, CCRF-CEM, was incubated with a DNA library containing around 1015 single-stranded random DNA sequences.2 Sequences bound to the target cells were collected, while the unbound sequences were washed away. The collected sequences then passed through a counter-selection process where they were incubated with a control cell line (e.g., Ramos, a B-cell lymphoma cell line). Following that, the unbound DNAs were eluted and PCR amplified to form a new DNA pool. The counter-selection step is designed to ensure that only the sequences binding to the target cells, and not the control cells, will be enriched. The new DNA pool, with a better affinity for the target cells than the initial library, was incubated with the target cells again to start a new cycle of selection and counter-selection. This process was repeated for up to 20 cycles until a DNA pool with high affinity and good selectivity for the target cells was obtained. Progress of the enrichment of the aptamer candidates was monitored using both flow cytometry and confocal microscopy. The final DNA pool was sequenced, and a panel of aptamer sequences was determined. One of the aptamers with the highest affinity and specificity for the CCRF-CEM leukemia cells was named sgc8. Sgc8 was tested on normal bone marrow cells and a variety of hematopoietic cancer cells, including patient samples. Most of the leukemia cells closely related to the CCRF-CEM cells showed significant sgc8 binding; at the same time, almost all of the lymphoma cells and normal bone marrow cells showed only negligible fluorescence from dye-labeled sgc8 (Supporting Information, Table S1).2,10 This level of selectivity clearly indicated the presence of a highly specific molecular marker on the membrane of these leukemia cells.
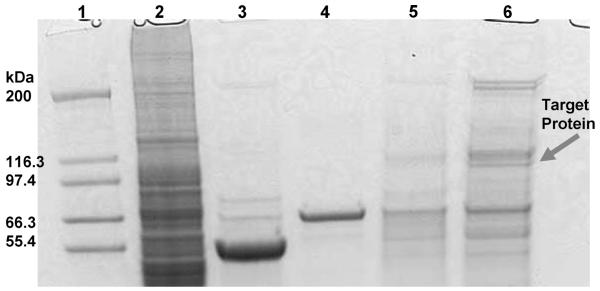
Since the CEM cells completely lost binding to sgc8 after being treated with trypsin or proteinase K, the target of sgc8 was demonstrated to be a membrane protein.2 On the basis of that finding, efforts were carried out to identify the target of sgc8. In short, CEM cells were lysed, and the membrane content was dissolved in PBS buffer containing surfactant. An optimized and truncated DNA sequence of sgc8, sgc8c, which had identical binding properties as sgc815 and which had previously been labeled with a biotin tag at the 5′-end, was incubated with the solubilized membrane proteins. The binding complex of sgc8 and its target was then extracted using streptavidin-coated magnetic beads. After washing, the streptavidin beads, along with the captured proteins, were heated in the loading buffer of SDS-PAGE, and the eluted proteins underwent subsequent separation by SDS-PAGE (Figure 1). By comparing to control experiments, characteristic protein bands on the gel captured by sgc8 were digested and supplied to LC-MS/MS QSTAR analysis. A MASCOT database search was used to assign possible protein candidates to the MS results. As shown in Table 1, the MS results produced a list of 25 protein hits. The first protein is a ribonucleoprotein which can bind nonspecifically to DNAs. PTK7 ranks no. 2 overall among these candidates and, importantly, is the only cell surface transmembrane protein. The rest of the candidates are mostly ribonucleoproteins, DNA binding proteins and Keratins. Keratins are common contaminations from skin and hair. They ranked lower in the list and did not affect the identification of PTK7.
Figure 1.
Colloidal Blue-stained SDS-PAGE (12%) used to analyze the aptamer-assisted target purification. Lane 1, molecular markers; lane 2, membrane extracts; lane 3, protein captured with the nonbinding sequence; lane 4, magnetic beads only; lane 5, protein captured with sequence sgc3b; lane 6, protein captured with aptamer sgc8c.
Table 1.
Mass Spectroscopy Analysis Result of the Potential Protein Markers
| protein | score | peptides matched | |
|---|---|---|---|
| IPI00003519 | 116 kDa U5 small nuclear ribonucleoprotein component | 1448 | 39 |
| IPI00174794 | Transmembrane receptor PTK7-5 | 948 | 18 |
| IPI00443612 | Hypothetical protein FLJ46843 | 636 | 12 |
| IPI00220327 | Keratin, type II cytoskeletal 1 | 510 | 9 |
| IPI00305068 | U5 snRNP-associated 102 kDa protein | 466 | 10 |
| IPI00167909 | Hypothetical protein FLJ35827 | 391 | 9 |
| IPI00021304 | Keratin, type II cytoskeletal 2 epidermal | 389 | 8 |
| IPI00009865 | Keratin, type I cytoskeletal 10 | 383 | 7 |
| IPI00019359 | Keratin 9 | 232 | 5 |
| IPI00293665 | Keratin, type II cytoskeletal 6B | 129 | 3 |
| IPI00013214 | DNA replication licensing factor MCM3 | 113 | 3 |
| IPI00420014 | U5 small nuclear ribonucleoprotein 200 kDa helicase | 109 | 4 |
| IPI00017451 | Splicing factor 3 subunit 1 | 79 | 3 |
| IPI00006725 | U5 snRNP 100 kD protein | 67 | 2 |
| IPI00013010 | Nedd-4-like E3 ubiquitin-protein ligase WWP2 | 66 | 3 |
| IPI00005859 | Cytokeratin type II | 61 | 2 |
| IPI00174775 | Keratin 6 irs3 | 57 | 2 |
| IPI00290078 | Keratin, type II cytoskeletal 4 | 57 | 2 |
| IPI00328293 | Serine\/arginine repetitive matrix 1 | 55 | 2 |
| IPI00099730 | RNA binding protein | 54 | 1 |
| IPI00328103 | Type I inner root sheath specific keratin 25 irs3 | 52 | 2 |
| IPI00015309 | Keratin, type I cytoskeletal 12 | 46 | 1 |
| IPI00332128 | 48 kDa protein | 39 | 1 |
| IPI00456887 | PREDICTED: similar to hypothetical protein | 34 | 1 |
| IPI00013721 | Serine/threonine-protein kinase PRP4 homologue | 33 | 1 |
Among the list of protein hits, PTK7-5 (an isoform of protein tyrosine kinase 7) received substantial attention for a number of reasons. First, it is a transmembrane receptor. Second, the size of the PTK7 (118 kDa) correlates well with the molecular weight obtained from the protein band on the SDS-PAGE gel. Also known as colon carcinoma kinase-4 (CCK-4), PTK7 was reported to have a high expression level in several tumors,11,12 but a reduced level in metastastic melanomas and some other cancers.13 PTK7 was also found to play a role in regulating planar cell polarity in vertebrates.16 PTK7 is also believed to be important in the signaling mechanism during cancer development and metastasis.17 However, its exact function is not clear, and there are no reports that have linked PTK7 overexpression to T-ALL cells.
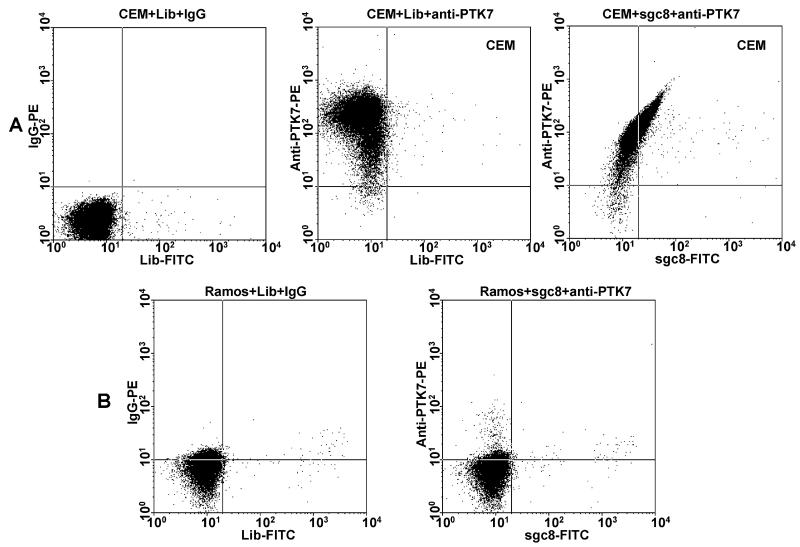
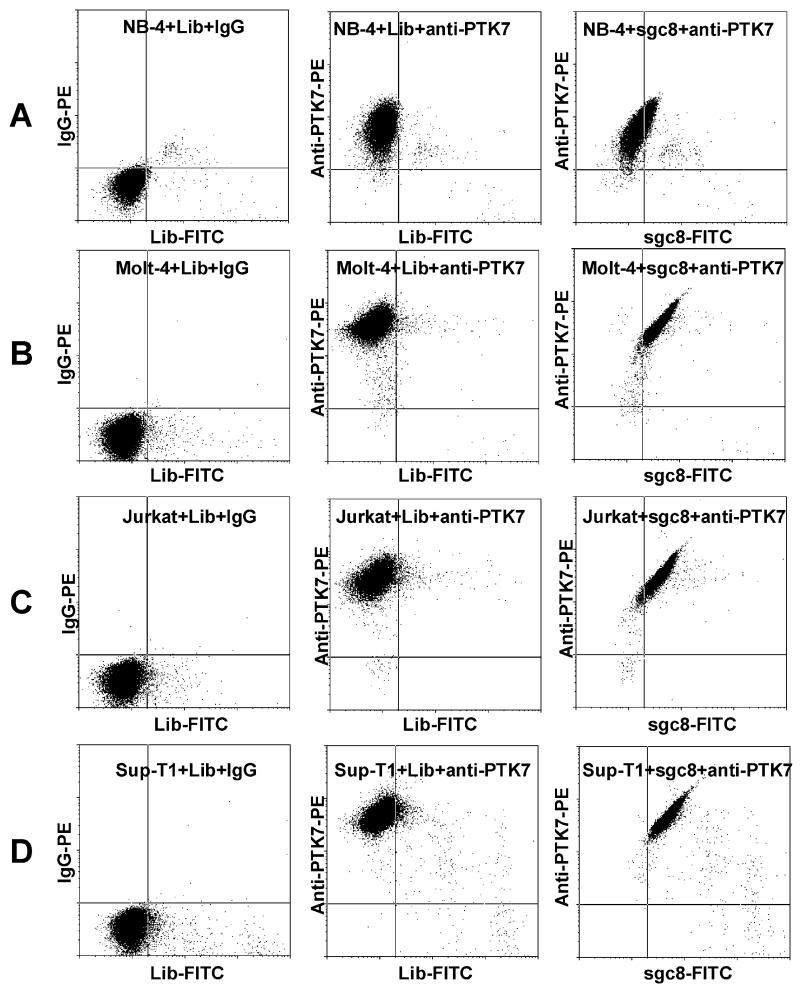
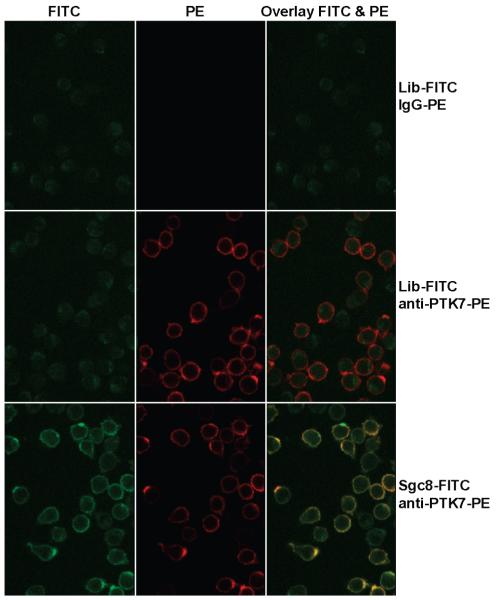
The presence of PTK7 on the CEM cells was first confirmed using the anti-PTK7 antibody labeled with an R-phycoerythrin (PE) dye (Figure 2). To evaluate the interaction between sgc8 and PTK7, excess unlabeled sgc8 was used to compete with anti-PTK7-PE for CEM cell binding. Interestingly, flow cytometry results showed no obvious change in anti-PTK7-PE binding (Figure 3), indicating that there was no competition between sgc8 and anti-PTK7. To further investigate the possibility of co-binding of sgc8 and the antibody on PTK7, the aptamer was labeled with a FITC fluorophore and incubated with CEM cells along with anti-PTK7-PE. A flow cytometry analysis of the cells was then conducted, and the resultant dot plot is shown in Figure 2. Fluorescence signals from the FITC and PE channels display a linear relationship. From this, we deduce the fact that cells with higher PTK7 expression also have better binding to sgc8. A possible explanation would either be that sgc8-FITC and anti-PTK7-PE can bind to two different sites of the extracellular domain of PTK7 simultaneously or that sgc8-FITC can bind to a molecule tightly associated with PTK7. Control experiments were performed by exchanging anti-PTK7-PE, or sgc8-FITC, with a different antibody or unselected DNA library, or by using a different cell line. In none of these cases was linearity seen (Figure 2). On the other hand, a few cell lines previously tested as having sgc8 binding did show a very similar linear relationship between FITC and PE signals from sgc8 and anti-PTK7, respectively (Figure 4) Similarly, sgc8-FITC and anti-PTK7-PE were incubated with CEM cells, and confocal microscopy was used to examine the binding to cells. As shown in Figure 5, fluorescence from FITC and PE channels were clearly present on the cell periphery, and colocalization of sgc8 and anti-PTK7 was evident. Changing sgc8-FITC to a FITC-labeled DNA library resulted in the loss of such colocalization, and only autofluorescence from the inside of cells was observed in the FITC channel (Figure 5).
Figure 2.
Flow cytometry assay of CEM (A, positive cells) and Ramos (B, negative cells) cells stained with anti-PTK7-PE and sgc8-FITC. FITC-labeled random DNA Library (Lib) and IgG-PE, which do not bind to cells, were used as negative control. A linear relationship was only shown on CEM cells stained with anti-PTK7-PE and sgc8-FITC (A, right).
Figure 3.
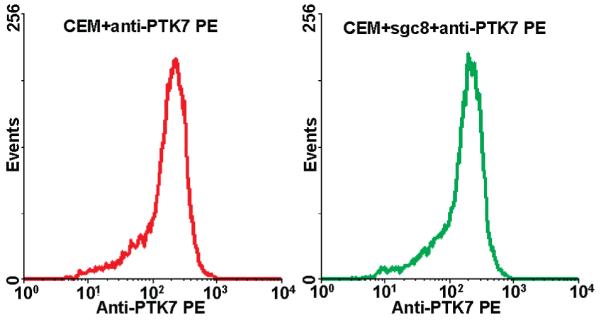
Absence of competition between anti-PTK7 and sgc8. Red curve, CEM cells binding with anti-PTK7-PE; green curve, CEM cells binding with anti-PTK7-PE after incubation with unlabeled sgc8 (2 μM). The Kd of sgc8 is 0.8 nM. High concentration of sgc8 did not affect the fluorescence intensity.
Figure 4.
Flow cytometry assay of leukemia cells stained with anti-PTK7-PE and sgc8-FITC. (A) Acute promyelocytic leukemia, NB-4; (B) human acute lymphoblastic leukemia (T-cell line), Molt-4; (C) human acute T cell leukemia, Jurkat; (D) human lymphoblastic leukemia (T-cell line), Sup-T1. FITC-labeled random DNA Library (Lib) and IgG-PE, which do not bind to cells, were used as negative control.
Figure 5.
Fluorescence confocal images of CCRF-CEM cells incubated with FITC-labeled aptamer sgc8 and PE-labeled anti-PTK7. FITC-labeled unselected Library (Lib-FITC) and PE-labeled IgG, which do not bind to CCRF-CEM cells, were used as control. Column 1 is the FITC channel, column 2 is the PE channel, and column 3 is the overlay of the two channels. Cells in row 1 were incubated with Lib-FITC (control) and IgG-PE (control). Cells in row 2 were incubated with Lib-FITC (control) and anti-PTK7-PE. Cells in row 3 were incubated with sgc8-FITC and anti-PTK7-PE.
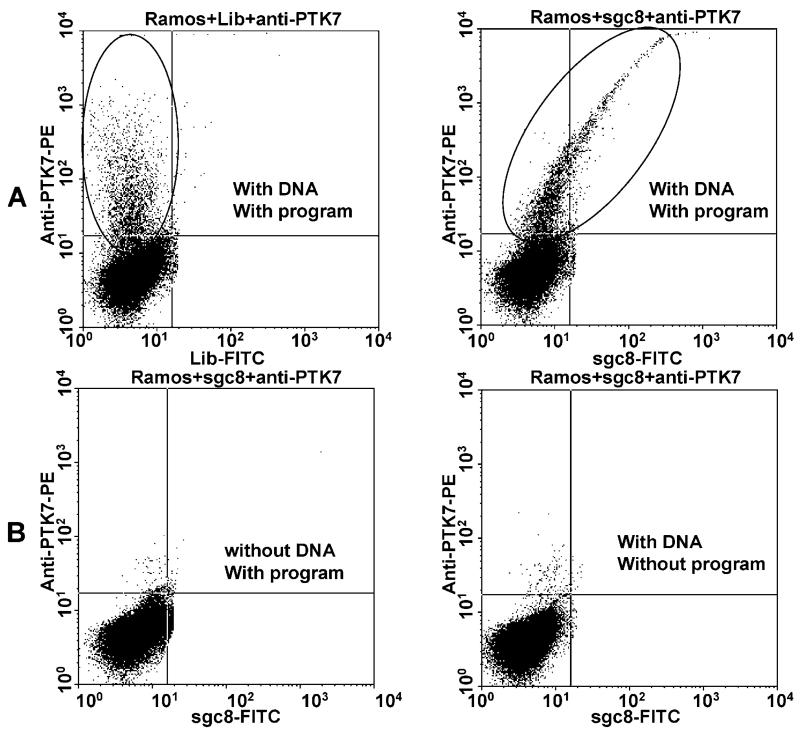
Additional experiments were performed to confirm the target of sgc8. The Ramos cells, which did not show any binding to sgc8, as shown in Figure 6, were transfected with cDNA of PTK7-1. The transfected Ramos cells were tested with FITC-labeled sgc8 and anti-PTK7-PE by flow cytometry (Figure 6). About 10% of the Ramos cells were found to express PTK7 after transfection. The transfection also resulted in sgc8 binding of the cells and a very similar linear relationship between FITC and PE signals, as previously seen on CEM cells. Another cell line, Toledo cells, which had no interaction with sgc8, was subjected to the same transfection procedures and gave results similar to those for Ramos cells. Additional evidence that PTK7 is the binding site of sgc8 was supported by internalization experiments of sgc8 and anti-PTK7 on target cells. At room temperature, these two were internalized to the same intracellular region, the endosome.18
Figure 6.
Flow cytometry assay of Ramos cells nucleofected with cDNA of PTK7. (A) Ramos cells nucleofected with plasma containing cDNA of PTK7: left, stained with anti-PTK7-PE; right, stained with anti-PTK7-PE and sgc8-FITC. The elliptical area represents the cells that expressed PTK7. (B) Negative control cells stained with anti-PTK7-PE and sgc8-FITC; left, Ramos cells without plasmid with nucleofection program; right, Ramos cells with plasmid without nucleofection program. The transfection efficiency is about 10%.
Our results with clinical patient samples also revealed considerable levels of specific sgc8 binding to leukemia cells closely related to CCRF-CEM cells (Supporting Information, Table 1).2,10 Other reports also demonstrated that the mRNA level of PTK7 was higher in acute myeloid leukemia samples.13 Therefore, a link between PTK7 overexpression and leukemia is clearly implied. Discovery of a commonly up-regulated molecular marker on these cells and the development of an excellent aptamer probe for it may therefore lead to effective and reliable diagnosis, as well as cell-specific delivery of therapeutic agents.
We have also used multiparametric flow cytometric analysis to detect the expression of PTK7 on nucleated cells of human bone marrow aspirates received in our laboratory. The PE-labeled anti-PTK7 monoclonal antibody (clone 188B) was used in combination with other monoclonal antibodies that recognize CD34, CD117, CD19, CD20, CD3, CD5, CD7, and CD71. PTK7 was expressed on CD34+ hematopoietic progenitor cells and a subset of AML cells. In addition, a subset of pre-T-ALL also expresses PTK7, even though these T lymphoblasts lack CD34. The maturing erythroid, granulocytic, monocytic and B-cell precursors, and mature B- and T-lymphocytes did not show significant expression of PTK7. Because PTK7 is not expressed in normal mature T cells, it is a useful marker for detecting marrow involvement by precursor T cell lymphoblastic leukemia. PTK7 could also be used as a potential biomarker for acute leukemia immunophenotyping and minimal residual disease detection.
Finally, it has been increasingly recognized that heterogeneity exists among individual patients such that even patients with the same type of cancer can have very different responses to cancer tests and therapies. This calls for personalized markers to match patients to the most reliable cancer diagnosis and guided treatments. To the extent that our new strategy provides a simple way of achieving cell-specific discovery of cell membrane markers from individual patients, the ongoing efforts toward personalized medicine have been advanced. That is, instead of attempting to elucidate all possible molecular fingerprints of whole cells, the cell-SELEX-based approach focuses on finding highly expressed molecular differences on cell membranes, which could result in significant improvement in the efficiency of identifying clinically practical cellular markers. In addition, the integration of probe selection and cell membrane marker discovery gives our approach extra advantages, as the time gap between laboratory results and clinical application can be greatly reduced.
Discussion
Using cell-SELEX is a completely different approach to biomarker discovery, and differs significantly from conventional methods. To briefly underscore the novelty of our approach, we would point out that, aside from the mass spectrometry-based studies, very few studies have addressed the process of systematically developing probes for disease-related biomarkers and biomarker discovery. The biomarker discovery technique that most closely resembles our own is phage-display based antibody production, where thousands of antibodies are tested in order to find potential disease-specific antigens. While powerful, this method is dependent on the fact that the purified target antigen must be available for testing these antibodies. It will be extremely difficult to apply this antibody-based method to discover new biomarkers on a cell surface without even knowing which proteins are expressed on the cell surface. It is not difficult to realize that monoclonal antibodies can be used as excellent probes if the biomarkers are known and the antigen proteins are available for testing these antibodies. There is no easy way to test a library of antibodies without a large array of purified protein antigens.
In contrast to conventional methods, the novelty of cell-SELEX-based biomarker discovery is rooted in its focus on finding specific cell membrane markers. Moreover, cell-SELEX does not need any prior information on the molecular contents of the cell surface. Trillions of random DNA sequences in the initial DNA library, combined with the unique negative selection strategy, ensure that any disease marker molecules on cell membranes can be identified whether they are known or unknown to us. As long as the molecules in question are expressed in a substantially different way on diseased and normal cells, they can be identified. In addition, as an added bonus, the aptamers generated during this process can serve as high-affinity and specific probes for the identified biomarkers. This will be useful for future diagnostic applications. The cost and complexity of this approach are significantly lower than those of antibody-based techniques. This offers the potential for wider application, and may have a very positive impact on the field of biomarker discovery for diseases, as well as for specific cellular functions. This paper represents the first work to use the new cell-SELEX method for biomarker discovery. We succeeded in finding a previously unreported link between a marker protein and certain types of leukemia.
Supplementary Material
Acknowledgment
The authors thank Ms. Weijun Chen for her technical help. This work was supported by NIH grant R01GM079359, NCI R21CA122648, State of Florida Center of Excellence grant, and a grant from the Department of Health, State of Florida.
References
- (1).Wu CC, Yates JR., III The application of mass spectrometry to membrane proteomics. Nat. Biotechnol. 2003;21(3):262–7. doi: 10.1038/nbt0303-262. [DOI] [PubMed] [Google Scholar]
- (2).Shangguan D, Li Y, Tang Z, Cao ZC, Chen HW, Mallikaratchy P, Sefah K, Yang CJ, Tan W. Aptamers evolved from live cells as effective molecular probes for cancer study. Proc. Natl. Acad. Sci. U.S.A. 2006;103(32):11838–43. doi: 10.1073/pnas.0602615103. [DOI] [PMC free article] [PubMed] [Google Scholar]
- (3).Ellington AD, Szostak JW. Selection in vitro of single-stranded DNA molecules that fold into specific ligand-binding structures. Nature. 1992;355(6363):850–2. doi: 10.1038/355850a0. [DOI] [PubMed] [Google Scholar]
- (4).Morris KN, Jensen KB, Julin CM, Weil M, Gold L. High affinity ligands from in vitro selection: complex targets. Proc. Natl. Acad. Sci. U.S.A. 1998;95(6):2902–7. doi: 10.1073/pnas.95.6.2902. [DOI] [PMC free article] [PubMed] [Google Scholar]
- (5).Homann M, Goringer HU. Combinatorial selection of high affinity RNA ligands to live African trypanosomes. Nucleic Acids Res. 1999;27(9):2006–14. doi: 10.1093/nar/27.9.2006. [DOI] [PMC free article] [PubMed] [Google Scholar]
- (6).Blank M, Weinschenk T, Priemer M, Schluesener H. Systematic evolution of a DNA aptamer binding to rat brain tumor microvessels. selective targeting of endothelial regulatory protein pigpen. J. Biol. Chem. 2001;276(19):16464–8. doi: 10.1074/jbc.M100347200. [DOI] [PubMed] [Google Scholar]
- (7).Wang C, Zhang M, Yang G, Zhang D, Ding H, Wang H, Fan M, Shen B, Shao N. Single-stranded DNA aptamers that bind differentiated but not parental cells: subtractive systematic evolution of ligands by exponential enrichment. J. Biotechnol. 2003;102(1):15–22. doi: 10.1016/s0168-1656(02)00360-7. [DOI] [PubMed] [Google Scholar]
- (8).Daniels DA, Chen H, Hicke BJ, Swiderek KM, Gold L. A tenascin-C aptamer identified by tumor cell SELEX: systematic evolution of ligands by exponential enrichment. Proc. Natl. Acad. Sci. U.S.A. 2003;100(26):15416–21. doi: 10.1073/pnas.2136683100. [DOI] [PMC free article] [PubMed] [Google Scholar]
- (9).Cerchia L, Duconge F, Pestourie C, Boulay J, Aissouni Y, Gombert K, Tavitian B, de Franciscis V, Libri D. Neutralizing aptamers from whole-cell SELEX inhibit the RET receptor tyrosine kinase. PLoS Biol. 2005;3(4):e123. doi: 10.1371/journal.pbio.0030123. [DOI] [PMC free article] [PubMed] [Google Scholar] [Retracted]
- (10).Shangguan D, Cao ZC, Li Y, Tan W. Aptamers evolved from cultured cancer cells reveal molecular differences of cancer cells in patient samples. Clin. Chem. 2007;53(6):1153–5. doi: 10.1373/clinchem.2006.083246. [DOI] [PubMed] [Google Scholar]
- (11).Lee ST, Strunk KM, Spritz RA. A survey of protein tyrosine kinase mRNAs expressed in normal human melanocytes. Oncogene. 1993;8(12):3403–10. [PubMed] [Google Scholar]
- (12).Mossie K, Jallal B, Alves F, Sures I, Plowman GD, Ullrich A. Colon carcinoma kinase-4 defines a new subclass of the receptor tyrosine kinase family. Oncogene. 1995;11(10):2179–84. [PubMed] [Google Scholar]
- (13).Muller-Tidow C, Schwable J, Steffen B, Tidow N, Brandt B, Becker K, Schulze-Bahr E, Halfter H, Vogt U, Metzger R, Schneider PM, Buchner T, Brandts C, Berdel WE, Serve H. High-throughput analysis of genome-wide receptor tyrosine kinase expression in human cancers identifies potential novel drug targets. Clin. Cancer Res. 2004;10(4):1241–9. doi: 10.1158/1078-0432.ccr-0954-03. [DOI] [PubMed] [Google Scholar]
- (14).Easty DJ, Mitchell PJ, Patel K, Florenes VA, Spritz RA, Bennett DC. Loss of expression of receptor tyrosine kinase family genes PTK7 and SEK in metastatic melanoma. Int. J. Cancer. 1997;71(6):1061–5. doi: 10.1002/(sici)1097-0215(19970611)71:6<1061::aid-ijc24>3.0.co;2-f. [DOI] [PubMed] [Google Scholar]
- (15).Shangguan D, Tang Z, Mallikaratchy P, Xiao Z, Tan W. Optimization and modifications of aptamers selected from live cancer cell lines. ChemBioChem. 2007;8(6):603–6. doi: 10.1002/cbic.200600532. [DOI] [PubMed] [Google Scholar]
- (16).Lu X, Borchers AG, Jolicoeur C, Rayburn H, Baker JC, Tessier-Lavigne M. PTK7/CCK-4 is a novel regulator of planar cell polarity in vertebrates. Nature. 2004;430(6995):93–8. doi: 10.1038/nature02677. [DOI] [PubMed] [Google Scholar]
- (17).Jung JW, Shin WS, Song J, Lee ST. Cloning and characterization of the full-length mouse Ptk7 cDNA encoding a defective receptor protein tyrosine kinase. Gene. 2004;328:75–84. doi: 10.1016/j.gene.2003.12.006. [DOI] [PubMed] [Google Scholar]
- (18).Xiao Z, Shangguan D, Cao Z, Fang X, Tan W. Cell-specific internalization study of an aptamer from whole cell selection. Chem.-Eur. J. 2008;14:1769. doi: 10.1002/chem.200701330. [DOI] [PubMed] [Google Scholar]
Associated Data
This section collects any data citations, data availability statements, or supplementary materials included in this article.


