Abstract
Increased focus towards improved detector spatial resolution in PET has led to the use of smaller crystals in some form of light sharing detector design. In this work we evaluate two sampling techniques that can be applied during calibrations for pixelated detector designs in order to improve the reconstructed spatial resolution. The inter-crystal positioning technique utilizes sub-sampling in the crystal flood map to better sample the Compton scatter events in the detector. The Compton scatter rejection technique, on the other hand, rejects those events that are located further from individual crystal centers in the flood map. We performed Monte Carlo simulations followed by measurements on two whole-body scanners for point source data. The simulations and measurements were performed for scanners using scintillators with Zeff ranging from 46.9 to 63 for LaBr3 and LYSO, respectively. Our results show that near the center of the scanner, inter-crystal positioning technique leads to a gain of about 0.5-mm in reconstructed spatial resolution (FWHM) for both scanner designs. In a small animal LYSO scanner the resolution improves from 1.9-mm to 1.6-mm with the inter-crystal technique. The Compton scatter rejection technique shows higher gains in spatial resolution but at the cost of reduction in scanner sensitivity. The inter-crystal positioning technique represents a modest acquisition software modification for an improvement in spatial resolution, but at a cost of potentially longer data correction and reconstruction times. The Compton scatter rejection technique, while also requiring a modest acquisition software change with no increased data correction and reconstruction times, will be useful in applications where the scanner sensitivity is very high and larger improvements in spatial resolution are desirable.
I. INTRODUCTION
The intrinsic physics limitations on reconstructed spatial resolution in a PET scanner are determined by the positron range which is a function of the positron energy [1], and the non-collinearity of the two annihilation photons [2, 3]. For the most common radio-isotope used in routine clinical imaging, 18F, the positron range leads to a degradation of about 0.5-mm in the system spatial resolution. Besides these two intrinsic physics effects, a third factor in the system spatial resolution of a PET scanner is the impact of the detector in localizing the interactions of the annihilation photons within it. In recent years there has been an increased focus in PET detector design towards the use of small cross-section crystals in some form of a light-sharing detector. Theoretically, assuming very high scintillation photon statistics, the intrinsic resolution due to detector effects is d/2 for a crystal of cross-section size, d. However, the discrete (under) sampling due to fixed-size pixelated detectors, leads to a convolution of the two effects [4]. The detector sampling effect can be minimized with continuous scintillation detectors that have very fine sampling within the detector, and hence the detector resolution in this case is determined only by the uncertainty in positioning of the event within the detector. This uncertainty is determined by the amount of Compton scatter in the detector as well as the scintillation light statistics. In order to improve the sampling in pixelated detectors and achieve results closer to the theoretical estimates, researchers in the past developed techniques such as “wobbling” which involves a mechanical movement of the detector ring while performing patient scans [5–7]. Our aim in this work is to investigate two techniques that can be applied to the calibrations performed in a pixelated detector design and potentially lead to improved system spatial resolution in a PET scanner.
II. CALIBRATION TECHNIQUES FOR POSITIONING EVENTS IN ARRAYS OF SMALL CRYSALS
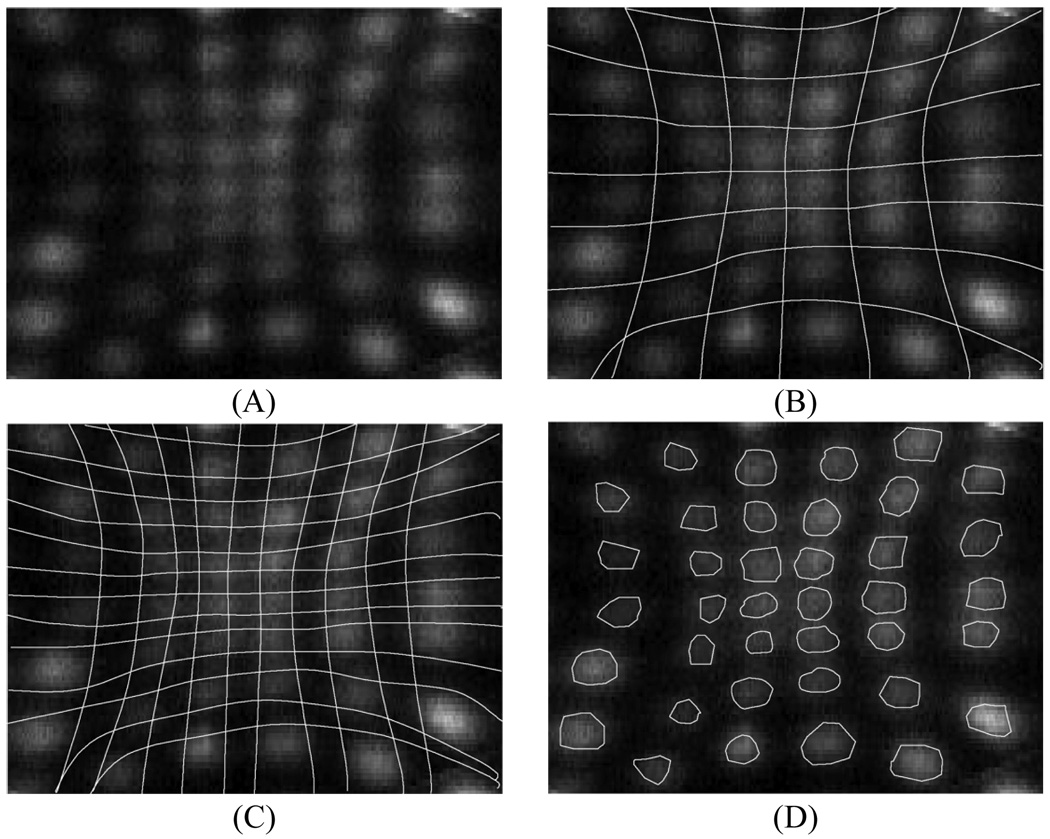
In modern PET scanners based on pixelated detectors a common technique is to use Anger logic positioning with encoding of the crystal to a PMT [8–10]. As a calibration step, boundaries are drawn between all individual crystals in a flood map and a look-up table generated which assigns all events within a region (region-of-interest, ROI) to the center position of that crystal (see Fig. 1A–B). The center position is the real physical position of that crystal on the scanner surface. Fig. 1B shows schematically the crystal space partitioned into ROIs where all points within each ROI are located closest to that ROI peak.
Fig. 1.
Schematic picture of drawing regions around individual crystals during crystal calibrations. (A) A flood map over a portion of a single PMT region showing events within individual crystal. (B) Standard calibration technique — All measured events are placed at the physical center (crystal position on the scanner) of an ROI. The ROI regions are centered over individual crystals and are the same size as the crystal pitch. (C) Inter-crystal positioning technique — All measured events are placed at the physical center of an ROI (every half crystal position on the scanner). The ROI regions are centered over individual crystals and are of size that is half the crystal pitch leading to four times the number of ROIs as in the standard calibration technique. (D) Compton scatter rejection technique — All measured events are placed at the physical center (crystal position on the scanner) of a ROI which are now equal or smaller than the crystal pitch. The events outside these regions are rejected. As shown the ROI size is approximately equivalent to half the crystal pitch.
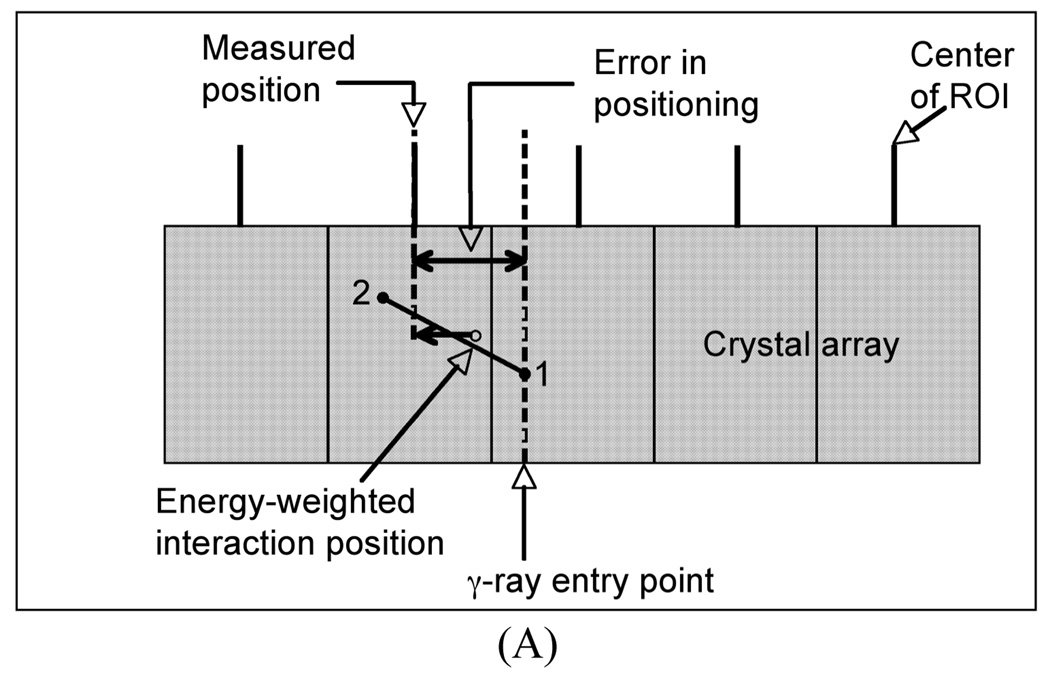
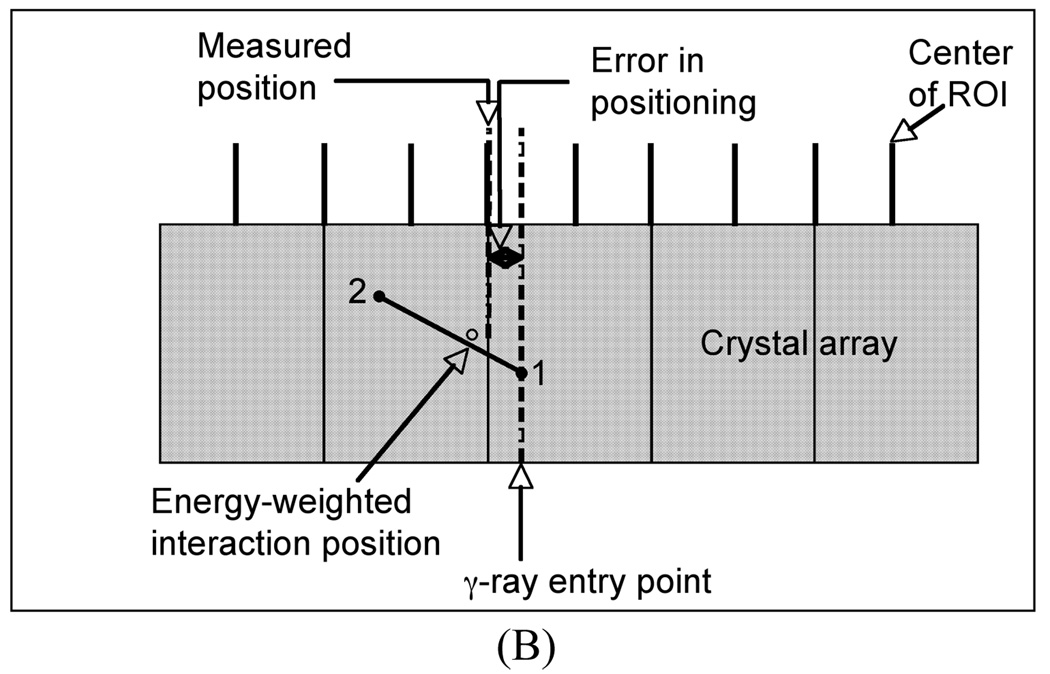
We have performed simulations for a pixelated detector with 4×4×30-mm3 LaBr3 crystals. For these simulations, only the γ-ray interactions were tracked and the interaction position calculated as an energy-weighted mean of the γ-ray interaction points (total deposited energy > 400 keV). The γ-ray entry points were uniformly distributed over a single crystal surface area (4×4-mm2). The energy weighted interaction position of the γ-rays was mapped onto a 2D array of ROIs, each of which was initially 4×4-mm2 in area. The measured position of each γ-ray was then defined to be the center of the ROI which contained the energy weighted interaction position. Finally, the difference between this measured position and the true entry point of the γ-ray was estimated as the error in positioning of that events. Fig. 2A shows schematically this process. The results of our simulation showed that for those γ-rays that only undergo photoelectric interactions, the average error is 1.3-mm in the detector. By allowing Compton interactions as well, the average error increases to 2.3-mm. However, if the ROI size is reduced by half (Fig. 2B) so that it is equivalent to 2×2-mm2 in area, the average error is reduced to about 1.6-mm.
Fig. 2.
Schematic showing the error calculation in positioning of a γ-ray in discrete crystal detector and using ROI bins which are: (A) the same size as the crystal and (B) half the crystal size. Point 1 indicates a Compton scatter followed by a photo-electric interaction at point 2 for the entering γ-ray, with the energy-weighted position lying in between as shown in the schematic.
Based upon these results we evaluate two techniques to reduce the impact of detector Compton scatter in the reconstructed spatial resolution of the scanner. In our first technique we use an inter-crystal positioning technique (see Fig. 1C) to improve the reconstructed spatial resolution of PET scanners. In this technique, all measured events are still placed at the physical center of an ROI. However, the ROIs are centered over individual crystals but are half the size as the crystal pitch, with one additional (inter-crystal) ROI sampling the region between adjacent crystals. Events within each ROI centered over a crystal are still placed at the physical position of that crystal on the scanner. However, those events which lie within each inter-crystal ROI are now placed at a physical position which is in the middle of adjacent real crystal positions. This leads to a doubling (half the crystal pitch) of the detector sampling rate and potentially lead to a better sampling of Compton scattered events which are now also placed at positions lying in between those crystals. In addition, by essentially sampling every half-crystal pitch, there will be some gain in spatial resolution due to improved sampling of the detector point spread function (PSF). The improved PSF sampling with the inter-crystal technique also has an advantage over the past “wobbling” methods since it does not involve any mechanical motion of the detectors.
The second technique, a Compton scatter rejection technique, involves drawing ROI regions over individual crystal regions that are equal (same as the standard calibrations) or smaller than the crystal pitch (see Fig. 1D). Techniques to reduce the impact of Compton scatter events in a similar manner have also been considered in the past by other investigators [11–13]. In our implementation the standard ROIs, which are drawn by an automated algorithm, are reduced in size systematically such that a pre-determined fraction of the original counts are left in the new ROIs. Here, there will be a trade-off between potential improvement in spatial resolution due to rejection of detector Compton-scattered events, and the scanner sensitivity.
System simulations were first performed to evaluate the impact of the detector design on the spatial resolution of a clinical whole-body PET scanner, followed by an investigation of the inter-crystal positioning technique to improve the spatial resolution. Finally, the inter-crystal positioning technique, as well as the Compton scatter rejection techniques, are implemented on two whole-body PET scanners, as well as a small animal imaging PET scanner, to evaluate their effect in experimental measurements.
III. IMPACT OF DETECTOR DESIGN ON SPATIAL RESOLUTION OF A CLINICAL, WHOLE-BODY PET SCANNER
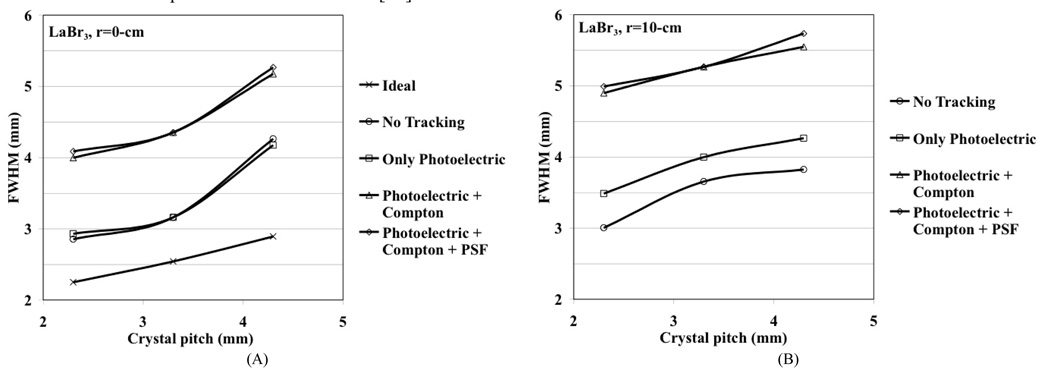
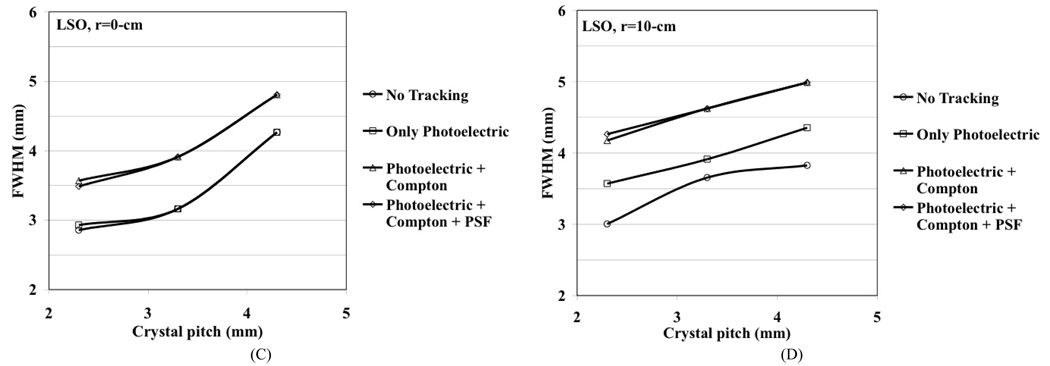
We performed simulations for a generic whole-body scanner with varying crystals sizes in order to better understand the limitations in achieving good spatial resolution using discrete crystal based detectors in a whole-body scanner. The modeled scanner had a ring diameter of 84-cm, axial field-of-view (FOV) of 25-cm, and the crystal length (LSO and LaBr3) was fixed at 30-mm. The simulated detector design was a pixelated Anger-logic detector. The Zeff is 46.9 and 66 while the light output is 60 and 30 photons/keV for LaBr3 and LSO respectively. A point source was simulated at r=0 (center of the scanner) and r=10-cm. Sinograms were generated for four different situations: 1) No tracking, which is the situation where the exact entry position of the 511 keV photon in the detector is known (only possible in simulations), 2) Photoelectric only, where only those 511 keV photons which have the first interaction as photoelectric are used, 3) Photoelectric + Compton, where the full physical effects of Photoelectric and Compton scatter within the detector are included, and 4) Photoelectric + Compton as well as light spread effects in the detector (point spread function, PSF). Three different crystal cross-sections were investigated, 2×2-mm2, 3×3-mm2, and 4×4-mm2, and the crystal pitches were kept at 2.3-mm, 3.3-mm, and 4.3-mm, respectively. Reconstruction was performed with 3D-FRP [14] and results analyzed according to NEMA NU2-2001 standards [15] using 8-mm wide profiles in the orthogonal directions. Fig. 3 shows the simulation results after including in quadrature the positron range effect for 18F (0.5-mm) and photon non-collinearity effect (1.9-mm). As mentioned above, the discrete (under) sampling due to pixelated detectors, together with a perfect detector resolution (no photon tracking), leads to a reconstructed spatial resolution that is the same as the crystal pitch. For illustration purposes we also show the “ideal” resolution (d/2) at the center of a scanner using a discrete crystal based detector (crystal size, d) if sampling requirements as defined by the Nyquist limit are met (at least three samples per detector FWHM) [16]. Due to the high light output of the two scintillators, detector PSF effect (due to light spread) is negligible. Also, reduced Compton scatter in LSO leads to improved spatial resolution. The depth-of-interaction (DOI) effect for only photoelectric interactions is about the same for both crystals and is therefore a function of crystal cross-section and length only. As expected the resolution with LaBr3 is worse after including Compton scatter. Results indicate that better spatial resolution can be achieved with high as well as moderate Zeff scintillators with better sampling in the detector. Using small crystals achieves this but with significantly increased complexity — in a typical whole-body scanner using 4-mm wide crystals there are more than 35,000 crystals and reducing crystal size to 3-mm will approximately double the number used. Small but long crystals will also lead to a worsening of energy and timing resolution, both of which impact the resultant image quality.
Fig. 3.
Reconstructed spatial resolution from Monte Carlo simulations for a whole-body PET scanner as a function as crystal cross-section. A point source was simulated at r=0-cm (A and C) and r=10-cm (B and D). The crystal length was fixed at 30-mm for LaBr3 (A and B), and LSO (C and D). Effects on spatial resolution due to positron range and photon non-collinearity are also included. The curves for no tracking represent the situation where the exact entry position of the 511 keV photon on the detector known. The ideal situation represents the theoretical results when the Nyquist sampling limit is met in a pixelated detector and the detector spatial resolution is given by d/2. All results in these plots include the effects of positron range and photon non-collinearity.
IV. SIMULATION STUDIES FOR INTER-CRYSTAL POSITIONING TECHNIQUES
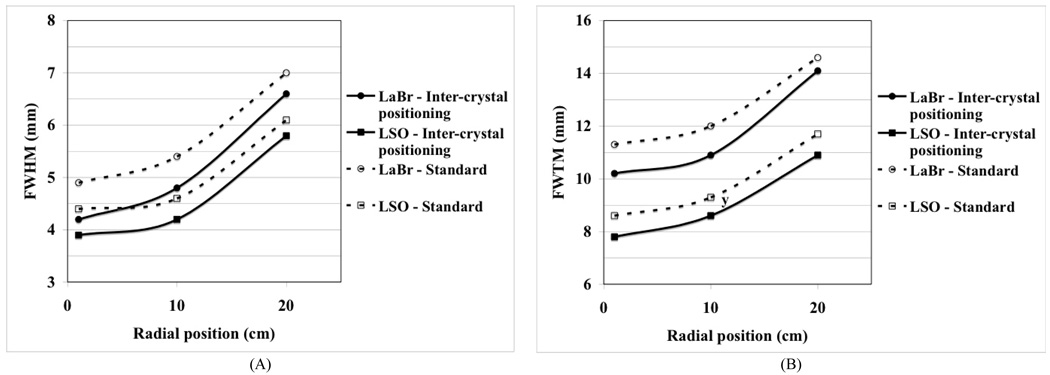
Full system simulations were performed using the inter-crystal positioning technique for detectors composed of 4×4×30-mm3 crystals. The scanner setup was the same as described above. Fig. 4 shows the results for the reconstructed spatial resolution in the LSO and LaBr3 scanners. These results do not include the physical effects of photon non-collinearity and positron range on the spatial resolution since the impact of positron range and photon no-collinearity on FWTM is not easily parametrized. As can be see from this plot, there is a gain of more than 0.5-mm at the FWHM and 1.0-mm at the FWTM level for both scintillators.
Fig. 4.
Reconstructed spatial resolution (FWHM (A) and FWTM (B)) from Monte Carlo simulations for a whole-body PET scanner using the standard and inter-crystal positioning techniques for LSO and LaBr3 crystals.
V. EXPERIMENTAL MEASUREMENTS FOR SPARTIAL RESOLUTION AFTER IMPLEMENTATION OF INTER-CRSYTAL POSITIONING TECHNIQUE
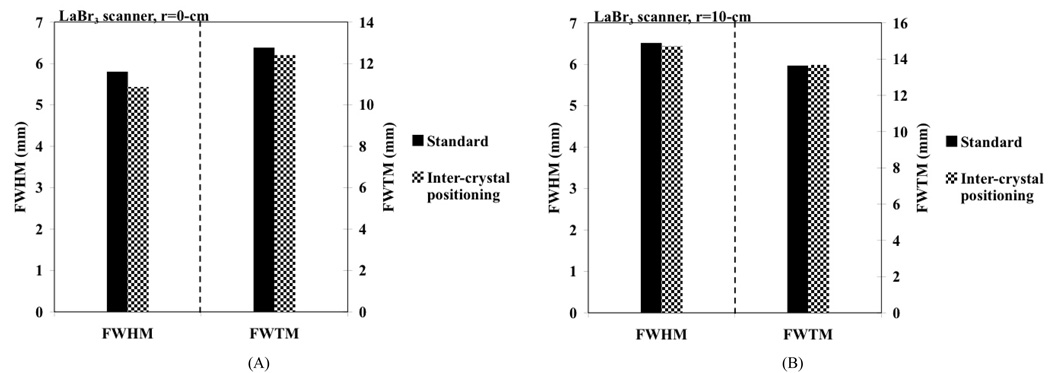
We first performed spatial resolution measurements using a small (< 1-mm in diameter) Na-22 point source in two whole-body PET scanners: a Philips Gemini TF PET/CT scanner [17] using 4×4×22-mm3 LYSO crystals and a proto-type PET scanner [18] using 4×4×30-mm3 LaBr3 crystals. Both these scanners use a pixelated Anger-logic detector [10] , with the main difference being the use of different types of crystals with varying lengths. In the LaBr3 scanner, measurements were performed with the point source placed near the scanner center (r=0-cm) as well as at r=10-cm. In Fig. 5 we show the measured spatial resolution as given by the FWHM and FWTM values. The data were analyzed by drawing wide profiles as prescribed in the NEMA NU-1994 [19] and NEMA NU2-2001 [15] procedures, respectively. Our results show a FWHM gain of about 0.4-mm for a point source at the center of the scanner. There is no significant improvement for a point source placed at r=10-cm. This is because the Compton scattered events are now positioned further away from the incident crystal due to parallax effect compared to events originating from a point source near the center of the scanner.
Fig. 5.
Measured spatial resolution in a proto-type LaBr3 PET scanner using standard crystal calibration procedure (black bars) as well as the inter-crystal positioning technique (patterned bars). The plots show FWHM and FWTM values for point source at radial positions of (A) r=0 and (B) r=10-cm.
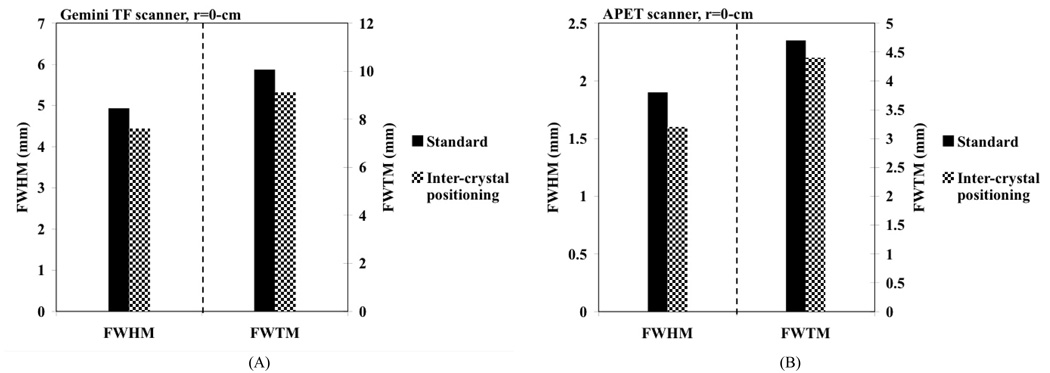
In Fig. 6A we show the measured spatial resolution (FWHM and FWTM) for a point source placed at the center of the Gemini TF PET scanner. Once again there is an improvement of about 0.5-mm in the FWHM value with NEMA NU2-2001 analysis after using the inter-crystal positioning procedure.
Fig. 6.
(A) Measured spatial resolution in a Gemini TF PET PET scanner using standard crystal calibration procedure (black bars) as well as the inter-crystal positioning technique (patterned bars). (B) Measured spatial resolution in the LYSO APET scanner using standard crystal calibration procedure (black bars) as well as the inter-crystal positioning technique (patterned bars). The plots show FWHM and FWTM values for a point source placed at the center of the scanner (r=0).
These measurements were then repeated on a small animal PET scanner (APET) [20] using 2×2×10-mm3 LYSO crystals. Our results (Fig. 6B) using a NEMA NU2-2001 analysis with wide profiles showed that the spatial resolution improves from a FWHM (FWTM) value of 1.9-mm (4.7-mm) with standard calibration procedure to a FWHM (FWTM) value of 1.6-mm (4.4-mm) with the inter-crystal positioning procedure.
VI. EXPERIMENTAL MEASUREMENTS FOR SPARTIAL RESOLUTION AFTER IMPLEMENTATION OF COMPTON SCATTER REJECTION TECHNIQUE
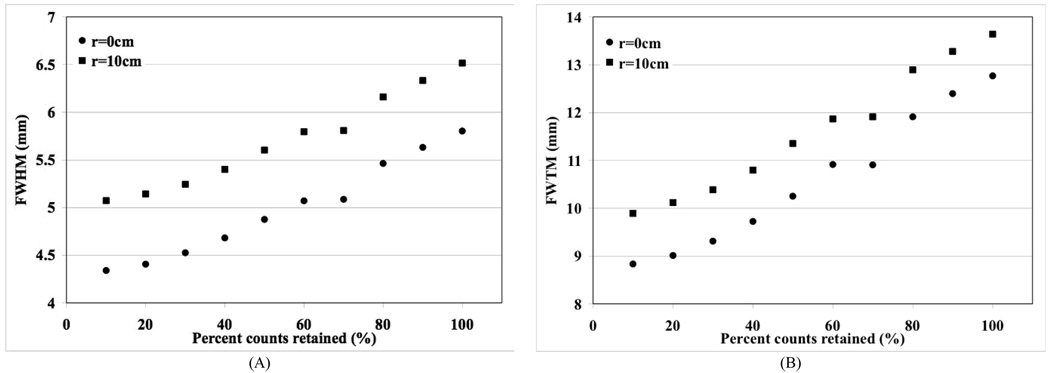
We performed additional measurements with the Na-22 source placed at the center (r=0-cm) and off-center (r=10-cm) positions in the LaBr3 PET scanner. Data were collected for the point source by systematically reducing the size of the calibration ROI drawn over each crystal region by eliminating events in those channels which have low counts in the flood map (Figs. 1A and 1D). The point source data collected for each of the reduced ROI sizes were reconstructed and spatial resolution calculated according to NEMA NU2-2001 analysis. In Fig. 7 we plot the FWHM and FWTM values as a function of percentage counts retained by reducing the ROI size in the calibration table. The standard calibration procedure currently utilized on all PET scanners corresponds to the all counts retained (100%) situation in these plots. As expected a systematic reduction in the ROI size leads to a reduction in collected counts most of which are Compton scattered in the detectors, leading to improvements in the spatial resolution.
Fig. 7.
Measured spatial resolution in a proto-type LaBr3 PET scanner using reduced crystal calibration ROI size. Plots are shown for reconstructed spatial resolution at the FWHM (A) and FWTM (B) levels. The results are plotted as a function of percent counts retained in the data as the calibration ROI size is changed.
For the Gemini TF whole-body scanner and the APET small animal scanner we repeated the measurement with the point source placed at the center of the scanner, and using an ROI size which eliminates 50% of the collected counts. In the Gemini TF, spatial resolution is improved to a FWHM (FWTM) value of 4.2-mm (8.3-mm) compared to the value of 4.9-mm (10.0-mm) obtained using the standard calibration procedure. In the APET, the gain was relatively modest with the FWHM (FWTM) value improving to 1.7-mm (4.2-mm).
VII. DISCUSSION AND CONCLUSION
Through simulations and measurements we have evaluated the use of two crystal calibration techniques for improving spatial resolution of pixelated detectors in PET. The inter-crystal positioning technique is anticipated to provide a better sampling of Compton scattered events in the detector as well as a finer sampling of the detector PSF, thereby leading to improved reconstructed spatial resolution. Through simulations and measurements we have shown that this technique results in a gain in reconstructed spatial resolution of about 0.5-mm near the center of a whole-body PET scanner. This conclusion was validated in scanners using a high-Zeff (LYSO), as well as a medium-Zeff (LaBr3) scintillator. In the animal scanner with a standard spatial resolution of 1.9-mm, this positioning technique leads to a spatial resolution of 1.6-mm. The inter-crystal positioning technique, therefore, represents a simple, and low-cost, software implementation to achieve modest improvements in spatial resolution for clinical PET scanners.
The Compton scatter technique performed as expected, where the gains in reconstructed spatial resolution were significant but at the cost of reduced sensitivity. Compared to the inter-crystal positioning technique, a gain of 0.5-mm in reconstructed spatial resolution is now achieved with a loss of about 25% in sensitivity. However, in the small animal PET scanner which uses intrinsically smaller crystals, the gain in spatial resolution is modest even after a 50% reduction in sensitivity. This result is explained by the fact that Compton scatter is independent of crystal size and a scanner using small crystals is already doing a good job of positioning the Compton events accurately. Therefore, further reduction in the ROI size does not lead to significant improvements in the reconstructed spatial resolution.
The investigations performed in this work evaluated the impact of the two calibration techniques on reconstructed spatial resolution. Subsequent work will involve evaluation of their impact on resultant images using lesion phantoms. Initially we will image hot and cold lesion phantoms, as well as a cold rod phantom (Data Spectrum Micro Deluxe Phantom), in the APET scanner. Subsequently, lesion phantom measurements will also be performed on the two whole-body scanners to study the benefit in clinical tasks.
Currently, iterative reconstruction of sinogram data for lesion phantoms with inter-crystal positioning technique will be significantly slower in speed since the size of sinograms is four times larger than usual. In contrast, list-mode reconstruction will be more feasible in this situation, especially from algorithm efficiency point of view, since the reconstruction speed is dependent mainly on the number of counts in the data which does not change. The reconstruction issues require a detailed investigation that will be performed in later studies. Our results, in this work show an improved spatial resolution with both techniques which can have an impact on improved quantification of small lesions.
The future lesion imaging studies will help determine the specific imaging situations where the two calibration techniques can be successfully utilized. At first glance, the inter-crystal technique can be utilized in a PET scanner without penalizing any other scanner performance characteristic, and can be easily implemented for all studies. It is especially beneficial for use in our small animal APET scanner where the reduction in spatial resolution from 1.9-mm to 1.6-mm leads to a 40% reduction in volumetric resolution and will have a large impact on imaging animals such as mice. The Compton scatter rejection technique, on the other hand, indicates that spatial resolution in a whole-body scanner can be improved by up to 1-mm at a cost of 50% loss in sensitivity. Two scenarios where this can be useful are the TOF whole-body imaging of small to average patients as well as brain imaging in clinical PET scanners. Both these imaging environments currently produce PET images that are of very high statistical quality. By trading off some of this sensitivity for better spatial resolution one could achieve improved clinical performance using the standard PET scanners.
ACKNOWLEDGMENT
We would like to thank Dr. Gerd Muehllehner of the University of Pennsylvania for useful discussions related to the sampling techniques investigated in this work.
This work was supported by the National Institutes of Health under Grant Nos. R33-EB001684 and R01-CA113941.
Contributor Information
Suleman Surti, Department of Radiology, University of Pennsylvania, Philadelphia, PA 19104 USA (telephone: 215-662-7214, e-mail: surti@mail.med.upenn.edu).
Ryan Scheuermann, Department of Physics, University of Pennsylvania, Philadelphia, PA 19104 USA (telephone: 215-662-7792, e-mail: RScheuermann@xrt.upenn.edu).
Matthew E. Werner, Department of Radiology, University of Pennsylvania, Philadelphia, PA 19104 USA (telephone: 215-662-7217, e-mail: Matt.Werner@uphs.upenn.edu)
Joel S. Karp, Departments of Radiology and Physics, University of Pennsylvania, Philadelphia, PA 19104 USA (telephone: 215-662-3073, e-mail: joelkarp@mail.med.upenn.edu).
REFERENCES
- 1.Phelps ME, Hoffman EJ, Huang S-C, Ter-Pogossian MM. Effect of positron range on spatial resolution. J Nucl Med. 1975;vol. 16:649–652. [PubMed] [Google Scholar]
- 2.De Beneditti S, Cowan CE, Konneker WR, et al. On the angular distribution of two-photon annihilation radiation. Physical Review. 1950;vol. 77:205–212. [Google Scholar]
- 3.Hoffman EJ, Phelps ME. An analysis of some of the physical aspects of positron transaxial tomography. Computers in Biology and Medicine. 1976;vol. 6:345–360. doi: 10.1016/0010-4825(76)90071-8. [DOI] [PubMed] [Google Scholar]
- 4.Huang SC, Hoffman EJ, Phelps ME, Kuhl DE. Quantitation in Positron Emission Computed-Tomography .3. Effect of Sampling. J Comput Assist Tomogr. 1980;vol. 4:819–826. doi: 10.1097/00004728-198012000-00014. [DOI] [PubMed] [Google Scholar]
- 5.Bohm C, Eriksson L, Bergstrom M, Litton J, Sundman R, Singh M. A computer assisted ring detector positron camera system for reconstruction tomography of the brain. IEEE Trans Nucl Sci. 1978;vol. NS-25:624–637. [Google Scholar]
- 6.Brooks RA, Sank VJ, Talbert AJ, Chiro GD. Sampling requirements and detector motion for positorn emission tomography. IEEE Trans Nucl Sci. 1979;vol. NS-26:2760–2763. [Google Scholar]
- 7.Tanaka E, Nohara N, Yamamoto M, Tomitani T, Murayama H, Ishimatsu K, Takami K. ‘PPositology’ - The search for suitable detector arrangements for a positron ECT with continuous rotation. IEEE Trans Nucl Sci. 1979;vol. NS-26:2728–2731. [Google Scholar]
- 8.Casey ME, Nutt R. A multicrystal two dimensional BGO detector system for positron emission tomography. IEEE Trans. Nucl. Sci. 1986;vol. 33:460–463. [Google Scholar]
- 9.Wong WH, Uribe J, Hicks K, Hu G. An analog decoding BGO block detector using circular photomultipliers. IEEE Trans. Nucl. Sci. 1995;vol. 42:1095–1101. [Google Scholar]
- 10.Surti S, Karp JS, Freifelder R, Liu F. Optimizing the performance of a PET detector using discrete GSO crystals on a continuous lightguide. IEEE Trans. Nucl. Sci. 2000;vol. 47:1030–1036. [Google Scholar]
- 11.Digby WM, Digby WM, Hoffman EJ. Examination of event localization in 2-D modular detectors for PET; Nuclear Science Symposium and Medical Imaging Conference, 1991., Conference Record of the 1991 IEEE; 1991. p. 1592. [Google Scholar]
- 12.Digby WM. Biomedical Physics. vol. Los Angeles: PhD Los Angeles: University of California; 1991. Techniques for improved accuracy and precision using modular detector systems for positron emission tomography; p. 180. [Google Scholar]
- 13.Yoshida E, Yoshida E, Kimura Y, Kitamura K, Murayama HAMH. Calibration procedure for a DOI detector of high resolution PET through a Gaussian mixture model. IEEE Trans. Nucl. Sci. 2004;vol. 51:2543–2549. [Google Scholar]
- 14.Matej S, Lewitt RM. 3D-FRP: Direct fourier reconstruction with Fourier reprojection for fully 3-D PET. IEEE Trans. Nucl. Sci. 2001 AUG;vol. 48:1378–1385. [Google Scholar]
- 15.Washington, DC: National Electrical Manufacturers Association; NEMA Standards Publication NU 2-2001, Performance Measurements of Positron Emission Tomographs. 2001
- 16.Cherry SR, Sorenson JA, Phelps ME. Physics in nuclear medicine. Philadelphia: Saunders; 2003. [Google Scholar]
- 17.Surti S, Kuhn A, Werner ME, Perkins AE, Kolthammer J, Karp JS. Performance of Philips Gemini TF PET/CT scanner with special consideration for its time-of-flight imaging capabilities. J Nucl Med. 2007 Mar;vol. 48:471–480. [PubMed] [Google Scholar]
- 18.Karp JS, Kuhn A, Perkins AE, Surti S, Werner ME, Daube-Witherspoon ME, Popescu LM, Vandenberghe S, Muehllehner G. Characterization of TOF PET scanner based on Lanthanum Bromide. 2005 IEEE Nuclear Science Symposium and Medical Imaging Conference; San Juan; Puerto Rico. 2005. [Google Scholar]
- 19.Washington, DC: National Electrical Manufacturers Association; NEMA Standards Publication NU 2-1994, Performance Measurements of Positron Emission Tomographs. 1994
- 20.Surti S, Karp JS, Perkins AE, Cardi CA, Daube-Witherspoon ME, Kuhn A, Muehllehner G. Imaging performance of A-PET: A small animal PET camera. IEEE Trans. Med. Imag. 2005 Jul;vol. 24:844–852. doi: 10.1109/tmi.2005.844078. [DOI] [PubMed] [Google Scholar]


