

Abstract
We present the use and characterization of a photon counting detector for increased sensitivity at low signal levels in fluorescence laser scanning microscopy (LSM). Conventional LSM PMT detectors utilize analog current integration and thus suffer from excessive noise at low signal levels, introduced during current measurement. In this letter we describe the implementation of a fast single-photon counting (SPC) detector on a conventional two-photon laser scanning microscope and detail its use in imaging low fluorescence intensities. We show that for a low photon flux, the SPC detector is shot-noise limited and thus provides increased detection sensitivity compared to analog current integration.
Fluorescence laser scanning microscopy (LSM) [1] is widely used for imaging bio-molecular organization and dynamics in living cells and tissue. Central to the LSM is the photon detector for measuring the fluorescence emitted from the sample. The most commonly used photon detector is the photomultiplier tube (PMT), due to its high sensitivity and low cost.
Briefly, the PMT functions by converting an incident photon into a photo-electron at the photocathode. This electron produces a large number of secondary electrons from a series of charged cathodes, generating a measureable current pulse at the anode. In most commercial microscopes, analogue detection is utilized where the output current from the PMT is integrated over the pixel dwell time, converted into a voltage and then digitized to provide a number (DN), which is proportional to the number of incident photons. When the PMT is used to detect a low photon flux, a large amount of electron gain is required in the PMT to give a detectable level of current. This can result in significant ‘dark noise’ due to thermal events in the photocathode, multiplicative noise that can result in a variation of the magnitude of the current pulse, and increased noise in the signal digitization. These all contribute to noise above the shot noise limit of the incident photon flux.
In biological samples, noise is of particular concern, because a low excitation power and low amount of fluorophore labeling is often necessary to avoid phototoxic effects perturbing the sample. An alternative method of detection, suitable for lower levels of photon flux, is pulse counting detection or single-photon counting (SPC) (see chapters 2&12 in [1] for further description of photon counting detection). In this method, a cooled PMT is utilized which will give a tightly distributed current pulse with an amplitude well separated from background dark events. Individual photon events can thus be counted with minimal additional noise and background signal being introduced to the signal by the detector PMT. To utilize single-photon counting detection in LSM, high-speed logic operations are required in order to detect, count and allocate individual current pulses. Recently, field programmable gate arrays (FPGAs) have been developed that allow programmable logic to be incorporated with high speed and flexibility on a single microprocessor.
In this letter, we describe the implementation of a single-photon counting (SPC) detector for the detection of two-photon excited fluorescence. Two-photon excitation LSM [2] is often used for imaging in vivo cellular dynamics and cellular autofluroescence due to the increased imaging depths and reduced photo-toxicity to the sample [3]. Low levels of fluorescence are common in two-photon excitation microscopy, which motivates the improvement of the detector signal to noise (S/N). We describe the implementation of the SPC detector system utilizing FPGA signal processing and demonstrate its application to imaging the low levels of cellular autofluorescence in live pancreatic islet cells using two-photon microscopy. We then characterize the noise statistics of the SPC detector and make a comparison with the conventional microscope PMT detector over a range of signal levels. Two-photon microscopy was performed on an LSM510 microscope (Zeiss, Jena, Germany) with a x40 1.3NA oil immersion objective (Zeiss) and incorporating a mode-locked Titanium:sapphire laser oscillator (Chameleon, Coherent, Santa Clara, CA). For the SPC detector, a Peltier cooled H7421-40 photon counting head with a GaAs PMT (Hamamatsu, Hamamatsu City, Japan) is powered from a C8137 power supply (Hamamatsu), which produces TTL pulses of 8ns duration from a single photon event. The signal output from this detector is relayed via a pulsed delay generator (DG535, Stanford Research Systems, Sunnyvale, CA) to stretch the TTL pulse to 30ns for more efficient pulse detection, and a shielded I/O connector block (SCB-68, National Instruments, Austin, TX) to the FPGA module mounted on a DAQ card (PCI-7831R, National Instruments) connected to a computer. Pixel clock, line, frame and stack synchronization (sync’) signals from the laser scanning unit of the microscope are also relayed onto the FPGA via the shielded I/O connector block. A schematic of this system can be found in figure 1. The FPGA is programmed through LabView (National Instruments) to count the number of TTL pulses received from the photon counting head within the duration of the pixel dwell time. This digital number is then input into a pre-allocated image array, using the pixel clock and line sync’ signals to determine the position within the image. Home built relay optics (CVI, Albuquerque, NM) direct fluorescence emission to the photon counting head via a custom built mount holding a 680DCLP dichroic mirror, BG-39 IR filter and 465/160 band pass filter with IR coating (Chroma, Rockingham, VT). Axial and longitudinal alignment images the back focal plane of the microscope objective onto the photocathode plane of the photon counting head. For comparison with the conventional non-descanned detector (NDD) PMT, fluorescence is relayed to the microscope NDD, via a 680DCLP dichroic mirror, and 465/160 band pass filter with IR coating (Chroma).
Figure 1.
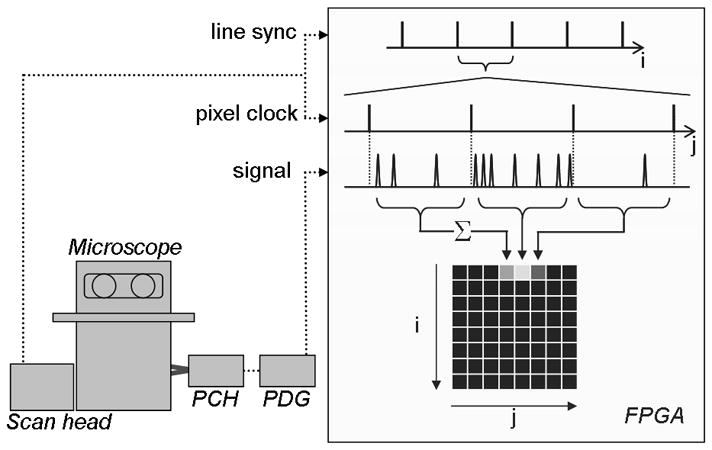
Schematic of the single-photon counting detector system. The photon counting head (PCH) relays the single photon event TTL pulse via the pulse delay generator (PDG) to the field programmable gate array (FPGA). Line synchronization (sync’) and pixel clock signals from the confocal scan head are also sent to the FPGA. On the FPGA, after every pixel clock tick, the photon event pulses are counted until the following pixel clock tick. This count (Σ) is then input into the pre-allocated memory array, at a position defined by the line sync’ and pixel clock signal (i,j).
To demonstrate the use of the single-photon counting detector for imaging low fluorescence levels, we imaged the autofluorescence from endogenous NAD(P)H (β-nicotinamide adenine dinucleotide (phosphate)) in pancreatic islets using two-photon excitation microscopy [4]. The NAD(P)H signal is an indicator of cell metabolic activity and thus is an important fluorescence signature to be able to measure in many biological studies [4, 5]. The fluorescence signal obtained is relatively low, due to the low quantum yield of the NAD(P)H chromophore and the low excitation power used to minimize phototoxicity to the sample. Pancreatic islets, cultured on extracellular matrix, were imaged with the SPC detector and the conventional microscope NDD. In figure 2, images acquired using both detectors are displayed, following an excitation power of ~5.4mW at a wavelength of 710nm and with a pixel dwell time of 102μs. Both images show the distribution of cellular NAD(P)H within the islet, each with an equivalent image quality.
Figure 2.
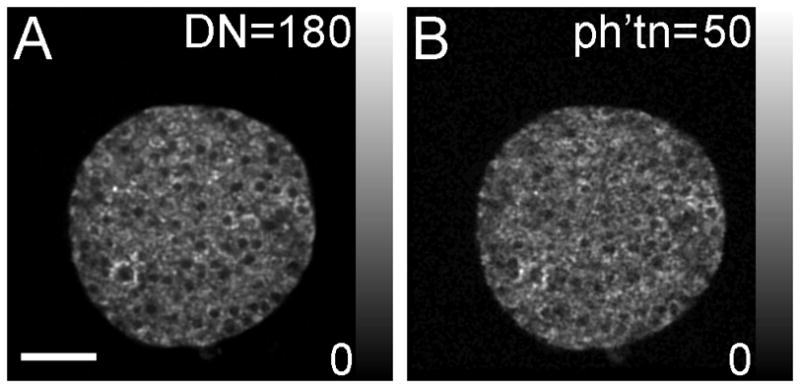
Gray scale images of islet NAD(P)H detected using A) the conventional non-descanned detector and B) the single-photon counting detector. The NAD(P)H distribution within the islet can be resolved using both forms of detection, yielding approximately equivalent image quality. Scale bar in A represents 50μm. Note, color scale in A is to an 8-bit digitized number (DN, scaled between 0 and 180), whereas in B it is to the number of photons collected (ph’tn, scaled between 0 and 50).
Since the SPC detector should lead to a shot noise limited signal, we next sought to characterize the noise compared to the conventional NDD. Again, using identical excitation powers and pixel dwell times, we imaged the fluorescence from a series of concentrations of free NADH diluted in phosphate buffered saline. A high ‘zoom’ was used such that an area of a few μm2 was imaged, resulting in a uniform sample which minimizes any signal variation across the field of view. For the conventional microscope NDD, the PMT offset voltage which sets the voltage at which a DN of zero is obtained, was adjusted such that with no excitation power a mean pixel DN of zero was acquired [6]. The signal was calculated as the mean pixel DN over the image, and the noise was calculated as the standard deviation of the pixel DN over the image. For the SPC detector, the mean background signal, obtained during the pixel flyback, was set to the offset value. Images were resized to the image size acquired with the NDD, and the mean and standard deviation pixel values were calculated to represent the signal and the noise respectively.
The detected fluorescence signal increases linearly with increasing concentration of free NADH for both methods of detection (not shown), reaching 12 counts/pixel at 400μM NADH. The signal to noise (S/N) variation with NADH concentration for both methods of detection can be seen in figure 3a, with the same excitation power (~5.4mW), wavelength (710nm), and pixel dwell time (102μs) used for figure 2. For low NADH concentrations (<400μM) the SPC detector gives a greater S/N compared to the NDD. At concentrations of 400μM, the S/N is equal for both methods of detection, whereas at higher concentrations the S/N starts to decrease for the SPC detector. This data shows that for low signals obtained from low concentrations of NADH, the SPC detector is more sensitive than the conventional NDD detector, because noise in the dark current in the NDD PMT dominates the low signal. At high signals, however, the S/N from the SPC detector drops, due to the photon flux exceeding the count rate linearity of the photon counting head (specified at <1.5MHz, Hamamatsu), as well as the count limit of the pulsed delay generator (1MHz).
Figure 3.
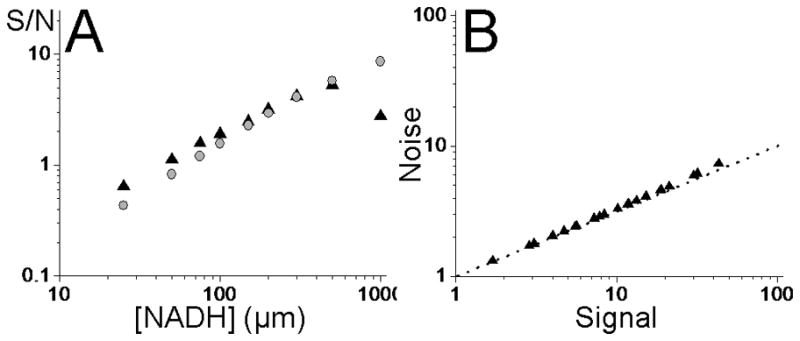
A). Comparison of the signal-to-noise (S/N) obtained using the single-photon counting (SPC) detector (black triangle ▲) and conventional non-descanned detector (NDD) (grey circle  ). Using equivalent settings to figure 2, for low concentrations of free NADH the SPC detector gives a superior S/N. At higher concentrations >400μM (≡13 photons/pixel), the S/N obtained using the NDD exceeds that obtained using the SPC detector. B) The noise on the signal from the SPC detector, when varying the excitation power and concentrations of NADH (black triangle ▲), is at the shot noise limit (dash-dot line).
We also tested whether the SPC detector gives a shot noise limited signal. Figure 3b displays the noise variation with signal obtained for several concentrations of free NADH and several excitation powers. For all settings there is very little deviation of the measured noise from the shot-noise limit, further demonstrated by fitting the signal-noise data to a power law: N=1.015·S0.515 compared to N=1.00·S0.50 for shot noise.
The concentration range at which the SPC detector S/N is more desirable lies below 400μM free NADH. If we consider an 8–12 fold signal increase upon NADH enzyme binding [7], this signal would be equivalent to an enhanced performance for measuring fluorescence from <50μM bound NADH. This is in the range of the cytoplasmic NAD(P)H levels [7], and thus highlights how the photon counting detection scheme has improved sensitivity for detecting applicable levels of fluorescence.
In principle, most conventional PMTs can be set up to perform a count rate of up to 1 MHz and it should be possible to count this rate with an off-the-shelf photon counter. We have used a fast PMT and FPGA for photon counting detection and have shown that a S/N improvement is obtained from count rates lower than 1MHz. We emphasize, however, that the quantum efficiency of the photon counting head photocathode is less than that of the conventional PMT: 21% vs 29% respectively at the emission peak of NADH autofluorescence (~450nm). Furthermore, the light shielding of the SPC detector is less than that of the NDD, and the home-built relay optics for the SPC detector are uncoated. Thus in an equivalent comparison, we would expect the SPC detector to give a greater S/N and show an improvement over the conventional NDD at greater signal levels (equivalent to greater NADH concentrations). With off the shelf components, it is possible to obtain this improved S/N, as we have implemented, and this can be extended to greater signals as well. The use of FPGA logic has been shown to handle a count rate of up to 120MHz [8], and fast PMTs can provide count rates of tens of MHz (Hamamatsu); sufficient for most biological applications. We therefore predict that the inclusion of fast single-photon counting in existing and new systems will increase sensitivity in detecting the low photon fluxes associated with biological fluorescence.
Acknowledgments
The authors wish to acknowledge funding from NIH grants R01-DK53434 and P20-GM72048 and the Department of Defense Medical Free-Electron Laser Program.
References
- 1.Pawley JB, editor. Handbook of biological confocal microscopy. Plenum Press; New York: 1995. [Google Scholar]
- 2.Denk W, Strickler JH, Webb WW. 2-Photon Laser Scanning Fluorescence Microscopy. Science. 1990;248:73–76. doi: 10.1126/science.2321027. [DOI] [PubMed] [Google Scholar]
- 3.Benninger RKP, Hao M, Piston DW. Multi-photon Excitation Imaging of Dynamic Processes in Living Cells and Tissues. Reviews of Physiology, Biochemistry and Pharmacology. 2008;160:71–92. doi: 10.1007/112_2008_801. [DOI] [PubMed] [Google Scholar]
- 4.Bennett BD, Jetton TL, Ying GT, Magnuson MA, Piston DW. Quantitative subcellular imaging of glucose metabolism within intact pancreatic islets. Journal of Biological Chemistry. 1996;271:3647–3651. doi: 10.1074/jbc.271.7.3647. [DOI] [PubMed] [Google Scholar]
- 5.Chance B, Baltscheffsky H. Respiratory Enzymes in Oxidative Phosphorylation. Journal of Biological Chemistry. 1958;233:736–739. [PubMed] [Google Scholar]
- 6.Piston DW, Knobel SM. Quantitative imaging of metabolism by two-photon excitation microscopy. Confocal Microscopy. 1999;307:351–368. doi: 10.1016/s0076-6879(99)07023-8. [DOI] [PubMed] [Google Scholar]
- 7.Patterson GH, Knobel SM, Arkhammar P, Thastrup O, Piston DW. Separation of the glucose-stimulated cytoplasmic mitochondrial NAD(P)H responses in pancreatic islet beta cells. Proceedings of the National Academy of Sciences of the United States of America. 2000;97:5203–5207. doi: 10.1073/pnas.090098797. [DOI] [PMC free article] [PubMed] [Google Scholar]
- 8.Buehler C, Kim KH, Greuter U, Schlumpf N, So PTC. Single-photon counting multicolor multiphoton fluorescence microscope. Journal of Fluorescence. 2005;15:41–51. doi: 10.1007/s10895-005-0212-z. [DOI] [PubMed] [Google Scholar]