Abstract
Position-sensitive avalanche photodiodes (PSAPDs) are gaining widespread acceptance in modern PET scanner designs, and owing to their relative insensitivity to magnetic fields, especially in those that are MRI-compatible. Flood histograms in PET scanners are used to determine the crystal of annihilation photon interaction and hence, for detector characterization and routine quality control. For PET detectors that use PSAPDs, flood histograms show a characteristic pincushion distortion when Anger logic is used for event positioning. A small rotation in the flood histogram is also observed when the detectors are placed in a magnetic field. We first present a general purpose automatic method for spatial distortion correction for flood histograms of PSAPD-based PET detectors when placed both inside and outside a MRI scanner. Analytical formulae derived for this scheme are based on a hybrid approach that combines desirable properties from two existing event positioning schemes. The rotation of the flood histogram due to the magnetic field is determined iteratively and is accounted for in the scheme. We then provide implementation details of a method for crystal identification we have previously proposed and evaluate it for cases when the PET detectors are both outside and in a magnetic field. In this scheme, Fourier analysis is used to generate a lower-order spatial approximation of the distortion-corrected PSAPD flood histogram, which we call the ‘template’. The template is then registered to the flood histogram using a diffeomorphic iterative intensity-based warping scheme. The calculated deformation field is then applied to the segmentation of the template to obtain a segmentation of the flood histogram. A manual correction tool is also developed for exceptional cases. We present a quantitative assessment of the proposed distortion correction scheme and crystal identification method against conventional methods. Our results indicate that our proposed methods lead to a large reduction in manual labor and indeed can routinely be used for calibration and characterization studies in MRI-compatible PET scanners based on PSAPDs.
Index Terms: PET/MRI, PSAPD, spatial distortion correction, crystal identification
I. Introduction
MRI-compatible Positron Emission Tomography (PET) scanners that produce anatomically co-registered simultaneously-acquired images of morphology, function and metabolic activity are expected to have a huge positive impact on both pre-clinical as well as clinical imaging fields [1]–[3]. At UC Davis, a pre-clinical MRI-compatible PET scanner has been built and has been characterized [1], [4]. This merger of MRI and PET became possible through the use of PET detectors in which photomultiplier tubes (PMTs) are replaced by magnetic field-insensitive position-sensitive avalanche photodiodes (PSAPDs). PET signals can be measured in these detectors with minimal distortion even when they are placed inside the bore of a MRI scanner [4]. Since position-sensitive APDs (or PSAPDs) can read out a large number of scintillator crystals simultaneously, they also help reduce the electronic complexity of a PET system [5]. A photograph of a single PET detector module from this system is shown in Fig. 1(a), where a (8 × 8) array of polished (1.43 × 1.43 × 6) mm3 Lutetium Orthosilicate (LSO) crystals is coupled to a single (14 × 14) mm2 PSAPD via optical fibers. Sixteen such detectors make up the system, amounting to a total of 1024 LSO crystals. More details about this scanner are in [1], [4].
Fig. 1.
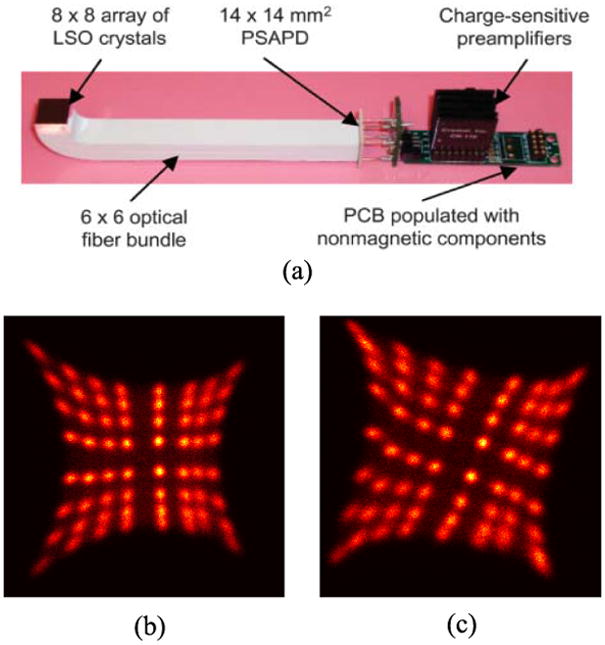
A single PET detector module from the UC Davis MRI-compatible PET scanner and flood histograms; (a) the PET detector module with an array of 8 × 8 LSO crystals coupled via optical fibers to a single 14 × 14 mm2 PSAPD (reproduced from [4]), (b) flood histogram obtained for the detector when placed outside the 7T MRI scanner’s magnetic field, (c) flood histogram obtained for the same detector when placed inside the MRI scanner’s magnetic field
Flood histograms are two-dimensional probabilistic maps generated using the four output signals from the PSAPD when the PET detector is irradiated with an annihilation photon flood source. Flood histograms obtained for a single PET detector module placed outside and in the magnetic field of a 7T small animal MRI scanner are shown in Fig. 1(b)–(c). These histograms were obtained using Anger logic [6]. Three spatial effects are prominent in the flood histograms, (i) an asymmetry about the vertical axis due to the different curvatures of the optical fibers more apparent in Fig. 1(b), but also present in and Fig. 1(c), (ii) a pincushion distortion resulting from using Anger logic for event positioning visible in both Fig. 1(b) and (c), and (iii) a rotation of the histogram when the detector is placed in a magnetic field owing to the Hall effect [7], visible in Fig. 1(c). The distortions caused due to the optical fiber curvatures may be corrected by appropriately scaling the corresponding signals that undergo larger attenuation. New positioning formulae for reducing the pincushioning effect in flood histograms of generic PSAPD-based detectors were proposed by Zhang et al. [8]. They showed results from the application of their formulae to detectors that employed (8 × 8) mm2 PSAPDs. However, when these formulae were used for the aforementioned detector module that uses a (14 × 14) mm2 PSAPD, pincushioning was overestimated leading to a barrel-type spatial distortion. This barrel effect may be attributed to variability in the resistive and capacitive networks that underlie the PSAPD chip [9]. Adequate control over the barrel and pincushioning effects is desirable to minimize distortions in the flood histogram.
The rotation of the flood histogram in a magnetic field, as seen in Fig. 1(c), occurs only for those PSAPDs that have faces at right angles to the static magnetic field direction [4]. This rotation is either clockwise or anticlockwise depending on whether the device face forms an angle of +90° or −90° with the static magnetic field vector respectively. The rotation angle in either case was determined to be a constant and is a function of the static magnetic field alone [4]. Different MRI sequences have minimal impact on it. Hence, once determined, this rotation angle may be reused for the PET detectors in a MRI scanner with the same field strength assuming identical geometrical placement of the PET scanner.
Reduction of spatial distortion is desirable for automated crystal identification, which in turn, is necessary for detailed characterization of PET detectors, as well as for routine quality control of PET scanners. Crystal identification can be posed as a segmentation problem where one requires a segmentation of the flood histogram into regions equal to the total number of scintillator crystals in the detector array, such that each region has one peak. Existing segmentation schemes are derived from a broad range of image processing and pattern recognition techniques. The relatively straightforward but the most time consuming scheme is to manually click on peak locations on a computer screen and then use a watershed method for segmenting the individual regions [10]. This method is labor intensive and hence, impractical for modern PET scanners that typically have thousands of crystals. A semi-automatic scheme involving thresholding the flood histogram to automatically identify peaks followed by watershed-based segmentation has been proposed [11]. However, because of its dependence on intensities of individual crystals in the flood histogram, this method produces inaccurate results especially in cases where crystals in the same scintillator array have large efficiency variations. Sophisticated methods based on self-organizing maps, multi-level neural networks, wavelets, and Weiner filtering have been developed [12]–[15]. However, these methods are primarily designed for specific scanners the investigators are developing.
We previously have developed a distortion correction scheme for PET detectors based on PSAPDs [16]. In this scheme, adaptive event positioning formulae were derived using those proposed by Anger [6] and Zhang [8]. These proposed formulae result in reduced pincushion or barrel distortions. However, additional compensation is needed in the case of our PET/MRI detectors to account for the asymmetry in the flood histograms caused due to the curvatures of the optical fibers and for the flood histogram rotation in magnetic field. For the distortion-corrected flood histogram, we previously have developed a general purpose semi-automatic segmentation scheme based on Fourier space analysis [16]. In this scheme, we first obtain a template image that exploits the spatial frequency information in the given flood histogram. This template image can be segmented simply with horizontal and vertical lines drawn midway between adjacent peaks in the histogram. A diffeomorphic polynomial-based scheme that is capable of iteratively minimizing intensity differences is then used to register the template to the given flood histogram. The estimated warping field is applied to the segmentation of the template resulting in the segmentation of the given flood histogram.
In this paper, we first present modified adaptive formulae for event positioning that provide a corrective mechanism for asymmetry and rotation of the flood histogram in addition to accounting for pincushion or barrel distortions. The optimal parameters that lead to the least distortion in each case are determined iteratively and automatically. Further, to facilitate implementation by others, we provide specific implementation details of our previously proposed segmentation scheme. We then evaluate quantitatively the performance of both the spatial distortion correction scheme and the segmentation method for PET detectors from the UC Davis MRI-compatible PET scanner. We show results for cases when the PET detector is both outside and in the magnetic field of a 7T MRI scanner.
II. Materials and Methods
A. PET data measurement inside and outside the MRI scanner
The PET scanner was first locked in position after inserting it into the bore of a Biospec 7T MRI scanner (Bruker BioSpin Corporation, Billerica, MA, USA). A cylindrical phantom (internal diameter = 5 cm, length = 4 cm) was filled with 14.8 MBq (400 μCi) of 18FDG solution and was placed into the field of view of the PET scanner. Five sets of data were acquired in singles mode when the static magnetic field was turned off. Each measurement lasted 5 min. The static magnetic field was then switched on and the data acquisition process was repeated. The data acquisition system consisted of NIM electronics and PowerDAQ PD2-MFS boards (United Industries Inc., Boston, MA, USA) synchronized with an Intel Pentium-4 Multiprocessor PC [17]. Since the static magnetic field alone was known to be the major contributor to signal distortion [4], no MRI sequence was used. The temperature of the PSAPDs was maintained at −10°C throughout the experiment. The energy window used was 350–650 keV.
B. Flood histogram generation
Flood histograms for the detector module are generated in two steps; (i) the output signals A, B, C, and D from the PSAPDs are preprocessed to compensate for effects due to optical fiber bending, and (ii) event positioning formulae are used to generate the probabilistic maps for measured events.
1) Preprocessing
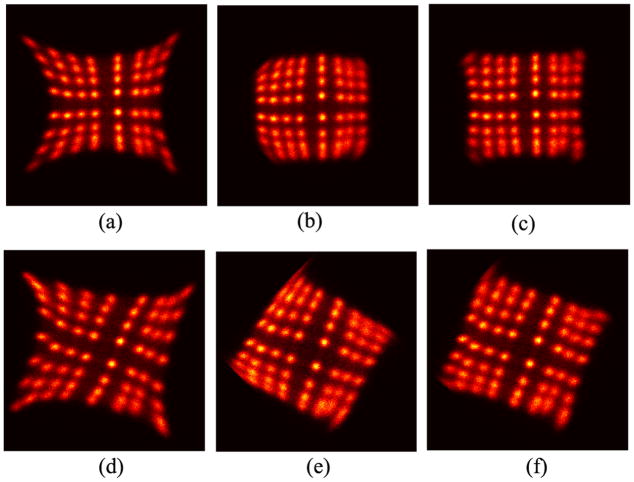
The preprocessing step primarily compensates for the different curvatures of the optical fibers used in the PET detector. This effect causes asymmetry along the central vertical axis in the flood histogram clearly visible in Fig. 1(b). Since this is a systematic effect, we correct it by appropriately scaling the four output signals of the PSAPD. We empirically found that a scaling of 1.3 for signals B and D and 1 for signals A and D using the Anger’s formulae produced a flood histogram that looks approximately symmetrical about the central horizontal and vertical axis. The resultant flood histograms outside and inside the MRI scanner after this compensation are shown in Fig. 2(a) and (d). The proposed scaling factors were found to be consistent for all modules of the scanner and were applied only for the purpose of flood histogram generation and crystal look-up and have no impact on energy computations.
Fig. 2.
Flood histograms after correction for effects of curved optical fibers; (a), (b) and (c) are for the PET detector when placed outside the 7T magnetic field, and (d), (e) and (f) are when the detector is placed in the magnetic field. (a) and (d) use Anger’s equations, (b) and (e) use Zhang’s method, and (c) and (e) use the proposed adaptive formulae with α = 0.7 and θ = 0°. All formulae are listed in in Table I
2) Formulae for generating flood histograms
Anger’s and Zhang’s event positioning formulae as a function of output signals A, B, C, and D are shown in row 1 and row 2 of table I respectively. The corresponding flood histograms in the absence of the static magnetic field are shown in Fig. 2(a) and (b) respectively. When the detectors are placed in the magnetic field, the flood histograms obtained are shown in Fig. 2(d) and (e). The previously proposed adaptive formulae are given in table I, row 3 [16]. The parameter α in the adaptive formulae is chosen iteratively to maintain a balance between the pincushioning and barrel effects for each device. This flexibility in the choice of α allows for compensating effects due to small changes in the resistive and capacitive networks in PSAPDs. However, once α is chosen for a single PSAPD or PSAPDs manufactured using identical processes, it may not require modification throughout the lifetime of the devices assuming stable operation. Details about choosing α are in Section II-E. With α = 0.7 in the adaptive formulae, we obtain the flood histograms shown in Fig. 2(c) and (f) in the absence and presence of magnetic field respectively. To further minimize spatial distortion in the flood histograms of detectors in magnetic field, the rotation angle needs to be estimated. An iterative scheme to automatically estimate θ is described in Section II-E. In row 4 of table I, formulae that compensate for the rotation of the flood histogram due to magnetic field are presented. Results after this compensation is applied will be shown in Section III-A.
TABLE I.
Table of flood histogram formulae
| Anger’s equations: |
|
|
| Zhang’s method: |
|
|
| Adaptive method: |
Xc = αXa + (1 − α)Xb, where α ∈ [0, 1], Yc = αYa + (1 − α)Yb. |
|
| In magnetic field: |
Xd = Xc cos (θ) + Yc sin (θ), Yd = −Xc sin (θ) + Yc cos (θ). |
C. Segmentation method
We perform the segmentation of the distortion corrected flood histogram in three steps; (i) intensity compensation in the flood histogram, (ii) generation of a template image and its segmentation, and (iii) registration of the template to the flood histogram. Using the warping field computed in step (iii), the segmentation of the template can be transformed to the coordinates of the flood histogram, hence segmenting the flood histogram. The detailed procedure is outlined below. We demonstrate the procedure on the flood histogram shown in Fig. 2(c).
For our discussion, let h(x, y) represent the flood histogram with 0 ≤ x ≤ M − 1 and 0 ≤ y ≤ N − 1. We denote the spatial frequencies corresponding to x and y by fx and fy where 0 ≤ fx ≤ M − 1 and 0 ≤ fy ≤ N − 1. Thus, the 2-D Discrete Fourier Transform (DFT) pair is related by
| (1) |
| (2) |
where H(fx, fy) denotes the DFT of h(x, y). In the discussion that follows, we use Dx and Dy to denote the number of crystals in the detector array in the horizontal and vertical directions respectively.
1) Intensity compensation
There may be large variations in the efficiencies of the crystals in the detector array [18]. As a result, crystals with high efficiencies would produce brighter spots in the flood histogram compared to those with low efficiencies. Intensity compensation is desirable to reduce the computational burden on the segmentation algorithm. To achieve this, we first compute H(fx, fy). We then compute a low pass filtered version k(x, y) of h(x, y) using the following equation:
| (3) |
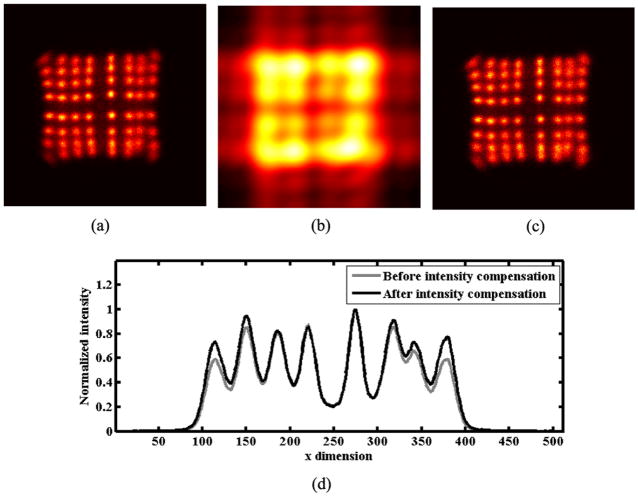
|k(x, y)| is a smoothed version of h(x, y) and highlights the areas of high and low intensities in the flood histogram as is seen in Fig. 3(b). The number 7 for Fourier coefficients was chosen empirically and need not be modified for different devices. We then compute the intensity corrected image p(x, y) as
Fig. 3.
Intensity compensation; (a) the flood histogram from Fig. 2(c) for comparison, (b) the smoothed image |k(x, y)|, (c) the intensity compensated image p(x, y), and (d) normalized intensity profiles obtained by summing (a) and (c) along the y dimension.
| (4) |
where the division is element-wise. The intensity corrected image p(x, y) for the flood histogram in Fig. 3(a) is shown in Fig. 3(c). Fig. 3(d) shows summed horizontal profiles obtained from Fig. 3(a) (before intensity compensation) and Fig. 3(c) (after intensity compensation).
2) Generation of the template
Let P(fx, fy) represent the DFT of p(x, y). The horizontal components in P(fx, fy) correspond to vertical patterns in p(x, y), while the vertical components in P(fx, fy) correspond to horizontal pattens in p(x, y). We form Q(fx, fy) using the following:
| (5) |
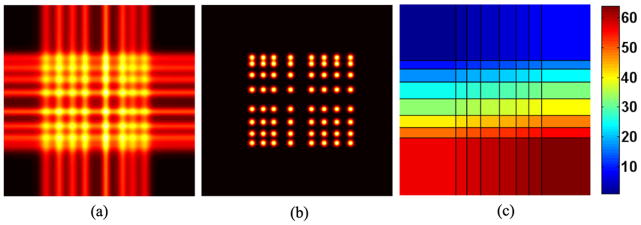
From Q(fx, fy), we compute its 2-D inverse Fourier transform q(x, y). q(x, y) is made up of horizontal and vertical lines highlighting the corresponding patterns in h(x, y) as shown in Fig. 4(a). We then calculate projections of q(x, y) along the vertical and horizontal axes as:
| (6) |
| (7) |
Fig. 4.
Generation of the template image; (a) image q(x, y) determined by Fourier analysis, (b) the template image t(x, y), (d) segmentation w(x, y) of t(x, y) showing all 64 regions in pseudo-color
From the one dimensional sx (x), we compute the location of exactly Dx peaks. This is done by computing the zero-crossing locations of ∇sx (x) and from those, determining a subset where ∇2sx (x) is negative. In the same way, Dy peak locations are determined from sy (y). Let Ax denote the set of the Dx peak locations in the horizontal direction and Ay denote the set of Dy peak locations in the vertical direction. We then create a binary image b(x, y) such that
| (8) |
This binary image is then smoothed by convolving it with a 2D spatial Gaussian filter g(x, y) whose standard deviation is set to be one third of the shortest distance between adjacent peaks in the horizontal and vertical directions. The resulting image is what we call the template t(x, y):
| (9) |
The template obtained for the flood histogram under consideration is shown in Fig. 4(b). Since the peak locations are known, t(x, y) can be segmented by horizontal and vertical lines drawn midway between the peak locations. The resulting segmentation w(x, y) with region labels in pseudo-color is shown in Fig. 4(c).
3) Registration of the template to the flood histogram
For registering image t(x, y) to p(x, y), we use an intensity-based warping scheme with polynomial bases. The objective of the registration scheme is to find a deformation field u(x, y) such that the root mean square (RMS) intensity difference between the target image p(x, y) and the deformed template image t((x, y) − u(x, y)) is minimized. The RMS cost functional is given by
| (10) |
where u(x, y) = [u1(x, y), u2(x, y)] is a 2D vector function, and u1 and u2 are the coordinate components of u respectively. By writing the deformation fields in terms of polynomials, we get
| (11) |
| (12) |
where n is the rank of the polynomial bases and and are coefficients of the polynomial bases.
In order to minimize C(u(x, y)) in (10) as a function of the polynomial coefficients, we use the conjugate gradient algorithm [19]. The line-search used in the conjugate gradient algorithm searches in the descent direction following the Armijo rule for stepsize reduction [20]. The gradient of the cost functional C with respect to the coefficients and is computed as follows:
| (13) |
Similarly,
| (14) |
Here and are ∇t(x, y) interpolated at (x, y) − u1(x, y) and (x, y) − u2(x, y) respectively. The derivative operators in the above equations are discretized by using the central difference approximation.
Since the order of the polynomials used is very low, the resulting displacement is sufficiently smooth and regularizers such as linear elastic energy are not required in practice. Let Φ = (ϕ1, ϕ2) denote the mapping resulting from this transformation, i.e. Φ: (x, y) ↦ (x, y) − u(x, y). The Jacobian of this mapping is given by
| (15) |
To test the invertibility of the deformation field, we make sure that J(Φ) has a positive determinant at every step [21]. If this is not the case, a lower order polynomial basis is chosen to approximate the transform. The iterations are stopped when the determinant becomes non-positive. The diffeomorphic mapping Φ thus calculated is applied to w(x, y) to obtain the segmentation of the flood histogram. The algorithm is implemented in MATLAB® (The MathWorks, Inc., Natick, MA, USA).
D. Tool for manual correction
For exceptional cases where peaks are incorrectly identified, we have developed a graphical tool where the user can manually click on those crystals in p(x, y) that are not delineated accurately. As a result, p(x, y) is directly modified by artificially drawing spots and the segmentation procedure is repeated. The most number of individual clicks that are required for this procedure (assuming all crystals are misclassified) is Dx + Dy −1 (Dx clicks horizontally and Dy −1 clicks vertically), which is still substantial saving compared to Dx × Dy clicks required for manual segmentation.
E. Iterative determination of α and θ
The α parameter for each detector is determined when the magnetic field is switched off. For iteratively calculating α, we first start with α = 0 in the adaptive formulae (table I, row 3). Therefore, our formulae become equivalent to Zhang’s formulae. After computing the resulting flood histogram from Xc and Yc, we compute the intensity corrected image p(x, y) as described in Section II-C1. We then compute sx(x) and sy(y) from equations (6) and (7), and try to identify Dx and Dy peaks respectively in them using the DFT based procedure outlined in Section II-C2. If we are not successful, we increment α by 0.05 each time and repeat the peak identification procedure. We terminate the procedure when all Dx peaks in the horizontal direction and Dy peaks in the vertical direction are identified. The α value for each device is stored for future use.
The rotation θ in table I, row 4 is determined for each detector when the magnetic field is switched on. The procedure is similar to that for choosing α, except that we start with an initial guess for θ. Equations from table I, row 4 are used with the earlier computed α. We then vary θ over ±10°, 1° each time, and attempt to identify Dx and Dy peaks. We stop when all peaks are appropriately identified. If an α or θ that yields satisfactory results is not found, we switch to the manual correction tool.
F. Studies comparing manual segmentation to the proposed automatic method
For comparative studies, flood histograms were segmented using a manual method and automatic method. In the manual method, the flood histogram was obtained using Anger’s equations. A user blind to the findings of the automatic method clicked on the locations of Dx × Dy peaks. The clicked locations then were used to create a binary file, which was subjected to segmentation using the watershed method. For the automatic method, α and θ were determined iteratively and the distortion corrected flood histogram was generated. Segmentation was then carried out automatically using the procedure described in Section II-C. All five data sets were segmented using both manual and automatic methods.
III. Results
A. Spatial distortion correction and segmentation
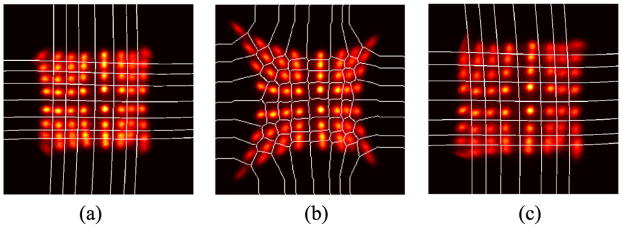
We show our spatial distortion and segmentation results in Fig. 5(a) and (c) where the segmented region boundaries are overlaid on the distortion-corrected flood histograms. Both underlying flood histograms are for the same detector when placed outside and in the magnetic field respectively. The iteratively determined α value for this detector was 0.7. Since the flood histogram in Fig. 5(a) was obtained when the magnetic field was off, θ = 0° was used. For the case when the detector was in the 7T magnetic field (Fig. 5(c)), we iteratively determined θ = 21°. We also found that the 21° rotation remained unchanged for other PET detectors in the scanner that had the same orientation. For detectors that showed an anti-clockwise rotation, we found θ = −21°. On an Intel Xeon, 2.33 GHz computer, the iterative computation of α and θ took about 1.1 sec each. Template generation took 0.2 sec. The segmentation procedure for results shown in Fig. 5 took on an average of 28 sec each. All 64 crystals were automatically identified. This procedure was repeated for all five data sets. The results for each set were very similar to those shown in Fig. 5 and hence are not shown. In Fig. 5(b), we show a flood histogram corresponding to the same data set as Fig. 5(a) except that it was generated using Anger logic and segmented using manual clicking on a computer screen 64 times, followed by watershed method-based segmentation.
Fig. 5.
Distortion corrected flood histograms with overlaid segmentation boundaries; (a) flood histogram when the PET detector was outside the magnetic field (α = 0.7, θ = 0°), (b) flood histogram generated from the same data set as in (a) but with Anger logic and segmented using the manual clicks on the peaks followed by the watershed method-based segmentation, (c) flood histograms when the PET detector was inside the 7T magnetic field (α = 0.7, θ = 21°). Segmented region boundaries are denoted by white lines. Slight mis-segmentations may happen for either case. Higher order polynomials may be used in our case to to approximate the deformation fields. We describe the trade-offs of this prospect in Section IV.
B. Quantitative comparison between manual segmentation and the automatic method
To quantitatively compare results obtained using the distortion correction scheme and the semi-automatic segmentation method (Fig. 5(a)) with manual segmentation of histograms obtained using Anger logic (which in this case, may be considered a gold standard, Fig 5(b)), we analyzed three parameters for all 64 crystals in the detector arrays, namely, (i) photopeak positions, (ii) energy resolution, and (iii) uniformity of counts. This was done for detectors both with magnetic field switched off and on. In the following three subsections, we show our results. Since the results with magnetic field switched on were similar to those when magnetic field was off, we focus on the case when magnetic field was off. The crystals in Fig. 5(a) and (b) are numbered such that the crystal in the top left corner is assigned #1. The crystal number is then incremented by 1 horizontally moving left-to-right. When the end of the line is reached, the counting continues with the leftmost crystal in the next horizontal line. Thus, crystal 1, 8, 57 and 64 are corner crystals, while crystals 1–8, 9, 16, 17, 24, 25, 32, 33, 40, 41, 48, 49, 56, 57–64 are edge crystals.
1) Photopeak position
For each crystal in the array, the energy histogram was obtained and the photopeak location (Eγ) was determined. In Fig. 6, we show measured photopeak positions for all 64 crystals obtained from segmentations shown in Fig. 5(a) and (b). The differences between the two schemes are statistically insignificant for the five data sets.
Fig. 6.
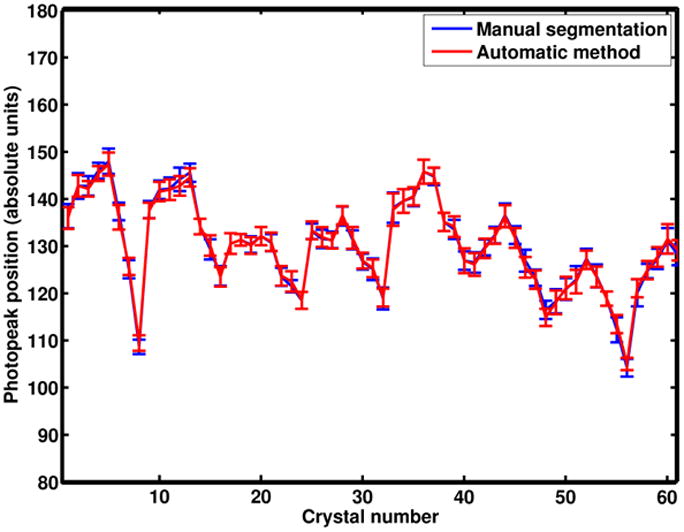
Mean photopeak positions for all 64 crystals obtained using the segmentation in Fig. 5(b) and with the proposed automatic method (Fig. 5(a)). The error bars indicate the standard deviation over the five sets of data.
2) Energy resolution (ER)
The full-width-at-half-maximum (FWHM) (denoted as ΔE) of the energy spectrum around the photopeak for each crystal was determined. The energy resolution was then computed using
| (16) |
Fig. 7 shows a plot of the measured energy resolutions for all 64 crystals using the two methods. The average energy resolution using manual segmentation for the flood with Anger logic was measured at 21.11 ± 1.75%. In the case where the proposed distortion correction and automatic segmentation schemes were used, the average energy resolution was 20.81 ± 1.53%. The overall differences are statistically insignificant.
Fig. 7.
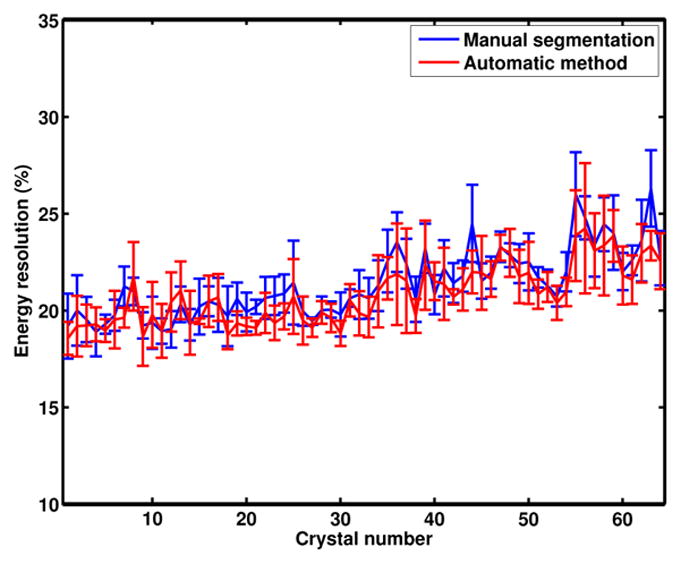
Crystal-wise energy resolution (%) using manual segmentation and the proposed automatic method for the five sets of data. The error bars indicate standard deviation over the data sets.
3) Uniformity of counts
Fig. 8 shows a plot of the total counts measured in each crystal for the five data sets. Overall, we observe that the corner crystals tend to have more counts when the proposed positioning method is used. However, the same cannot conclusively be said about edge crystals. We thus conclude that overall, comparable uniformity is obtained using the proposed method and the manual segmentation scheme. Zhang et al. [8] found that their event positioning method led to better uniformity of counts based on only those counts that are within the FWHM of the photopeak position. In our analysis, we instead consider all measured counts per crystal, and thus, calculate overall crystal efficiencies in the 350–650 keV energy window.
Fig. 8.
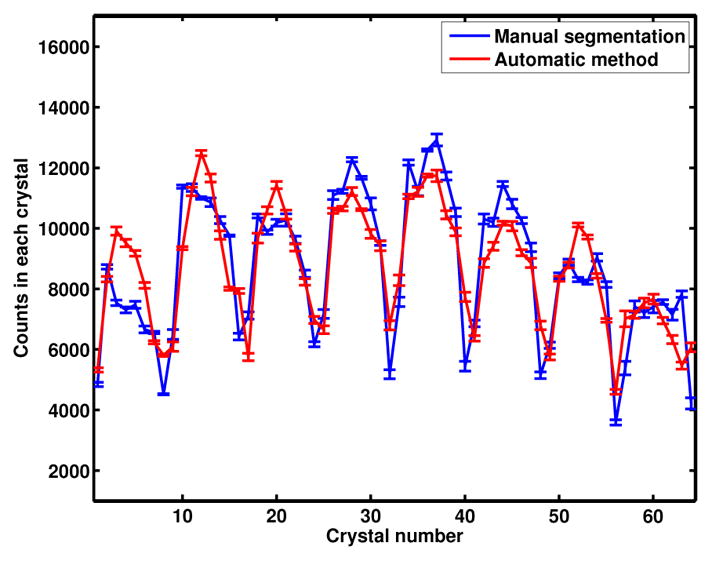
Total measured counts in each crystal after segmentation for the two methods. The error bars indicate standard deviation over the five data sets.
IV. Discussion
We have extended the use of our adaptive spatial distortion correction scheme for flood histograms of PSAPD-based PET detectors for compensating effects of a 7T magnetic field on the detectors. By choosing an appropriate α parameter to strike a balance between two existing schemes, flood histograms with minimal pincushion or barrel distortions are obtained. The proposed scheme also allows flexibility for choosing a θ value based on the magnetic field to be used for scanning. Both α and θ parameters are iteratively determined by an automatic procedure and do not require human involvement. We also have provided implementation details for our previously proposed semi-automatic flood histogram segmentation scheme [16].
In our semi-automatic segmentation scheme, we generate a template image and register it to the given flood histogram. For this purpose, we propose a diffeomorphic warping scheme that is free from ambiguities due to ill-conditioned mapping between the template and the flood histogram. However, this is more of a matter of convenience than a necessity. After generating a template as described in this paper, other registration schemes available in public domain (e.g. Automated Image Registration [22], [23]) can be employed. To nullify the effect of ambiguities (since invertibility will not necessarily be enforced), one may be able to apply a median filter to the resulting image followed by nearest neighbor interpolation and potentially remove errors due to ambiguities. However, this scheme needs thorough evaluation. Additionally, if the detectors do not undergo major design changes and have consistent performance, one can store the template image permanently and reuse it to compute the segmentation when need be. We also note that even theoretically, spatial distortions in flood histograms for PSAPDs cannot completely be corrected [9]. If they could be corrected, one would simply use the segmentation of the template as the final segmentation of the flood histogram and the warping procedure would not be required. However, since residual distortion remains, the warping procedure is necessary.
We conducted quantitative studies comparing the conventional method (flood histograms generated using Anger’s equation followed by watershed-based segmentation) to the distortion correction scheme and semi-automatic segmentation method described in this paper. The two schemes were first compared based on crystal-wise photopeak position and energy resolution. Insignificant differences were found in photopeak positions. The very minor improvement in energy resolution that was observed for the proposed method may be attributed to improved photon statistics in corner crystals. Over all five data sets, however, this improvement was smaller than individual variability.
We also compared the total number of counts registered in individual crystals for the two schemes. Uniformity of counts in crystals not only depends on how well the distortion is corrected but also on how accurate the segmentation is. For example, some crystals in the resulting segmentation in Fig. 5(a) and (c) appear partially truncated due to segmentation boundaries. An obvious way to reduce this error is to use higher order polynomials to approximate the warping field. This however, may lead to three potential challenges. Firstly, the number of bases used for a given degree of the polynomial are given by the sum of the corresponding row in Pascal’s triangle. This number grows rapidly, and in turn, increases computational burden. Secondly, implementation of diffeomorphic constraints for higher order polynomials can become non-trivial [24]. And thirdly, while trying to account for higher order deformations, some constraints on the warping field are necessary. Thus, regularization schemes need to be implemented [25]. As a result, both computational complexity and required time may increase substantially.
Our quantitative results indicate that the performance of the proposed method is comparable to that of the conventional method. However, the real major benefit from the proposed method is in decreasing human effort and time. As an example, the manual segmentation scheme applied to one PET/MR detector required 64 clicks on the computer screen and a total of about 90 seconds. The same flood histogram was automatically segmented in 28 sec without human involvement. This saving in time and effort would potentially be huge when thousands of crystals in the scanner would require to be identified. In addition, we also have developed a tool for manual correction of the flood histogram in exceptional cases. Considerable time and effort is saved even if this tool is put to use compared to manual segmentation.
V. Conclusions
We have developed a distortion correction scheme and an efficient semi-automatic crystal identification scheme for PSAPD-based PET detectors and have quantitatively assessed its performance for use with the UC Davis MRI-compatible PET scanner. The proposed scheme requires minimum human involvement while still allowing considerable flexibility and thus, potentially should accelerate routine detector calibration and characterization studies. The proposed scheme is generic and has the potential to be employed for a broader range of PET scanners based on PSAPDs.
Acknowledgments
The authors would like to thank Dr Yongfeng Yang and Spencer L. Bowen from the Department of Biomedical Engineering, University of California - Davis, Davis, CA 95616, USA for their help in the preparation of this manuscript. This work was funded in part by the American Cancer Society award IRG-95-125-07, by the National Institutes of Health R44-CA094385, and by the Susan G. Komen Foundation award BCTR0707455. This publication was also made possible by Grant Number UL1 RR024146 from the National Center for Research Resources (NCRR), a component of the National Institutes of Health (NIH), and the NIH Roadmap for Medical Research. Its contents are solely the responsibility of the authors and do not necessarily represent the official view of NCRR or NIH.
References
- 1.Catana C, Procissi D, Wu Y, Judenhofer M, Qi J, Pichler B, Jacobs R, Cherry S. Simultaneous in vivo positron emission tomography and magnetic resonance imaging. Proceedings of the National Academy of Sciences. 2008;105(10):3705. doi: 10.1073/pnas.0711622105. [DOI] [PMC free article] [PubMed] [Google Scholar]
- 2.Judenhofer M, Wehrl H, Newport D, Catana C, Siegel S, Becker M, Thielscher A, Kneilling M, Lichy M, Eichner M, et al. Simultaneous PET-MRI: a new approach for functional and morphological imaging. Nat Med. 2008;14(4):459–465. doi: 10.1038/nm1700. [DOI] [PubMed] [Google Scholar]
- 3.Schlemmer H, Pichler B, Wienhard K, Schmand M, Nahmias C, Townsend D, Heiss W, Claussen C. Simultaneous MR/PET for brain imaging: First patient scans. Society of Nuclear Medicine Annual Meeting Abstracts. 2007;48(Supplement 2):45P. [Google Scholar]
- 4.Catana C, Wu Y, Judenhofer M, Qi J, Pichler B, Cherry S. Simultaneous Acquisition of Multislice PET and MR Images: Initial Results with a MR-Compatible PET Scanner. Journal of Nuclear Medicine. 2006;47(12):1968. [PubMed] [Google Scholar]
- 5.Shah KS, Farrell R, Grazioso R, Harmon ES, Karplus E. Position-sensitive avalanche photodiodes for gamma ray imaging. IEEE Transactions on Nuclear Science. 2002;49(4):1697–1692. [Google Scholar]
- 6.Anger HO. Scintillation camera with multichannel collimators. J Nucl Med. 1964;5:515–31. [PubMed] [Google Scholar]
- 7.Hall E. On a new action of the magnet on electric currents. Amer J Math. 1879;2:287. [Google Scholar]
- 8.Zhang J, Olcott PD, Levin CS. A New Positioning Algorithm for Position-Sensitive Avalanche Photodiodes. IEEE Transactions on Nuclear Science. 2007;54(3):433–437. doi: 10.1109/TNS.2007.894129. [DOI] [PMC free article] [PubMed] [Google Scholar]
- 9.Despres P, Barber WC, Funk T, McClish M, Shah KS, Hasegawa BH. Modeling and Correction of Spatial Distortion in Position-Sensitive Avalanche Photodiodes. IEEE Transactions on Nuclear Science. 2007;54(1):23–29. [Google Scholar]
- 10.Haralick R, Shapiro L. Computer and Robot Vision. Addison-Wesley Longman Publishing Co., Inc; Boston, MA, USA: 1992. [Google Scholar]
- 11.Mao A. Positron emission tomograph detector module calibration through morphological algorithms and interactive correction. International Student Technical Writing Competition winners. 1999–2000 [Google Scholar]
- 12.Lazzerini B, Marcelloni F, Marola G. Calibration of positron emission tomograph detector modules using new neural method. Electronics Letters. 2004;40(6):360–361. [Google Scholar]
- 13.Hu D, Atkins B, Lenox M, Castleberry B, Siegel S. Nuclear Science Symposium Conference Record, 2006. Vol. 4. IEEE; 2006. A Neural Network Based Algorithm for Building Crystal Look-up Table of PET Block Detector. [Google Scholar]
- 14.Semmaoui H, Viscogliosi N, Lecomte R, Fontaine R. Wavelets-Based Crystal Identification of Phoswich Detectors for Small-Animal PET. IEEE Transactions on Nuclear Science. 2008;55(3):930–935. [Google Scholar]
- 15.Viscogliosi N, Riendeau J, Bérard P, Tétrault M, Lefebvre R, Lecomte R, Fontaine R. Real Time Implementation of a Wiener Filter Based Crystal Identification Algorithm. IEEE Transactions on Nuclear Science. 2008;55(3):925. [Google Scholar]
- 16.Chaudhari AJ, Joshi AA, Bowen SL, Leahy RM, Cherry SR, Badawi RD. Crystal identification in positron emission tomography using nonrigid registration to a Fourier-based template. Physics in Medicine and Biology. 2008;53(18):5011–5027. doi: 10.1088/0031-9155/53/18/011. [DOI] [PMC free article] [PubMed] [Google Scholar]
- 17.Judenhofer MS, Pichler BJ, Cherry SR. Evaluation of high performance data acquisition boards for simultaneous sampling of fast signals from PET detectors. Physics in Medicine and Biology. 2005;50(1):29–44. doi: 10.1088/0031-9155/50/1/003. [DOI] [PubMed] [Google Scholar]
- 18.Dahlbom M, Hoffman EJ. An evaluation of a two-dimensional array detector for high resolution PET. IEEE Trans Med Imaging. 1988;7(4):264–72. doi: 10.1109/42.14508. [DOI] [PubMed] [Google Scholar]
- 19.Luenberger D. Linear and Nonlinear Programming. 2. Addison-Wesley Inc; Massachusetts: 1984. [Google Scholar]
- 20.Armijo L. Minimization of Functions Having Lipschitz-Continuous First Partial Derivatives. Pacific J Math. 1966;16:1–3. [Google Scholar]
- 21.Jost J. Riemannian geometry and geometric analysis. 2. Springer Verlag; 2002. [Google Scholar]
- 22.Woods R, Grafton S, Holmes C, Cherry S, Mazziotta J. Automated Image Registration: I. General Methods and Intrasubject, Intramodality Validation. Journal of Computer Assisted Tomography. 1998;22(1):139. doi: 10.1097/00004728-199801000-00027. [DOI] [PubMed] [Google Scholar]
- 23.Woods R, Grafton S, Watson J, Sicotte N, Mazziotta J. Automated Image Registration: II. Intersubject Validation of Linear and Nonlinear Models. Journal of Computer Assisted Tomography. 1998;22(1):153. doi: 10.1097/00004728-199801000-00028. [DOI] [PubMed] [Google Scholar]
- 24.Johnson HJ, Christensen GE. Consistent landmark and intensity-based image registration. IEEE Trans Med Imaging. 2002;21(5):450–461. doi: 10.1109/TMI.2002.1009381. [DOI] [PubMed] [Google Scholar]
- 25.Holden M. A Review of Geometric Transformations for Nonrigid Body Registration. IEEE Trans Med Imaging. 2008;27(1):111–128. doi: 10.1109/TMI.2007.904691. [DOI] [PubMed] [Google Scholar]


