Abstract
Complex polarization ratio (CPR) in materials with birefringence and biattenuance is shown as a logarithmic spiral in the complex plane. A multi-state Levenberg-Marquardt nonlinear fitting algorithm using the CPR trajectory collected by polarization sensitive optical coherence tomography (PS-OCT) was developed to determine polarization properties of an anisotropic scattering medium. The Levenberg-Marquardt nonlinear fitting algorithm using the CPR trajectory is verified using simulated PS-OCT data with speckle noise. Birefringence and biattenuance of a birefringent film, ex-vivo rodent tail tendon and in-vivo primate retinal nerve fiber layer were determined using measured CPR trajectories and the Levenberg-Marquardt nonlinear fitting algorithm.
1. Introduction
Polarization-sensitive optical coherence tomography (PS-OCT) is a non-invasive imaging modality that provides depth-resolved polarimetric information with high-resolution in anisotropic tissues [1,2]. Measurement of depth-resolved polarimetric information by PS-OCT is widely investigated for diagnosis of various pathological conditions or trauma by observing the variation of polarimetric properties between normal and abnormal tissues [3–8].
In general PS-OCT, horizontal and vertical interference fringe magnitudes and relative phase as a function of depth (z) are recorded by controlling polarization elements in source, sample and reference paths of time- or frequency-domain OCT instrumentation [9,10]. Diverse analytic techniques have been used to extract polarimetric information such as depth-resolved phase retardation (δ(z)), birefringence (Δn), amplitude attenuation (ε(z)) (or diattenuation (d(z))), biattenuance (Δχ), and optic axis orientation (α) from , and [11–27]. In early PS-OCT studies, the phase retardation was computed from the arc tangent of the ratio of the horizontal and vertical fringe magnitudes [1,11]. Although this technique was simple and appropriate for a coarse two-dimensional image, polarimetric values in a target region (e.g. retinal nerve fiber layer in retina) were not accurately computed due to background noise including speckle [9].
A Mueller matrix formalism was applied to time- and frequency-domain PS-OCT to obtain the polarimetric properties of biological tissue [12–14]. A two-dimensional depth-resolved 4 × 4 Mueller matrix of the tissue sample was measured by open-air and fiber-based PS-OCT systems. Birefringence, diattenuation and optic axis orientation were extracted from the measured Mueller matrix. Although the Mueller matrix can provide the complete polarimetric transformation of the tissue specimen, each element of the Mueller matrix is not easily interpreted.
A Jones matrix formalism was applied to analyze polarization state of light backscattered from tissue and recorded by PS-OCT [15–19]. Light propagation into many components (including tissue specimen) was described by products of Jones matrices in time-domain fiber-based PS-OCT. Birefringence, diattenuation and optic axis orientation of the samples were determined by calculation of the Jones matrices [15]. Similar to Mueller matrix images using PS-OCT, two-dimensional depth-resolved Jones matrix images were demonstrated and local polarization properties such as phase retardation, diattenuation, and optic axis orientation were computed in open-air [16,17] and fiber-based [18,19] Fourier-domain PS-OCT.
Stokes parameters are also utilized to analyze polarimetric properties of biological tissue using PS-OCT [20–27]. In early studies using Stokes parameters, two-dimensional images of depth-resolved Stokes parameters were generated and compared to intensity images for identifying tissue characteristics [20,21]. As the Stokes parameters are represented geometrically as a three-dimensional vector (Stokes vector), polarization properties of tissue in PS-OCT can be visually interpreted compared with other polarization analysis techniques such as Jones vectors. Depth-resolved Stokes vectors on the Poincaré sphere allow visualization of the polarization state of light backscattered by a tissue specimen. Birefringence and optic axis orientation were obtained by vector calculation using the depth-resolved Stokes vectors in a fiber-based PS-OCT instrument [22,23]. Trajectory of the depth-resolved Stokes vectors on the Poincaré sphere was theoretically and experimentally investigated corresponding to light propagation in anisotropic tissues. Numerical expressions of the trajectory and associated differential geometry were derived for materials with arbitrary birefringence, biattenuance and optic axis orientation [24]. A Levenberg-Marquardt nonlinear fitting algorithm with multi-incident polarization states of light were applied to analyze the depth-resolved Stokes parameters of backscattered light from tissue specimens recorded by an open-air PS-OCT instrument. Tissue birefringence, biattenuance, and optic axis orientation were determined by estimating Stokes parameters from speckle-noise corrupted PS-OCT data. Multiple incident polarization states of light were used to suppress noise and increase polarimetric signal to noise ratio (PSNR) of PS-OCT data [25–27].
Complex valued analytic signals are utilized to solve a variety of problems arising in science and engineering. Even though real numbers are natural for representing recorded data, complex numbers provide a useful approach to analyze many engineering problems. In control theory, systems are transformed from time-domain to frequency-domain, and vice versa using Laplace or Z-transforms. Characteristics of systems are analyzed by poles and zeros using signals represented as complex numbers in the complex plane [28]. In other fields such as fluid dynamics, quantum mechanics, relativity and applied mathematics [29], complex numbers are routinely employed to represent real phenomena.
We demonstrate a new approach which analyzes the trajectory of the complex polarization ratio (CPR) in the complex plane of PS-OCT data to determine polarimetric properties of biological tissues. The technique using CPR combines the advantages of matrix formalisms (Jones and Mueller matrices) and Stokes parameters. Similar to Jones and Mueller matrices, CPR can mathematically express the polarization state of light backscattered from tissue as a single complex number. Computations relating to the polarization state of light are simplified, however, because the CPR is a single number. Similar to Stokes vectors on the Poincaré sphere, CPR may be displayed geometrically to visualize the polarization state of light backscattered from tissue on a complex plane. Moreover, two-dimensional display of CPR on the flat complex plane is more convenient than three-dimensional display of Stokes vectors on the Poincaré sphere.
We utilized a Levenberg-Marquardt nonlinear fitting algorithm to determine the polarization properties of a tissue specimen from CPR trajectories in the complex plane. The algorithm was verified using CPR trajectories of simulated PS-OCT data corrupted with polarimetric speckle noise. In addition, the CPR algorithm was applied to PS-OCT data recorded from a birefringent film, ex-vivo rodent tail tendon and in-vivo primate retinal nerve fiber layer (RNFL).
2. Background and Theory
2.1 Definition of complex polarization ratio
Ellipsometry is an optical technique for determining polarization properties of a material by observing the change of polarization state of light reflected from a sample surface. Jones vector and complex polarization ratio (CPR) are used to describe purely polarized light. However, Stokes vector and coherence matrix formalisms are the most general representations of the polarization state of incident light. Both representations describe both polarized and unpolarized components of light, whereas Jones vector and CPR are used to describe purely polarized components [30,31].
The CPR (Cyx) is defined by the ratio of Jones vector components (Ex and Ey) according to an arbitrary polarization bases (x, y) as
| (1) |
where | Cyx |=| Ey | / | Ex | and are relative magnitude and relative phase, respectively [30,31].
2.2 Characteristics of complex polarization ratio
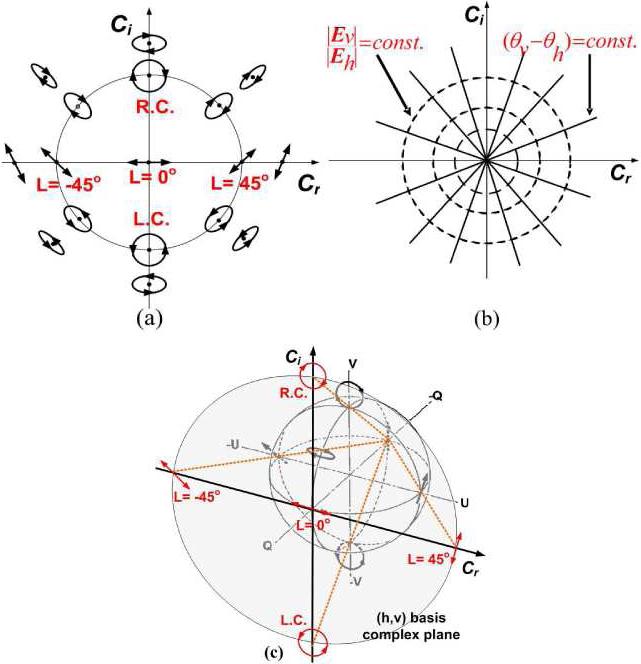
An arbitrary CPR representing a purely polarized state of light can be assigned to a point on the Cartesian complex plane. All purely polarized states of light can be transformed from the CPR representation on the Cartesian complex plane (more simply the complex plane). For example, if linearly horizontal (h) and vertical (v) polarization states of light are used as an orthonormal basis set, the origin (Cvh = 0) and the point-at-infinity (Cvh = ∞) in the complex plane are assigned to horizontal (h) and vertical (v) polarization states of light, respectively. For this basis set, all linear polarization states of light are located on the real axis of the complex plane with the assignments of linear 45° and –45° polarization states at 1 and –1(Cvh = 1 and –1) respectively. Two points (Cvh = j and −j) on the imaginary axis represent right and left circular polarization states of light respectively. All other points excluding the real axis and the two points on the imaginary axis represent elliptical polarization states (Fig. 1(a)). Interestingly, if the relative magnitude is constant (| Cvh |=| Ev | / | Eh | = constant), the locus of points in the complex plane is a circle with a center at the origin. Similarly, if the relative phase is constant , the locus of the points is a straight line passing through the origin (Fig. 1(b)) representing lines of latitude and longitude on the Poincaré sphere respectively. The complex plane used to represent the CPR may be directly mapped geometrically to the Poincaré sphere of unit diameter by stereographic projection (Fig. 1(c)) [30,31].
Fig. 1.
(a) Assignment of polarization states in the (h, v) basis Cartesian complex plane (L = 0°: Linearly horizontal, L = 45°: Linearly 45°, L = –45°: Linearly –45°, R.C.: right circular, L.C.: left circular polarization states) (b) Loci of polarization states of constant relative magnitude (| Cvh |=| Ev | / | Eh |) and phase . (c) Relationship between (h, v) basis complex plane and Poincaré sphere. The Poincaré sphere of unit diameter is transformed to the complex plane by stereographic projection.
2.3 Change of polarization basis vectors
Although a horizontal and vertical linear polarization basis set (h, v) is commonly used in CPR polarization analysis, any two fixed elliptic states (a, b) can be selected as a basis set. Position of CPR in the complex plane depends on the selected basis set, and numerous displays of CPR on the complex plane are possible. An algebraic expression for transformation of the CPR due to a change in basis set is easily derived from Jones vector calculus. An arbitrary state of polarized light expressed by Jones vector (Exy) with the basis set (x, y) can be expressed as a linear combination of basis Jones vectors corresponding to the basis set (a, b) where fij are complex numbers representing the basis transformation. If Exy is written as
| (2) |
the transformation of CPR between basis sets (x, y) and (a, b) is computed by taking the ratios in both sides of Eq. (2), and gives
| (3) |
The ratio of two linear functions (Eq. (3)) is a Möbious (or linear fractional) transformation. Lines and circles in the basis states (x, y) are mapped to lines and circles in the basis set (a, b) (and vice versa) by the characteristics of the Möbious transformation [30,31].
2.4 CPR trajectory
We consider a birefringent tissue with a polarization state corresponding to an optic axis given by CPR a and an orthogonal state b. The orthonormal basis pair is represented by (a, b). We consider this basis set and examine the CPR trajectory corresponding to light propagation in the birefringent tissue. After forward-scattered light propagates a distance (z) through tissue, the CPR with an arbitrary polarization basis set (a, b) is given by
| (4) |
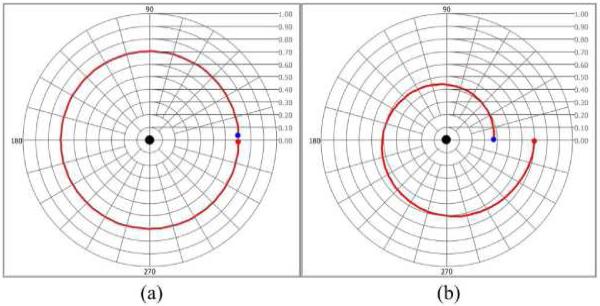
where δ(z) and ε(z) are the depth-resolved phase retardation and amplitude attenuation, respectively [24]. When the optic axis corresponds to either states a or b, a depth-resolved trajectory of the CPR in the (a, b) basis complex plane is generated by rotation δ(z) and attenuation ε(z) (Fig. 2). Considering only δ(z), the trajectory of the CPR uniformly rotates around the origin and forms a circular arc (Fig. 2(a)). Diattenuation (or biattenuance [27]) leads to ε(z) exponentially collapsing the trajectory for increasing depths (z). Therefore, trajectory in the complex plane with both δ(z) and ε(z) becomes a logarithmic spiral converging toward the origin in the (a, b) basis set (Fig. 2(b)).
Fig. 2.
CPR trajectories in the complex plane. (a) Trajectory with only phase retardation (δ(z) = 360°) uniformly rotates around the origin (black dot) (b) Trajectory with phase retardation (δ(z) = 360°) and amplitude attenuation (ε(z) = 36°) is a logarithmic spiral converging toward the origin. (Red and blue dots represent the first and last CPRs, respectively).
3. Methods
3.1 Generation of simulated PS-OCT data
Multi-state, noise-free PS-OCT data were generated to verify polarization analysis using the CPR representation. The M incident polarization states were uniformly distributed on a meridian of the Poincaré sphere. A Jones matrix formalism was used to transform each incident polarization state due to light propagation through the material [14,15]. The transform gave noise-free PS-OCT data as a function of depth (z) for the M polarization states. For practical simulations, speckle-noise corrupted PS-OCT data were also generated by adding random speckle noise onto noise-free PS-OCT data. Random speckle noise had a uniformly distributed phase variation between 0 and 2π radians and Gaussian distributed magnitude variation with zero mean and standard deviation (σ).
3.2 Acquisition of tissue specimen PS-OCT data
An open-air time-domain PS-OCT instrument with a mode-locked Ti:Al2O3 laser source (λ0 = 830 nm, λFWHM = 55 nm) was employed to record PS-OCT data of specimens including birefringent film, ex-vivo rat tail tendon and in-vivo primate retinal nerve fiber layer (RNFL). PS-OCT data of specimens in the M polarization states were acquired by controlling the polarization state of light incident on tissue specimens using a liquid-crystal variable retarder positioned in the sample arm of the interferometer. Details of the PS-OCT system were described previously [9].
3.3 Basis transformation
PS-OCT data (horizontal and vertical interference fringe magnitudes and relative phase ) were converted to CPRs (Cvh (z)) as a function of depth (z) using Eq. (1). Generally, when the Cvh (z) is displayed in the (h, v) based complex plane, the trajectory of Cvh (z) is not uniformly rotated around the origin nor exponentially converging toward the origin because the real basis set ((x, y)) of CPRs in the specimen is not matched with the basis set ((h, v)) for displaying the CPRs. The mismatch of basis sets also complicates determination of δ(z) and ε(z) in a specimen using a Levenberg-Marquardt nonlinear fitting algorithm. A trajectory of the normalized Stokes vectors on the Poincaré sphere gives us geometrical knowledge about the determination of the basis set in a specimen. Trajectory of Stokes vectors with respect to δ(z) and ε(z) of the specimen is a spiral which rotates around and converges toward a point that represents the optic axis of the specimen [24,26]. Therefore, CPR of the optic axis and its orthogonal polarization state are used as a transformed basis set for the specimen. Since the optic axis in the (h, v) basis set is expressed as a complex number (Cvh _ oa = r exp(jθ)), the CPR representing optic axis in the (x, y) basis set is zero (Cyx _ oa = 0).
A basis transformation between (h, v) and (x, y) is given by Eq. (3). If the (x, y) basis set from the optic axis of specimen are determined, Cvh (z) can be transformed to the CPR (Cvh (z)) in an arbitrary basis set (x, y) by estimating the unknown complex variables of Eq. (3) (f11, f22, f12 and f21). Equation (3) was simplified by dividing f12 to both numerator and denominator (Cyx = (α Cvh + β) / (Cvh + γ)) to reduce number of variables (α = f22 / f12, β = f21 / f12 and γ = f11 / f12). Three CPRs (Cvh = 0, 1, and j) in the (h, v) basis set were selected to obtain transformed CPRs (Cyx = K1, K2 and K3) in the (x, y) basis. Because Stokes vectors of the Cvh = 0, 1, and j in (h, v) basis set were described as three orthogonal points (Q = 1, U = 1, and V = 1) on the Poincaré sphere, Stokes vectors of Cyx = K1, K2 and K3 were determined by Euler rotations between Stokes vectors representing Q = 1 (related to (h, v) basis set) and optic axis (related to (x, y) basis set) of the specimen [24]. The Cyx = K1, K2 and K3 in (x, y) basis set were computed from the Stokes vectors of Cyx. Finally the α, β and γ were obtained by solving three equations corresponding to three pairs ((0, K1), (1, K2), (j, K3)) of CPRs in both basis sets.
3.4 Levenberg-Marquardt nonlinear fitting algorithm
A Levenberg-Marquardt nonlinear fitting algorithm with single incident polarization state was developed for determining an unbiased estimate of double-pass phase retardation (2δ), double-pass amplitude attenuation (2ε), CPR of optic axis (Cvh _ oa), noise-free CPRs at the surface of specimen in (h, v) basis set (Cvh (0)) by minimizing a residual function (Ro). The residual function specifies goodness of fit between depth-resolved CPR (Cvh (z)) in (h, v) basis set measured by PS-OCT and noise-free CPR (Cyz (z)) in an arbitrary basis set (x, y).
| (5) |
where Tyx[Cvh] represents basis transformation of Cvh from (h, v) to (x, y) basis sets. Multiple incident polarization states of light were applied as input to the Levenberg-Marquardt nonlinear fitting algorithm for suppressing noise and increasing polarimetric signal to noise ratio (PSNR) in PS-OCT data [9].
A multi-state residual function (RM) was computed as an algebraic sum of single-state residual function (Ro) over the M incident polarization states.
| (6) |
More accurate 2δ, 2ε, Cvh _ oa , and noise-free CPRs at the surface of the specimen in (h, v) basis set (Cvh(m) (0)) at the M states were determined by minimizing a multi-state residual function (RM) [9].
4. Results
4.1 Mapping of trajectory by basis transformation
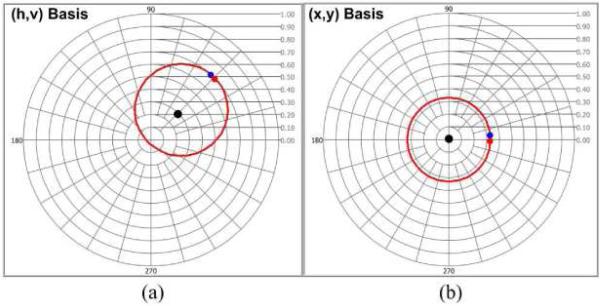
Trajectory of CPRs using single-state simulated noise-free PS-OCT data (Cvh (z)) is displayed in (h, v) basis complex plane (Fig. 3(a)). Similar to Fig. 2(a), the trajectory is generated by double-pass phase retardation (2δ(z) = 360°), but a CPR representing an optic axis (Cvh _ oa = 0.3exp(j45°)) is assumed. Although double-pass amplitude attenuation (2ε(z)) is usually considered in biological tissues, only δ(z) is considered to observe skewing of Cvh (z). The Cvh _ oa in the (h, v) basis complex plane is not the origin of the trajectory of Cvh (z), which indicates the Cvh (z) cannot rotate around and converge to the Cvh _ oa. Therefore, accurate estimates of δ(z) and ε(z) are not determined using an incorrect basis set. By the basis transformation procedure mentioned in Methods section, complex number variables are computed. The trajectory of Cvh (z) is transformed to a trajectory of CPRs (Cyx (z)) in (x, y) basis complex plane (Fig. 3(b)). A CPR representing optic axis (Cyx _ oa) in (x, y) basis complex is zero and the origin of trajectory of Cyx (z). The δ(z) and ε(z) can be determined by uniform rotation around the origin and exponential convergence toward the origin of Cyx (z) in the (x, y) basis set.
Fig. 3.
Trajectories of CPRs in the (h, v) and (x, y) basis complex planes. (a) Trajectory with double-pass phase retardation (2δ(z) = 360°) and an optic axis (cvh _ oa = 0.3exp(j45°), black dot) in the (h, v) basis complex plane (b) Trajectory in the (x, y) basis complex plane. The optic axis (cyx _ oa) in (x, y) basis complex plane is zero and at the origin of trajectory (Red and blue dots represent the first and last CPRs, respectively).
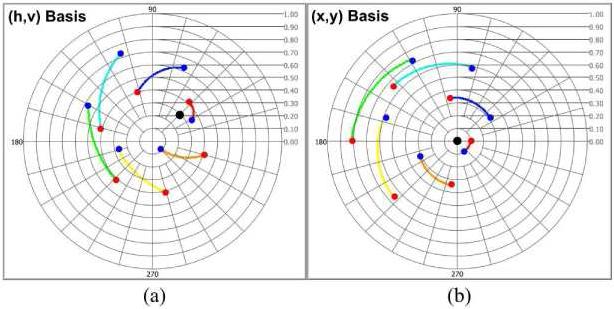
Multi-state trajectories of simulated noise-free PS-OCT data (Cvh(M =6) (z)) with six incident polarization states (M = 6) are plotted in (h, v) basis complex plane (Fig. 4(a)). Each trajectory is generated with 2δ(z) = 60°, 2ε(z) = 6.0° and optic axis (Cvh _ oa = 0.3exp(j45°)). Even though Cvh _ oa is a common optic axis in all trajectories, identical δ(z) and ε(z) in each state are not observed in (h, v) basis complex plane. Multi-state trajectories of PS-OCT data (Cyx(M =6) (z)) in the (x, y) basis complex plane are transformed from Cyx(M =6) (z) using basis transformation method. Identical δ(z) and ε(z) are observed corresponding to the optic axis (Cyx _ oa = 0) (Fig. 4(b)).
Fig. 4.
Multi-state trajectories of CPRs in the (h, v) and (x, y) basis complex planes (a) Trajectories with 2δ(z) = 60°, 2ε(z) = 6.0° and an optic axis (cvh _ oa = 0.3exp(j45°), black dot) in the (h, v) basis complex plane (b) Trajectories in the (x, y) basis complex plane. Identical δ(z) and ε(z) are visually observed (Red and blue dots represent the first and last CPRs, respectively).
4.2 Determination of polarization properties using simulated CPR
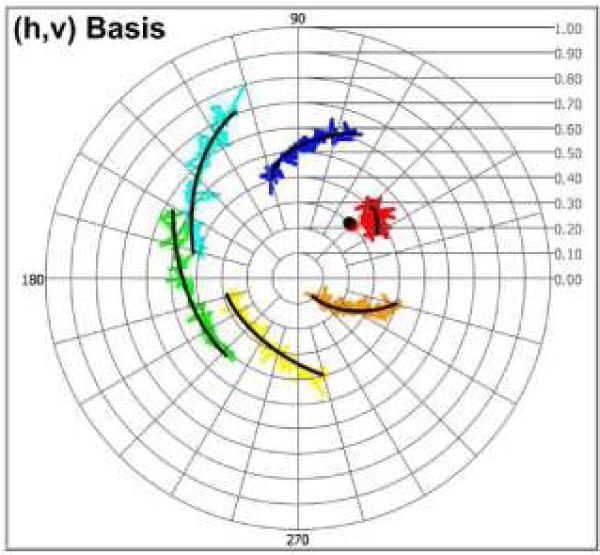
Multi-state trajectories (M = 6) of speckle-noise corrupted CPRs (Cvh(M =6) (z)) in (h, v) basis complex plane are applied to verify the ability of a multi-state Levenberg-Marquardt nonlinear algorithm to determine δ and ε. Polarization values (2δ(z) = 60°, 2ε(z) = 6.0° and Cvh _ oa = 0.3exp(j45°)) similar to those used in Fig. 4(a) are used to generate noise-free CPRs (Cvh(M =6) (z)). Speckle noise with standard deviation (σ = 3°) is added into each noise-free CPRs. Figure 5 shows the performance of the multi-state Levenberg-Marquardt nonlinear algorithm. The Cvh(M =6) (z) and fitted CPRs (Cvh(M =6) _ fit (z), black trajectories) are depicted. A fitted CPR (Cvh _ oa _ fit = 0.29exp(j45.4°), black dot) of optic axis, each CPR at the surface of specimen (Cvh(M =6) _ fit (0)) in the (h, v) basis complex plane, double-pass retardation (2δ_fit(z) = 60.3°), and double-pass attenuation (2ε_fit(z) = 6.02°) are computed by minimizing the multi-state residual function (RM) including estimation of basis transformation.
Fig. 5.
CPRs of simulated PS-OCT data in the (h, v) basis complex plane. The CPR of optic axis (black dot) and noise-free polarization arcs (black trajectories) were estimated from speckle-noise CPRs (colored trajectories)(Red dot behind the black dot represents true CPR of optic axis).
4.3 Determination of polarization properties using birefringent film
Phase retardation (δfilm(z)) of a turbid birefringent film (New Focus, #5842) are determined by the multi-state (M = 6) Levenberg-Marquardt nonlinear fitting algorithm using the CPRs. The thickness was 80μm (z = 80μm), and uniform retardation was observed without respect to position of the film. The mean and standard deviation of 36 uncorrelated measurements within a small square region (50 μm × 50 μm) are δfilm(z = 80μm) = 24.76° ± 0.62°. The mean birefringence (Δnfilm) was 7.14 × 10⁻⁴ or 30.95°/100μm. Birefringence measured using the CPRs is similar to that using Stokes vectors [9].
4.4 Determination of polarization properties using ex-vivo rodent tail tendon
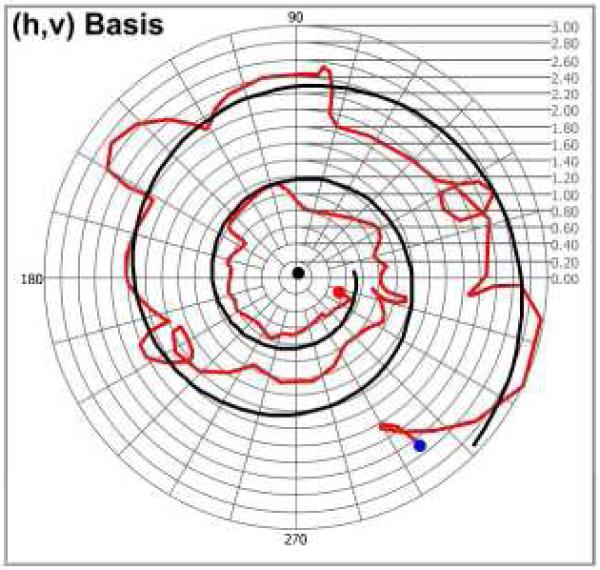
Ex-vivo rodent tail tendon is an excellent specimen to study both phase retardation (δtendon(z)) (or birefringence (Δntendon)) and relative amplitude attenuation (εtendon(z)) (or biattenuance (Δχtendon)) due to relatively large magnitude of these polarization properties. A trajectory of speckle noise-corrupted and fitted CPRs of the ex-vivo rodent tail tendon (thickness z = 165.0μm) are plotted in the (h, v) complex plane (Fig. (6)). A logarithmic spiral is visualized from the trajectory of CPRs. Unlike the trajectory converging to the optic axis in (x, y) basis complex plane (Fig. 2(b)), the trajectory diverges to infinity because the optic axis of the tendon specimen is closer to linear vertical polarization state (v basis state) than to the horizontal polarization state (h basis state). Convergence toward the optic axis in the trajectory can be observed when the CPRs of tendon specimen are displayed in (x, y) complex plane based on the optic axis rather than the (h, v) complex plane. Although only one trajectory related to one incident polarization state is displayed in Fig. 6 for clear graphical observation of the CPRs, six trajectories by six incident polarization states were applied to the Levenberg-Marquardt nonlinear fitting algorithm to determine accurate estimates of δtendon(z) and εtendon(z). Phase retardation and amplitude attenuation of ex-vivo rodent tail tendon were determined as δtendon(z = 165μm) = 382.35° and εtendon(z = 165μm) = 41.02°, respectively. Birefringence and biattenuance of the tendon specimen are also computed as Δntendon = 53.4 × 10⁻⁴ (or 231.72°/100μm) and Δχtendon = 5.72 × 10⁻⁴ (or 24.86°/100μm). These values are within the range of previously determined values using algorithms employing Stokes vectors on the Poincaré sphere [27].
Fig. 6.
Trajectory of CPRs by ex-vivo rodent tail tendon specimen in the (h, v) basis complex plane. The CPR of optic axis (black dot) and noise-free polarization arcs (black trajectory) are estimated from speckle-noise CPRs (red trajectory) (Red and blue dots represents the first and last CPRs, respectively).
4.5 Determination of polarization properties using in-vivo primate RNFL
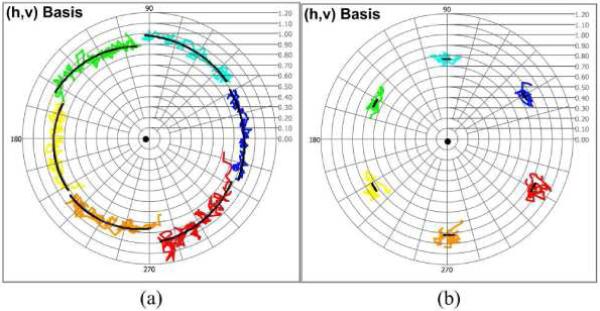
In-vivo primate RNFL was imaged to obtain the phase retardation (δRNFL(z)) in a thick region (1mm inferior to the center of the optic nerve head, thickness z = 150.0μm) and a thin region (1mm nasal to the center of the optic nerve head, thickness z = 53.5μm). Speckle noise-corrupted CPRs of the primate RNFL in the two regions were determined and displayed in the (h, v) complex plane (Fig. 7 (a-b)). The Levenberg-Marquardt nonlinear fitting algorithm with six incident polarization states was used to estimate the phase retardation, optic axis, and initial CPRs in each state by minimizing the multi-state residual function. Fitted trajectories (black trajectories) were obtained from estimated parameters, and overlapped on the noisy trajectories (color trajectories). The CPR of the optic axis (black dot) is almost coincident with the linear horizontal state (h basis). Phase retardations in the inferior and nasal regions were determined as δRNFL(z = 150.0μm) = 28.2° and δRNFL(z = 53.5μm) = 2.78°, respectively. Birefringence in the inferior (ΔnRNFL = 4.33 × 10⁻⁴ or 18.8°/100μm) and nasal region (ΔnRNFL = 1.20 × 10⁻⁴ or 5.20°/100μm) were easily determined from the fitted phase retardation values. These values closely match those determined using Stokes vectors on the Poincaré sphere [9,25].
Fig. 7.
Multi-states trajectories of CPRs by in-vivo primate RNFL in the (h, v) basis complex planes (a) Speckle noise-corrupted and fitted (black) trajectories in an inferior region (thickness z = 150.0μm). Phase retardation is δRNFL(z = 150.0μm) = 28.2° (b) Speckle noise-corrupted and fitted (black) trajectories in a nasal region (thickness z = 53.5μm). Phase retardation is δRNFL(z = 53.5μm) = 2.78° (Black dots represents the CPR of optic axis).
5. Discussion
We have demonstrated the use of CPR to analyze polarized light backscattered from a medium and measured with PS-OCT instrumentation. CPR provides a mathematically simple framework to easily visualize polarization states in the complex plane. Application of CPR to determine the polarimetric properties of a tissue specimen using a Levenberg-Marquardt nonlinear fitting algorithm was evaluated. Three main considerations such as complexity of the Levenberg-Marquardt nonlinear fitting algorithm, processing-time efficiency and accuracy of fitted polarization properties are investigated in greater detail by comparing Levenberg-Marquardt nonlinear fitting algorithms using CPR to Stokes vectors.
5.1 Complexity of nonlinear fitting algorithms using CPR and Stokes vectors
Stokes vectors represented by three real numbers are computed from horizontal and vertical interference fringe magnitudes and relative phase as a function of depth (z). This calculation requires eight real multiplications and two real additions. In contrast, CPR represented by a complex number requires only three multiplications for the same computation. When M multiple polarization states with N depth samples in each state are considered to determine polarization properties of a specimen, 8 × M × N real multiplications and 2 × M × N real additions for the Stokes vectors, and 3 × M × N real multiplications for CPR are required. Therefore, CPR is a more efficient representation than Stokes vectors for the conversion from the recorded PS-OCT data ( and ). In the multi-state Levenberg-Marquardt nonlinear fitting algorithms using polarization data, a trajectory of noise-free polarization data is generated using model parameters to minimize a residual function. Complexity of the residual function is highly correlated to generation of a noise-free trajectory. As the Stokes vectors are applied to the nonlinear fitting algorithms, the trajectory is three-dimensional and requires use of intricate geometrical expressions on the Poincaré sphere with approximately 22 × M × N real multiplications and 10 × M × N real additions [24]. Although the conversion of polarization basis set with about 16 × M × N real (or 4 × M × N complex) multiplications and 8 × M × N real (or 4 × M × N complex) additions slightly complicates generation of CPR trajectories, total number of operations with 20 × M × N real (or 5 × M × N complex) multiplications and 8 × M × N real (or 4 × M × N complex) additions are required. For example, as six polarization states (M = 6) and 1000 depth samples (N = 1000) are used, a reduction of 24,000 computational operations are realized using CPRs that can provide to a substantial reduction in processing time as discussed in the next section.
5.2 Processing time of two nonlinear fitting algorithms using CPR and Stokes vector
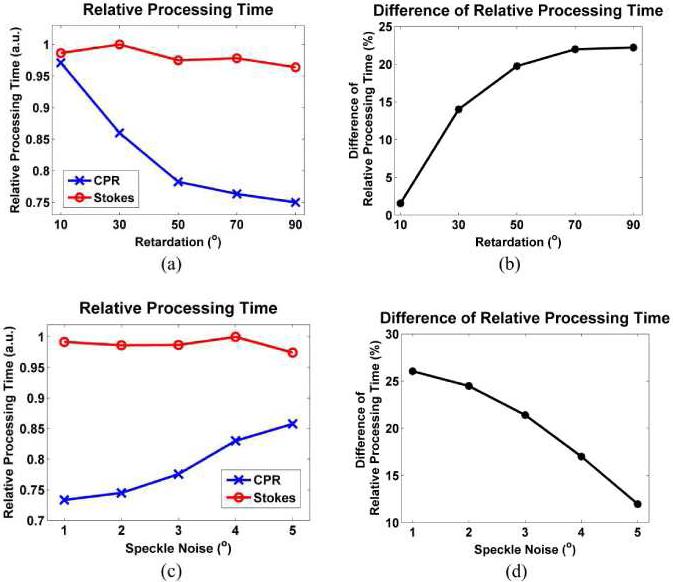
Processing times of the Levenberg-Marquardt nonlinear fitting algorithms were evaluated using simulated CPRs and Stokes vectors. 100 independent estimates using equivalent polarization conditions are measured and averaged. The nonlinear fitting algorithms used a Microsoft Windows XP operating system and hence measured processing times included Windows OS calls. Assuming that the Windows operation time is identical for both algorithms, relative efficiency can be investigated by computing the relative processing times between two algorithms. Figure 8(a) shows the relative processing time which is computed using the measured processing time divided by a maximum processing time in both algorithms. Phase retardation (δ(z) = 10°, 30°, 50°, 70° and 90°) and high speckle noise with standard deviation (σ = 5°) were applied to generate the speckle noise-corrupted CPRs and Stokes vectors. For the Stokes vector calculation, as the retardation increases a monotonic reduction of the relative processing time is observed. However, for CPR as the retardation increases a more rapid reduction of the relative processing time is observed. Difference of the relative processing time apparently increases, and an over 20% time difference is observed when the retardation is 90° (Fig. 8(b)). Therefore, the nonlinear algorithm using CPRs is faster by approximately 25% than the algorithm using Stokes vectors. Processing times with respect to different speckle noise (σ = 1°, 2°, 3°, 4° and 5°) at a phase retardation (δ(z) = 30°) are also studied and displayed in Fig. 8(c). The processing time in the Stokes vectors is less affected than that in CPRs by magnitude of speckle noise, and a 10% time difference is observed when the speckle nose is 5° (Fig. 8(d)). As speckle noise is reduced, difference between processing times increases. In other words, determination of polarimetric properties is increasingly faster as the speckle noise is reduced in the nonlinear fitting algorithm using CPRs compared to Stokes vectors.
Fig. 8.
Relative processing times between the two nonlinear fitting algorithms using CPRs and Stokes vectors. The relative processing times were measured by 100 independent estimate sets using simulated PS-OCT data (a) Relative processing times with different phase retardation (δ(z) = 10°, 30°, 50°, 70° and 90°) at a high speckle noise with standard deviation (σ = 5°) (b) Difference of relative processing times computed from (a) (c) Relative processing times with speckle noise (σ = 1°, 2°, 3°, 4° and 5°) at a fixed phase retardation (δ(z) = 30°) (d) Difference of relative processing times computed from (c).
5.3 Accuracy of fitted phase retardation in nonlinear fitting algorithms using CPR and Stokes vector
Accuracy of Levenberg-Marquardt nonlinear algorithms using CPRs and Stokes vectors was compared by a statistical analysis using simulated PS-OCT data. In order to know distribution characteristics of the unknown variables, we computed confidence intervals in both nonlinear algorithms. Based on the estimated polarization properties determined by the Levenberg-Marquardt nonlinear fitting algorithm, we calculated the estimate (s2) of the variance of the residual function with n - p degrees of freedom and n × p Jacobian matrix (J). The n refers to number of CPRs or Stokes vectors, and the p to number of variables. A p × p product matrix (P) given by the inverse of JT × J was used to acquire confidence interval of each estimated polarization property. The confidence interval (CI) was determined by [32].
| (7) |
where t is a value of the t-distribution, and Pii is the ith diagonal element of the matrix (P).
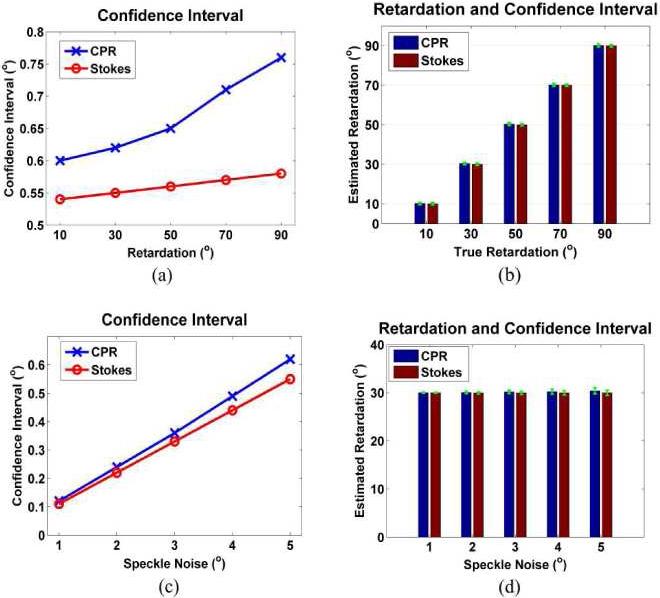
The confidence intervals of two algorithms were tested by varying depth-resolved phase retardation and speckle noise using simulated PS-OCT data. 100 independent estimate sets were obtained and averaged under the same condition. Figure 9(a) shows 95% confidence intervals computed by changing phase retardation (δ(z) = 10°, 30°, 50°, 70° and 90°) at a fixed optic axis (cvh _ oa = 0.3exp(j45°)) and relatively large speckle noise with standard deviation (σ = 5°). Confidence intervals increase when phase retardation increases in both algorithms. The confidence interval in CPR is slightly larger than that for Stokes vectors, which suggests that the algorithm using Stokes vector is statistically more accurate than that using CPRs. But the difference in accuracy between the two algorithms may be negligible because the confidence intervals represented by green error bars are too small compared to estimated phase retardation in both algorithms (Fig. 9(b)). Similarly, 95% confidence intervals were observed by changing magnitude of speckle noise (σ = 1°, 2°, 3°, 4° and 5°) at a fixed phase retardation (δ(z) = 30°) (Fig. 9(c)). The confidence intervals linearly increase with increased speckle noise, and difference between the confidence intervals of the two algorithms increases as the speckle noise increases. Although the algorithm using Stokes vectors is slightly more accurate than that using CPRs, the confidence intervals are substantially smaller than the fitted phase retardation (Fig. 9(d)).
Fig. 9.
Estimated retardation and 95% confidence intervals by simulated PS-OCT data in two Levenberg-Marquardt nonlinear fitting algorithms using CPRs and Stokes vectors (a) Confidence intervals with different phase retardation (δ(z) = 10°, 30°, 50°, 70° and 90°) at a fixed optic axis and high speckle noise with standard deviation (σ = 5°) (b) Estimated retardation and 95% confidence intervals (green error bar) from (a) (c) Confidence intervals with speckle noise (σ = 1°, 2°, 3°, 4° and 5°) at a true phase retardation (δ(z) = 30°) (d) Estimated retardation and 95% confidence intervals (green error bar) from (c).
6. Conclusion
CPR is a mathematical expression to represent polarization state of light as a single complex number. Complex number computation of CPRs and two-dimensional visualization in a complex plane are competitive advantages compared to methods to analyze PS-OCT data using Jones, Mueller matrices and Stokes vectors. A Levenberg-Marquardt nonlinear fitting algorithm using CPR was developed to determine polarization properties including phase retardation (or birefringence), relative amplitude attenuation (or biattenuance) and optic axis orientation of anisotropic tissues from PS-OCT data. After the algorithm was tested by simulated PS-OCT data, polarization properties of several anisotropic specimens including birefringent film, ex-vivo rat tail tendon and in-vivo primate RNFL are determined. The Levenberg-Marquardt nonlinear fitting algorithm using CPR has less complexity, faster processing time than that using Stokes vectors [9,25]. Although uncertainty of estimated polarization properties are slightly greater when using CPR, the benefits provides by easy visualization, reduced complexity and fast processing time are important practical advantages using CPR.
Acknowledgements
The authors gratefully acknowledge the Texas Higher Education Coordinating Board Advanced Technology Program and the National Institutes of Health for financial support of this research (R01 EY 016462-04).
References and links
- 1.Hee MR, Huang D, Swanson EA, Fujimoto JG. Polarization-sensitive low-coherence reflectometer for birefringence characterization and ranging. J. Opt. Soc. Am. B. 1992;9(6):903–908. [Google Scholar]
- 2.de Boer JF, Milner TE. Review of polarization sensitive optical coherence tomography and Stokes vector determination. J. Biomed. Opt. 2002;7(3):359–371. doi: 10.1117/1.1483879. [DOI] [PubMed] [Google Scholar]
- 3.Hitzenberger CK, Götzinger E, Pircher M. Birefringence properties of the human cornea measured with polarization sensitive optical coherence tomography. Bull. Soc. Belge Ophtalmol. 2006;302(302):153–168. [PubMed] [Google Scholar]
- 4.Cense B, Chen TC, Park BH, Pierce MC, de Boer JF. Thickness and birefringence of healthy retinal nerve fiber layer tissue measured with polarization-sensitive optical coherence tomography. Invest. Ophthalmol. Vis. Sci. 2004;45(8):2606–2612. doi: 10.1167/iovs.03-1160. [DOI] [PubMed] [Google Scholar]
- 5.Pierce MC, Sheridan RL, Hyle Park B, Cense B, de Boer JF. Collagen denaturation can be quantified in burned human skin using polarization-sensitive optical coherence tomography. Burns. 2004;30(6):511–517. doi: 10.1016/j.burns.2004.02.004. [DOI] [PubMed] [Google Scholar]
- 6.Patel NA, Zoeller J, Stamper DL, Fujimoto JG, Brezinski ME. Monitoring osteoarthritis in the rat model using optical coherence tomography. IEEE Trans. Med. Imaging. 2005;24(2):155–159. doi: 10.1109/tmi.2004.839360. [DOI] [PubMed] [Google Scholar]
- 7.Giattina SD, Courtney BK, Herz PR, Harman M, Shortkroff S, Stamper DL, Liu B, Fujimoto JG, Brezinski ME. Assessment of coronary plaque collagen with polarization sensitive optical coherence tomography (PS-OCT) Int. J. Cardiol. 2006;107(3):400–409. doi: 10.1016/j.ijcard.2005.11.036. [DOI] [PubMed] [Google Scholar]
- 8.Jones RS, Darling CL, Featherstone JDB, Fried D. Remineralization of in vitro dental caries assessed with polarization-sensitive optical coherence tomography. J. Biomed. Opt. 2006;11(1):014016. doi: 10.1117/1.2161192. [DOI] [PubMed] [Google Scholar]
- 9.Kemp NJ, Park J, Zaatari HN, Rylander HG, Milner TE. High-sensitivity determination of birefringence in turbid media with enhanced polarization-sensitive optical coherence tomography. J. Opt. Soc. Am. A. 2005;22(3):552–560. doi: 10.1364/josaa.22.000552. [DOI] [PubMed] [Google Scholar]
- 10.Götzinger E, Pircher M, Hitzenberger CK. High speed spectral domain polarization sensitive optical coherence tomography of the human retina. Opt. Express. 2005;13(25):10217–10229. doi: 10.1364/opex.13.010217. http://www.opticsinfobase.org/abstract.cfm?URI=oe-13-25-10217. [DOI] [PMC free article] [PubMed]
- 11.Hitzenberger CK, Goetzinger E, Sticker M, Pircher M, Fercher AF. Measurement and imaging of birefringence and optic axis orientation by phase resolved polarization sensitive optical coherence tomography. Opt. Express. 2001;9(13):780–790. doi: 10.1364/oe.9.000780. http://www.opticsinfobase.org/abstract.cfm?URI=oe-9-13-780. [DOI] [PubMed]
- 12.Jiao SL, Wang LV. Two-dimensional depth-resolved Mueller matrix of biological tissue measured with double-beam polarization-sensitive optical coherence tomography. Opt. Lett. 2002;27(2):101–103. doi: 10.1364/ol.27.000101. [DOI] [PubMed] [Google Scholar]
- 13.Jiao SL, Todorović M, Stoica G, Wang LV. Fiber-based polarization-sensitive Mueller matrix optical coherence tomography with continuous source polarization modulation. Appl. Opt. 2005;44(26):5463–5467. doi: 10.1364/ao.44.005463. [DOI] [PubMed] [Google Scholar]
- 14.Yasuno Y, Makita S, Sutoh Y, Itoh M, Yatagai T. Birefringence imaging of human skin by polarization-sensitive spectral interferometric optical coherence tomography. Opt. Lett. 2002;27(20):1803–1805. doi: 10.1364/ol.27.001803. [DOI] [PubMed] [Google Scholar]
- 15.Park BH, Pierce MC, Cense B, de Boer JF. Jones matrix analysis for a polarization-sensitive optical coherence tomography system using fiber-optic components. Opt. Lett. 2004;29(21):2512–2514. doi: 10.1364/ol.29.002512. [DOI] [PMC free article] [PubMed] [Google Scholar]
- 16.Yasuno Y, Makita S, Endo T, Itoh M, Yatagai T, Takahashi M, Katada C, Mutoh M. Polarization-sensitive complex Fourier domain optical coherence tomography for Jones matrix imaging of biological samples. Appl. Phys. Lett. 2004;85(15):3023–3025. [Google Scholar]
- 17.Makita S, Yasuno Y, Endo T, Itoh M, Yatagai T. Polarization contrast imaging of biological tissues by polarization-sensitive Fourier-domain optical coherence tomography. Appl. Opt. 2006;45(6):1142–1147. doi: 10.1364/ao.45.001142. [DOI] [PubMed] [Google Scholar]
- 18.Yamanari M, Makita S, Madjarova VD, Yatagai T, Yasuno Y. Fiber-based polarization-sensitive Fourier domain optical coherence tomography using B-scan-oriented polarization modulation method. Opt. Express. 2006;14(14):6502–6515. doi: 10.1364/oe.14.006502. http://www.opticsinfobase.org/oe/abstract.cfm?URI=oe-14-14-6502. [DOI] [PubMed]
- 19.Yamanari M, Makita S, Yasuno Y. Polarization-sensitive swept-source optical coherence tomography with continuous source polarization modulation. Opt. Express. 2008;16(8):5892–5906. doi: 10.1364/oe.16.005892. http://www.opticsinfobase.org/oe/abstract.cfm?URI=oe-16-8-5892. [DOI] [PubMed]
- 20.de Boer JF, Milner TE, Nelson JS. Determination of the depth-resolved Stokes parameters of light backscattered from turbid media by use of polarization-sensitive optical coherence tomography. Opt. Lett. 1999;24(5):300–302. doi: 10.1364/ol.24.000300. [DOI] [PubMed] [Google Scholar]
- 21.Ducros MG, Marsack JD, Rylander HG, III, Thomsen SL, Milner TE. Primate retina imaging with polarization-sensitive optical coherence tomography. J. Opt. Soc. Am. A. 2001;18(12):2945–2956. doi: 10.1364/josaa.18.002945. [DOI] [PubMed] [Google Scholar]
- 22.Park BH, Saxer C, Srinivas SM, Nelson JS, de Boer JF. In vivo burn depth determination by high-speed fiber-based polarization sensitive optical coherence tomography. J. Biomed. Opt. 2001;6(4):474–479. doi: 10.1117/1.1413208. [DOI] [PubMed] [Google Scholar]
- 23.Park BH, Pierce MC, Cense B, de Boer JF. Optic axis determination accuracy for fiber-based polarization-sensitive optical coherence tomography. Opt. Lett. 2005;30(19):2587–2589. doi: 10.1364/ol.30.002587. [DOI] [PubMed] [Google Scholar]
- 24.Park J, Kemp NJ, Zaatari HN, Rylander HG, III, Milner TE. Differential geometry of normalized Stokes vector trajectories in anisotropic media. J. Opt. Soc. Am. A. 2006;23(3):679–690. doi: 10.1364/josaa.23.000679. [DOI] [PubMed] [Google Scholar]
- 25.Rylander HG, 3rd, Kemp NJ, Park JS, Zaatari HN, Milner TE. Birefringence of the primate retinal nerve fiber layer. Exp. Eye Res. 2005;81(1):81–89. doi: 10.1016/j.exer.2005.01.009. [DOI] [PubMed] [Google Scholar]
- 26.Kemp NJ, Zaatari HN, Park J, Rylander HG, III, Milner TE. Depth-resolved optic axis orientation in multiple layered anisotropic tissues measured with enhanced polarization-sensitive optical coherence tomography (EPS-OCT) Opt. Express. 2005;13(12):4507–4518. doi: 10.1364/opex.13.004507. http://www.opticsinfobase.org/abstract.cfm?URI=oe-13-12-4507. [DOI] [PubMed]
- 27.Kemp NJ, Zaatari HN, Park J, Rylander HG, III, Milner TE. Form-biattenuance in fibrous tissues measured with polarization-sensitive optical coherence tomography (PS-OCT) Opt. Express. 2005;13(12):4611–4628. doi: 10.1364/opex.13.004611. http://www.opticsinfobase.org/abstract.cfm?URI=oe-13-12-4611. [DOI] [PubMed]
- 28.Lathi BP. Linear systems and signals. Oxford University Press; New York: 2005. [Google Scholar]
- 29.Paliouras JD. Complex variables for scientists and engineers. Macmillan; New York: 1975. [Google Scholar]
- 30.Azzam RMA, Bashara NM. Ellipsometry and polarized light. North-Holland Pub. Co., Amsterdam; New York: 1977. [Google Scholar]
- 31.Brosseau C. Fundamentals of polarized light: a statistical optics approach. Wiley; New York: 1998. [Google Scholar]
- 32.Gallant AR. Nonlinear-Regression. Am. Stat. 1975;29(2):73–81. [Google Scholar]


