

Abstract
Group II metabotropic glutamate receptors (mGluR2 and mGluR3) are implicated in schizophrenia. We characterized mGluR2, 3 in the human prefrontal cortex (PFC) and mesencephalon then compared cases with schizophrenia to matched controls. In the human brain, both receptors were expressed in the PFC and, unlike the rodent, in dopaminergic cell groups. In schizophrenia, we found significantly higher levels of mGluR2 mRNA in the PFC white matter. The expression of mGluR2, 3 in dopaminergic cells provides a mechanism for glutamate to modulate dopamine release in the human brain and this species-specific difference is critical to understanding rodent models in schizophrenia.
Keywords: Mesencephalon, Prefrontal Cortex, Postmortem, Human, In Situ Hybridization, Dopamine
Introduction
Eight metabotropic glutamate receptors have been cloned from the mammalian brain. They are divided into three groups based on sequence homology, coupling to second messengers and pharmacological profile. Group II metabotropic glutamate receptors, consisting of mGluR2 and 3, have been implicated in several neuropsychiatric disorders. Both animal and human data have implicated these receptors in the pathophysiology of schizophrenia. For example, the administration of PCP to rats, a model of schizophrenia, increased glutamate efflux in the prefrontal cortex and nucleus accumbens, increased locomotor activity and stereotypies and impaired performance on a working memory paradigm (Moghaddam and Adams, 1998). Pretreatment of these animals with a highly selective group II metabotropic glutamate receptor agonist, LY 354740, abolished the PCP-induced glutamate efflux, significantly reduced stereotypies and improved performance on the working memory paradigm. In a later study, another potent mGluR2/3 receptor agonist, LY 379268, was shown to selectively attenuate PCP-evoked increases in motor activity in rats in a manner similar to the effect of the atypical antipsychotic, clozapine (Cartmell et al, 2000). In normal humans, ketamine, a glutamatergic agonist has been shown to induce cognitive deficits similar to those found in schizophrenia. Pretreatment with LY354740 reduced the cognitive effects of ketamine in a dose-dependent manner (Krystal et al, 2005). Increased mGluR2/3 protein in the PFC in schizophrenia has been reported (Gupta et al, 2005) although not in all studies (Crook et al, 2002). An association between mGluR3 and schizophrenia has been reported in some (Fujii et al, 2003; Egan et al, 2004; Chen et al, 2005) but not all (Marti et al, 2002; Norton et al, 2005) human genetic association studies. One study reported an association between a mGluR3 polymorphism and treatment response (Bishop et al, 2005). Egan et al (2004) reported that the A allele of SNP rs6465084 of mGluR3 was associated with poorer prefrontal function shown by reduced verbal fluency and lower N-acetylaspartate levels. The latter finding has been replicated (Marenco et al, 2006). In addition, this same SNP is associated with altered expression levels of the glial glutamate transporter, EAAT2 (Egan et al, 2004). Taken together, these data suggest a role of group II mGluRs in the pathophysiology of schizophrenia. More recently, an mGluR2/3 agonist, LY 404039, has been reported to have antipsychotic activity in patients with schizophrenia (Patil et al, 2007). The expression of these receptors in the human brain has not been characterized.
In this study, we sought to: a) characterize the normal distribution of mGluR2 and 3 in the human PFC and ventral mesencephalon, two brain regions important to the pathophysiology of schizophrenia and b) compare these regions in brains of subjects with schizophrenia to matched normal controls.
Materials and Methods
Human postmortem tissue specimens
Characteristics of subjects
Human brain specimens were obtained, during the course of routine autopsy, through the Office of the Medical Examiners of the District of Columbia with the informed consent of the next of kin. Clinical records were reviewed in each case by two board-certified psychiatrists (MA and JEK) and collateral information was obtained, whenever possible, from telephone interviews with surviving relatives of the deceased. Blood and/or brain toxicology screens were conducted in each case. We excluded subjects with a known history of neurological disorders, and an experienced neuropathologist examined each case, both macroscopically and microscopically. Bielschowsky’s silver stain was used to rule out neuritic pathology. Cases with significant neuropathological abnormalities such as strokes, Alzheimer’s disease and others were excluded. The collection of human brain specimens was approved by the Institutional Review Board of the NIMH Intramural Research Program (protocol 90-M-0142). Antipsychotic medications administered to each case were compiled from the available medical records. Dosages of each drug were converted to chlorpromazine (CPZ) equivalents. A mean drug dosage was considered to be the average daily dose. Lifetime CPZ equivalents was calculated by multiplying the average daily dose by duration of illness.
Thirty-seven human subjects between the ages of 18 and 80 were included in this study. There were 27 male and 10 female subjects. Fourteen had a history of schizophrenia; four of them had comorbid substance dependence. For each experiment, a cohort of subjects was chosen from this group of 37 subjects; cases in cohort 1 and 2 were included in studies for the PFC and ventral mesencephalon, respectively (table 1). Groups in each cohort were matched to age, pH and post mortem interval.
Table 1.
Demographic characteristics of subjects
| CONTROLS | ||||||
|---|---|---|---|---|---|---|
| CASE | COHORT | SEX | RACE | AGE | PMI | pH |
| (yrs) | (hours) | |||||
| C1 | 1 | M | C | 26 | 14.5 | 6.08 |
| C2 | 2 | M | C | 50 | 49 | 6.68 |
| C3 | 2 | M | AA | 43 | 24.3 | 6.44 |
| C4 | 2 | M | AA | 18 | 56.5 | 6.3 |
| C5 | 2 | M | AA | 40 | 31.5 | 6.41 |
| C6 | 2 | M | AA | 52 | 10 | 6.87 |
| C7 | 1 | M | AA | 35 | 79.5 | 5.88 |
| C8 | 2 | M | AA | 42 | 40 | 6.63 |
| C9 | 1 | F | C | 66 | 37.5 | 6.37 |
| C10 | 1 | M | AA | 31 | 15.5 | 6.77 |
| C11 | 1 | M | AA | 24 | 12.5 | 6.59 |
| C12 | 2 | M | AA | 44 | 32.5 | 6.14 |
| C13 | 1,2 | M | AA | 56 | 33.5 | 6.09 |
| C14 | 1 | M | C | 63 | 19.5 | 6.43 |
| C15 | 1 | M | C | 34 | 26.5 | 6.38 |
| C16 | 1,2 | F | AA | 57 | 19 | 6.43 |
| C17 | 2 | M | AA | 48 | 37 | 6.58 |
| C18 | 1 | F | AA | 59 | 37 | 6.57 |
| C19 | 1 | F | AA | 67 | 34 | 6.69 |
| C20 | 2 | M | AA | 51 | 46.5 | 6.39 |
| C21 | 2 | M | AA | 68 | 60 | 6.61 |
| C22 | 2 | M | AA | 49 | 51 | 6.88 |
| C23 | 2 | F | AA | 41 | 32 | 5.87 |
| SCHIZOPHRENIA | |||||||||
|---|---|---|---|---|---|---|---|---|---|
| CASE | COHORT | SEX | RACE | AGE | PMI | pH | Last dose | daily dose | Lifetime dose |
| (yrs) | (hours) | (CPZ equivalents) | |||||||
| S1 | 1,2 | M | AA | 75 | 42.5 | 6.29 | 400 | 400 | 5300000 |
| S2 | 1 | M | AA | 23 | 43 | 6.48 | 400 | 480 | 3300000 |
| S3 | 1,2 | F | AA | 60 | 35 | 6.38 | 700000 | ||
| S4 | 1,2 | M | AA | 30 | 72.5 | 6.32 | 1900 | 500 | 2200000 |
| S5 | 1 | M | AA | 35 | 79.5 | 6.7 | |||
| S6 | 1 | M | C | 80 | 13.5 | 6.05 | 30 | 50 | 700000 |
| S7 | 1,2 | F | H | 72 | 52.5 | 6.15 | |||
| S8 | 2 | F | C | 81 | 15 | 6.78 | 150 | 2100000 | |
| S9 | 1 | F | AA | 61 | 20 | 6.74 | 200 | 200 | 2000000 |
| S10 | 1,2 | M | AA | 38 | 61 | 6.5 | 800 | 60 | 11800000 |
| S11 | 1,2 | M | AA | 44 | 34 | 6.28 | 300 | 350 | 2700000 |
| S12 | 1 | M | C | 20 | 24.5 | 6.81 | |||
| S13 | 1,2 | F | AA | 41 | 51 | 6.08 | 2400 | 1135 | 10400000 |
| S14 | 1,2 | M | AA | 41 | 32 | 6.63 | 50 | 400 | 2.5 |
Cohort 1 = cases used for mGluR2 and 3 studies in PFC; cohort 2 = studies used for mGluR2 and 3 studies in ventral mesencephalon, M = male, F= female, AA = African American, C = Caucasian, PMI = post mortem interval, CPZ equiv = chlorpromazine equivalents
Tissue Preparation and regional identification
In each case, cerebral hemispheres were cut coronally into 1-1.5 cm blocks and the midbrain was cut into 1-1.5 cm blocks in a plane perpendicular to its long axis. Tissue blocks were frozen immediately in a mixture of dry ice and isopentane (1:1, v:v), cryostat sectioned at 14 μm, thaw-mounted onto gelatin-coated subbed microscope slides, then dried and stored at -80°C. Every 50th section was stained for Nissl substance with thionin. Brodmann’s area 46 of the PFC was identified through Nissl staining according to defined cytoarchitectural criteria (Rajkowska et al, 1995). For midbrain sections, anatomical levels corresponding to Figure 57 in the “Atlas of the Human Brainstem” by Paxinos and Huang (1995) were identified in each case using Nissl-stained sections and tyrosine hydroxylase (TH) immunocytochemistry. Regional boundaries of the dopaminergic (DA) cell groups within the midbrain were determined according to (McRitchie et al 1995). Five cell groups were identified; the substantia nigra pars lateralis (SNL), the dorsal and ventral tiers of the pars compacta (SND and SNV respectively), the paranigral nucleus (PN) and the ventral tegmental area (VTA). These nuclei were chosen because they could be easily and reliably identified at this anatomical level of the human mesencephalon.
Riboprobe Design
Specific PCR primers were designed for unique regions of human mGluR2 and mGluR3 cDNA sequences. The primers used for mGluR2 were TACTGGGCAGAAGGCTTCACTC (sense, bp 1419-40) and GGATGGCTTGGCAATGAAGATG (antisense, bp 1886-65) designed to amplify a 318 bp fragment while the primers for mGluR 3, GACACTTTTGGAGATGCAATGGG (sense, bp 1621-43) and TGATGGCTTCGCAATGAAGAAC (antisense, bp 2163-42) were designed to amplify a 542 bp fragment. RT-PCR was performed with human whole brain poly (A)+ RNA. PCR products were run on a 1% agarose gel to verify their size. The mGluR2 and mGluR3 PCR products were then separately cloned into a bacterial vector, the pT-Advantage vector (Clontech), to generate the riboprobe. E. Coli bacteria were then transformed with this vector containing either mGluR2 or 3 PCR. Colonies of E. Coli were grown and plasmid DNA was isolated. This isolated DNA underwent restriction analysis and complete ds-DNA sequencing to verify that the correct PCR fragment had been cloned. The mGluR2 and mGluR3 plasmid inserts were then subcloned into the pSport 1 vector (Life Technologies) in order to generate both sense and antisense strands. The mGluR2 subclones were again verified by ds-DNA sequencing. Plasmid insert orientation was determined by restriction mapping. The mGluR2 and mGluR3 probes were designed to detect full length transcripts of each gene. The mGluR3 probe detects full length mGluR3 as well as the alternate transcript missing exon 4 (Sartorius et al, 2006).
In situ hybridization
Two 14 μM sections per region per case were used in each in situ hybridization experiment. Tissue sections were processed and hybridized with 35S-UTP labeled riboprobes overnight at 55° C as previously described (Whitfield et al, 1990). In order to control for non-specific hybridization, some sections from the PFC and ventral mesencephalon were hybridized with radiolabeled sense strand for each experiment and under the same conditions used for the antisense strand. Following the in situ procedure, slides were apposed to Kodak autoradiographic film (Biomax) for 3 - 4 weeks along with 14C standards (American Radiolabeled Chemicals, Inc., St. Louis, MO). Once the autoradiographic films were developed, all the slides were dipped in photographic emulsion (Kodak Emulsion NTB-2), dried and subsequently developed in D-19 developer (Kodak) after 12 – 24 weeks.
Quantitative Analysis
Autoradiographic films were scanned using a Hewlett-Packard Scanjet Plus flatbed at 300 dpi resolution. Calibrated densitometric image analysis of autoradiograms was conducted, blind to diagnosis using NIH Image software version v.1.61. (Rasband, NIH). Within area 46, we sampled the grey matter (GM) and white matter (WM). For gray matter, sample areas traversed the entire cortex; for the white matter, samples were taken from the subcortical region immediately below the sampled GM area. In addition, all six cortical layers within a radial traverse in the gray matter were sampled. We drew an elliptical area within each lamina, using the adjacent Nissl-stained section as a guide, and measured the mean optical density within each ellipse. The mean optical density of two sections from each brain was used for statistical analysis. Background was calculated from adjacent regions of the developed film that was not exposed to radioactivity. In the ventral mesencephalon, we sampled five DA cell groups on each side of each section (SNL, SND, SNV, PN and the VTA) as described before (Akil et al, 2003). An area of 1.76 mm2 in each cell group was sampled selecting the region of highest density within each cell group. The results from both sections and from the right and left sides were averaged in each subject. Mean values from each cell group and a total (sum) of means from all five cell groups were used for statistical analyses.
Statistical Analysis
Correlations of mRNA levels with potential confounding demographic variables (age, pH, post mortem interval (PMI), pH and RNA integrity number (RIN) were performed using Pearson Product-Moment correlation coefficients. Diagnostic group differences in demographic variables were tested with unpaired t-tests. Two separate univariate ANOVAs were performed with diagnosis as the between-groups variable, and anatomic region (PFC GM layers II-VI; DA cell groups) as the within-group independent variable and mGluR2 or mGluR3 mRNA levels as the dependent variable. Univariate ANOVA was used to examine differences between mGluR2 and mGluR3 mRNA expression levels in the PFC WM. Correlations of mRNA levels with neuroleptic medication (lifetime neuroleptic exposure, daily dose and final neuroleptic dose) were investigated in the schizophrenic cohort. Quantitative analysis of mGluR3 mRNA in the ventral mesencephalon was not performed due to the minimal levels of gene expression in DA cell groups. Effect sizes were calculated using Cohen’s d (Cohen, J, 1988). Additionally, exploratory unpaired t-tests analyses were conducted comparing mGluR2 and 3 mRNA levels in schizophrenia vs control for each PFC layer and each DA cell group.
Results
Prefrontal cortex
mGluR2 mRNA is expressed in the gray (GM) and white matter (WM) with higher levels found in the GM. mGluR2 mRNA was expressed in a lamina-specific pattern with highest levels in layer IV (Figure 1A). mGluR2 mRNA was also present, albeit less prominently, in layers II, III, V and VI. At the cellular level, clusters of silver grain corresponding to the labeled hybrids were noted over pyramidal (Fig 1B, C arrow) and non-pyramidal neuronal profiles. No clusters of silver grains were visualized over glial profiles.
Figure 1.
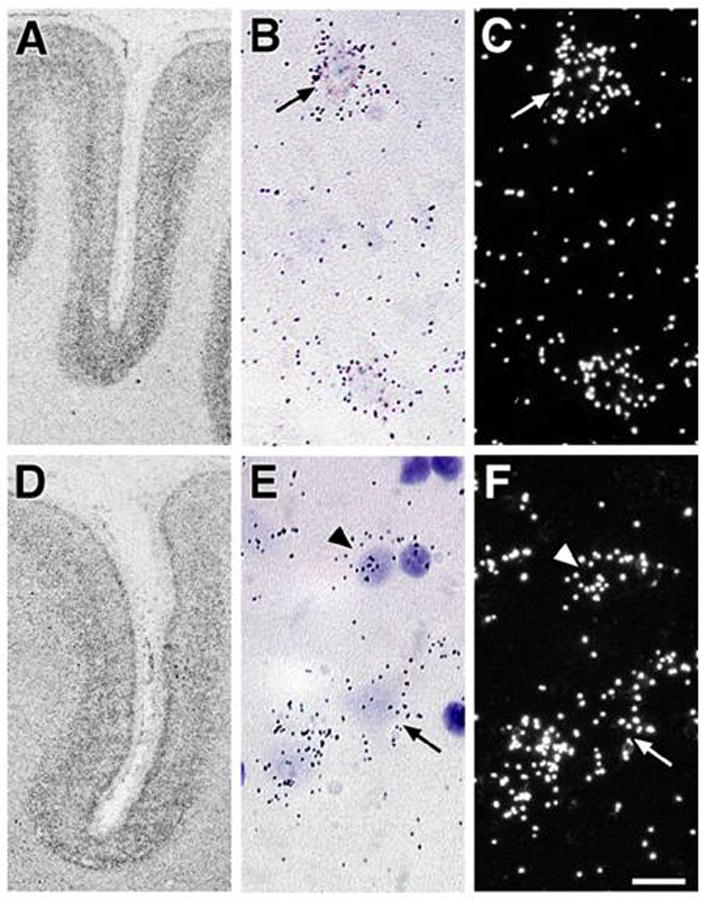
Autoradiographs (A, D), bright field (B,E) and dark field (C,F) photomicrographs of tissue sections from area 46 following in situ hybridization with cDNA probes for mGluR2 (A, B,C) and mGluR3 (D,E,F) mRNA. Note that silver grains are clusters over cell bodies with pyramidal (arrows) and glial (arrowheads) profiles. Scale bar = 20 microns.
Similarly, mGluR3 mRNA was also expressed throughout the cortex in area 46 of the normal human brain with higher levels in the GM. mGluR3 mRNA was expressed in a lamina-specific pattern (Figure 1D) with the highest levels in layers II, IV, and deep V/superficial VI. At the cellular level, silver grains were clustered over pyramidal (Fig. 1E, F arrow) and non-pyramidal neuronal profiles. In contrast to mGluR2, silver grain clusters for mGluR3 were also detected over glial profiles (Fig. 1E, F arrowhead).
Ventral Mesencephalon
mGluR2 was expressed in all cell groups examined in the ventral mesencephalon (Fig. 2A). At the cellular level, silver grains were clustered over most but not all melanin-containing DA neurons (Fig. 2F, G, and H). Some silver grains clustered over some melanin-negative neurons in the SN pars reticulata (SNpr; Fig. 2 I, J). There were no silver grain clusters noted over glial profiles.
Figure 2.
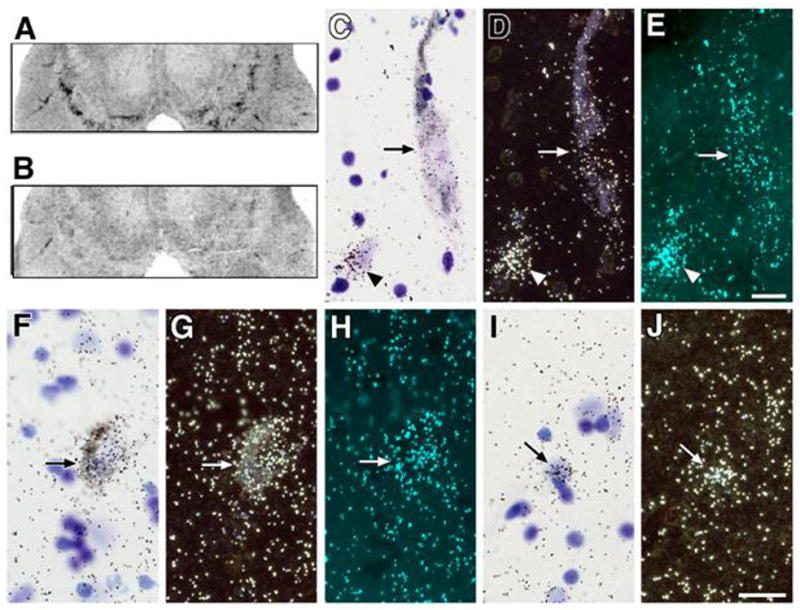
Autoradiographs (A, B), bright field (C,F,I), dark field (D,G,J) and polarized epiflouresence (for visualization of silver grains without interference by melanin; E,H) photomicrographs of tissue sections ventral mesencephalon following in situ hybridization with cDNA probes for mGluR2 (A,F-J) and mGluR3 (B, C-E) mRNA. Note that silver grains are clusters over cell bodies of melanized neurons (arrows C-H), non-melanized neurons (arrowheads C-E) and glia (arrows I,J). Scale bar C-E and F-J = 20 microns.
We detected only minimal expression of mGluR3 in the human ventral mesencephalon (Fig. 2B). At the cellular level, occasional silver grain clusters were noted over melanized dopaminergic neurons (Fig. 2C, D, E arrow), non-melanized neurons in the SNpr (Fig. 2 C, D, E arrowhead) and glial profiles.
Group comparisons
Variables including gender, mean age at death, postmortem interval (PMI), and pH of tissue did not differ between the two diagnostic groups (table 1). Furthermore, there were no correlations between pH, PMI or gender with mGluR2 or 3 mRNA expression levels in any of the PFC layers, WM or DA cell groups (regions analyzed for primary analysis; all r between -0.11 and 0.22, all p >0.05). There was a significant correlation between PMI and mGluR2 mRNA expression in the VTA (r = 0.62, p = 0.13). Antipsychotic medication status was assessed in terms of lifetime dose, last known dose and average daily dose in chlorpromazine equivalents. There was a significant inverse correlation between mGluR2 and lifetime dose of antipsychotic in the GM (r = - 0.64, p = 0.048) but not the WM (r = - 0.44, p = 0.136). No significant correlations were observed with mGluR3.
Analysis of densitometric measurements for mGluR2 in the PFC WM revealed a statistically significant difference between diagnostic groups (F= 5.2, df = 1, 21, p = 0.03; fig 3a). Comparisons of mRNA expression levels in PFC GM laminae between groups did not reveal any difference for mGluR2 (F= 0.84, df= 4, 84, P = 0.50; fig 3a) or mGluR3 (F=1.63, df =4, 80, p =0.17; fig 3b, table 2). In the ventral mesencephalon, mGluR2 mRNA levels of the 5 DA cell groups were not significantly different in subjects with schizophrenia compared to normal controls (F = 0.84, df = 4, 52, p = 0.51). Co-varying for PMI or lifetime dose of antipsychotics did not influence this result. Exploratory analyses find that mGluR2 mRNA is significantly higher in the PN in schizophrenia. (t=2.1, df = 21, p = 0.05; fig 3c) while a trend was observed for the SND (t = 1.91, df 21, p =0.06).
Figure 3.
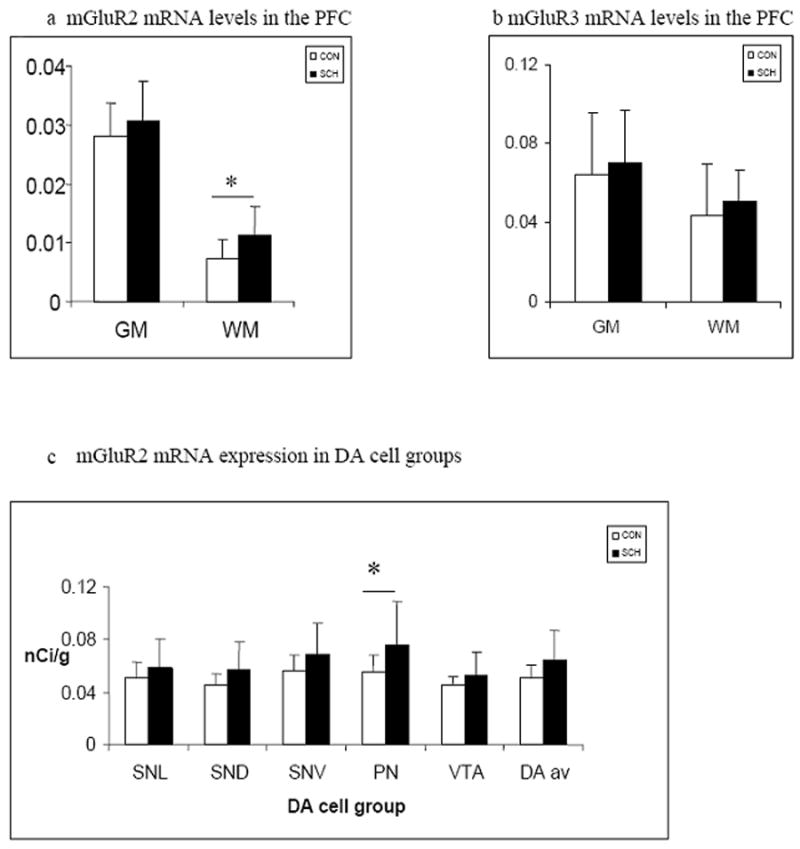
Mean mGluR2 (a,c) and mGluR3 (b) mRNA levels in the PFC (a,b) of normal subjects and patients with schizophrenia in the gray matter (GM) and white matter (WM) and in five dopaminergic cell groups (c) - the substantia nigra pars lateralis (SNL), the dorsal and ventral tiers of the pars compacta (SND and SNV respectively), the paranigral nucleus (PN) and the ventral tegmental area (VTA) (control white bars, schizophrenia filled bars).
Table 2.
mGluR2 and mGluR3 mRNA levels in PFC laminae and WM
| mGluR2 | mGluR3 | |||
|---|---|---|---|---|
| lamina | con | sch | con | sch |
| pCi/g | pCi/g | pCi/g | pCi/g | |
| II | 2.55 ± 0.59 | 2.61 ± 0.54 | 6.27 ± 2.91 | 7.32 ± 2.52 |
| III | 2.64 ± 0.55 | 2.91 ± 0.67 | 5.77 ± 2.79 | 6.36 ± 2.11 |
| IV | 3.26 ± 0.79 | 3.58 ± 0.79 | 6.86 ± 3.27 | 7.77 ± 2.9 |
| V | 2.87 ± 0.61 | 3.07 ± 0.80 | 6.26 ± 2.92 | 6.65 ± 2.41 |
| VI | 2.45 ± 0.48 | 2.59 ± 0.76 | 6.37 ± 3.01 | 7.32 ± 2.86 |
| WM | 0.70 ± 0.32* | 1.07 ± 0.47* | 4.29 ± 2.48 | 5.07 ± 1.57 |
mGluR2 and 3 mRNA levels in PFC laminae II - VI and WM.
WM = white matter. Asterisk denotes significant difference between controls and schizophrenia.
All values are mean ± S.D.
Discussion
In this study, we characterized the normal distribution of mGluR2 and 3 in the normal human PFC and mesencephalon and compared expression levels of expression of these receptors in cases of schizophrenia and matched normal controls. The two main findings of this study are (1) Unlike rodents, human dopaminergic neurons express mGluR2 and 3 mRNA (2) levels of mGluR2 mRNA is higher in the PFC WM in schizophrenia than in matched controls.
Normal Distribution
The distribution of mGluR3 mRNA in the human PFC (Brodmann areas 9, 10, 11) has been previously described (Makoff et al, 1996; Ohnuma et al, 1998). Our findings are consistent with the results of these previous studies. There are no reports of the normal distribution of mGluR2 mRNA in the human PFC. Moreover, the pattern of mGluR2 and mGluR3 gene expression in the human PFC that we characterized is similar to that described in the rat cerebral cortex. Both pyramidal and non-pyramidal neurons, but not glia, were shown to express mGluR2 (Ohishi et al, 1993a; Testa et al, 1994). The distribution pattern of human mGluR3 mRNA in the PFC is also in agreement with studies of the rat where mGluR3 is expressed by both neurons and glia (Ohishi et al 1993b; Tanabe et al, 1993; Testa et al, 1994). In the mesencephalon, however, there are significant differences in distribution of the mGluR2 and mGluR3 between humans and rats. There is robust expression of mGluR2 in the human mesencephalon. In contrast, mGluR2 gene expression is absent in DA neurons of the SN and present at very low levels in DA neurons of the VTA (Ohishi et al, 1993a; Testa et al, 1994). Similarly, mGluR3 is expressed by human, albeit at low levels, but not rat DA neurons (Ohishi et al, 1993b; Testa et al, 1994, 1998). This species-specific distribution pattern of mGluR2 and 3 in DA neurons is potentially important as it suggests the presence of these receptors in projections from the PFC and ventral mesencephalon. The circuit involving the mesencephalon, striatum and PFC has been implicated as a “psychosis” circuit. Descending prefrontal cortical glutamatergic and ascending mesencephalic DA projections converge at the level of individual dendritic spines to form synaptic triads in the striatum of non-human primates (Sesack et al, 1990; Smith et al, 1994; Vezina et al, 1999). Similarly, in the PFC of non-human primates, DA terminals, arising from the mesencephalon, form asymmetric synapses on dendritic spines of pyramidal neurons that are closely apposed to asymmetric synapses, presumably formed by glutamatergic terminals (Smiley et al, 1993). Given that mGluR2 and 3 are expressed pre-synaptically in the human brain (Phillips et al, 2000; Crook et al, 2002), our findings suggest that mGluR2 and 3 may have a unique role in this circuit (fig 4) by providing a molecular substrate for glutamate to directly modulate dopamine release. Importantly, it may provide a mechanism by which the prefrontal cortex directly modulates striatal dopaminergic neurotransmission in humans.
Figure 4.
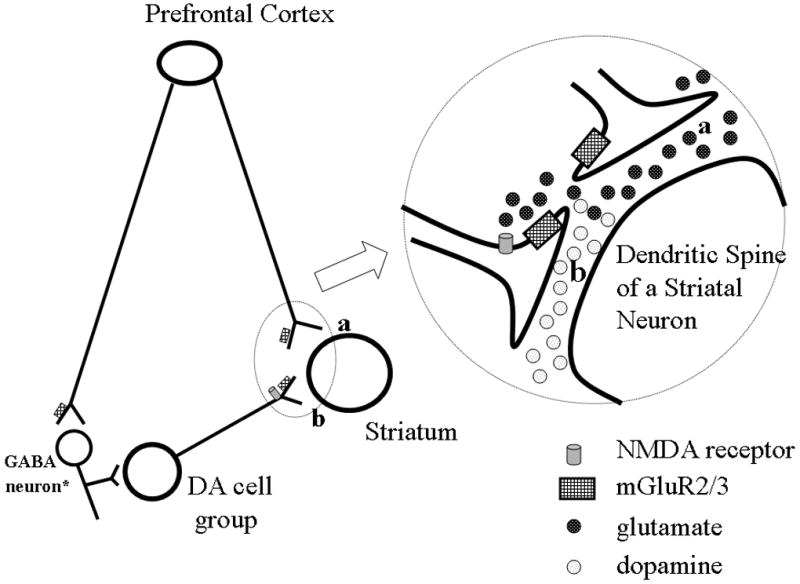
Schematic illustrating distribution of mGluR2 and 3 in the prefrontal-mesencephalic-striatal circuit. The striatum receives projections from PFC neurons and dopamine cell groups (a and b, respectively). Group II mGluRs are expressed presynaptically and on astrocytes (gray boxes). Glutamate (dark circles) released at corticostriate terminals (a) can stimulate mGluR receptors on dopaminergic terminals in the striatum (b) to regulate release of dopamine (light circles). * from Carr and Sesack, 2000.
Differences in schizophrenia
In this study, we report significantly higher levels of mGluR2 mRNA in the PFC WM in schizophrenia compared to controls. This finding is consistent with mounting evidence of WM abnormalities in schizophrenia (Davis et al, 2003; Kubicki et al, 2005, Walterfang et al, 2006). Moreover, magnetic resonance imaging studies find decreases in PFC WM volumes in patients with schizophrenia (Buchanan et al, 1998; Lim et al, 1998; Sanfilipo et al, 2000). Additionally, decreased anisotropy, which reflects coherence of WM tracts, is seen in the PFC of schizophrenic volunteers (Lim et al, 1999; Steel et al, 2002; Buchsbaum et al, 2006). Evidence for WM dysfunction at the molecular level has been found in oligodendrocyte – related genes in some studies (Hakak et al, 2001; review Davis et al, 2003 Haroutunian et al 2007), but not all (Lipska et al, 2007). The later study did not find changes in expression of 4 myelin-related genes, but did find differences in a subset of cases with schizophrenia with a history of substance abuse as well as a significant effect of specific risk alleles in myelin-related genes on their expression levels.
White matter integrity and function is influenced by a number of factors including the glutamate system. Glutamate is released in an activity dependent manner in the white matter (Kriegler and Chiu, 1993). Moreover, glutamate receptors and transporters are expressed in glial cells within white matter fiber tracts (Hassel et al, 2003; Karadottir et al, 2005). In animals, altered glutamate homeostasis is associated with oligodendrocyte and axonal damage (Follett et al, 2000; Matute et al., 1999, 2001; MacDonald et al, 1998; Werner et al., 2001). The impairment in oligodendrocyte integrity seen in schizophrenia may be related to its sensitivity to glutamate. In neurons, group II mGluRs reduce glutamate release via a presynaptic mechanism (review Anwyl yet al, 1999). It is possible, therefore, that the increase in mGuluR2 expression in the PFC WM in schizophrenia is related to altered glutamatergic function.
We recognize that the small sample size in this study raises the possibility of type II error. For this reason, we calculated effect sizes that estimate the likelihood of finding differences with larger sample sizes. Moderate to large effect sizes are seen in the PFC and DA cell groups (Table 3). Also, we see an inverse relationship between mGluR2 mRNA expression and lifetime dose of antipsychotics. This suggests that this receptor is a target of antipsychotic drug action. Additionally, the presence of several polymorphisms in the mGluR3 gene, with specific SNPs found to be associated with schizophrenia, will require studies with larger sample sizes. A splice variant of mGluR3 has been reported (Sartorius et al, 2006), which deserves further evaluation.
Table 3.
Effect sizes of differences in mGluR2 and 3 mRNA levels in schizohrenia
| Gene/region | Effect size |
|---|---|
| mGluR2 | |
| PFC GM | 0.39 |
| PFC WM | 0.96 |
| Average DA cell groups | 0.77 |
| mGluR3 | |
| PFC GM | 0.23 |
| PFC WM | 0.32 |
Cohen’s d effect sizes of mGluR2 and 3 between cases of schizophrenia and controls.
Moderate effect sizes are seen for mGluR2 and 3 in the PFC GM and for mGluR3 in the PFC WM.
Large effect sizes (bold) are seen for mGluR2 in the DA cell groups and PFC WM.
In summary, we find that human DA neurons, in contrast to rodents, express mGluR2 and 3. This species difference should be taken into account when interpreting experimental findings from rodent models of schizophrenia and in the design of clinical studies based on them. The difference in mGluR2 gene expression of the PFC white matter is relevant to the understanding other WM alterations reported in schizophrenia.
Acknowledgments
This research was supported by the Intramural Research Program of the NIH, NIMH. The authors would like to thank Dr. Juraj Cervenak, Dr. Shannon O’Connor and Mrs. Yeva Snitkovsky for technical assistance.
Footnotes
Disclosure/conflicts of interest There are no potential conflicts for any of the authors as it relates to the subject of this report.
References
- Akil M, Kolachana BS, Rothmond DA, Hyde TM, Weinberger DR, Kleinman JE. Catechol-O-methyltransferase genotype and dopamine regulation in the human brain. J Neurosci. 2003;23:2008–13. doi: 10.1523/JNEUROSCI.23-06-02008.2003. [DOI] [PMC free article] [PubMed] [Google Scholar]
- Anwyl R. Metabotropic glutamate receptors: electrophysiological properties and role in plasticity. Brain Res Brain Res Rev. 1999;29:83–120. doi: 10.1016/s0165-0173(98)00050-2. [DOI] [PubMed] [Google Scholar]
- Bishop JR, Ellingrod VL, Moline J, Miller D. Association between the polymorphic GRM3 gene and negative symptom improvement during olanzapine treatment. Schizophr Res. 2005;77:253–60. doi: 10.1016/j.schres.2005.04.001. [DOI] [PubMed] [Google Scholar]
- Buchanan RW, Vladar K, Barta PE, Pearlson GD. Structural evaluation of the prefrontal cortex in schizophrenia. Am J Psychiatry. 1998;155:1049–55. doi: 10.1176/ajp.155.8.1049. [DOI] [PubMed] [Google Scholar]
- Buchsbaum MS, Schoenknecht P, Torosjan Y, Newmark R, Chu KW, Mitelman S, Brickman AM, Shihabuddin L, Haznedar MM, Hazlett EA, Ahmed S, Tang C. Diffusion tensor imaging of frontal lobe white matter tracts in schizophrenia. Ann Gen Psychiatry. 2006;5:19. doi: 10.1186/1744-859X-5-19. [DOI] [PMC free article] [PubMed] [Google Scholar]
- Cartmell J, Monn JA, Schoepp DD. Attenuation of specific PCP-evoked behaviors by the potent mGlu2/3 receptor agonist, LY379268 and comparison with the atypical antipsychotic, clozapine. Psychopharmacology (Berl) 2000;148:423–9. doi: 10.1007/s002130050072. [DOI] [PubMed] [Google Scholar]
- Chen Q, He G, Chen Q, Wu S, Xu Y, Feng G, Li Y, Wang L, He L. A case-control study of the relationship between the metabotropic glutamate receptor 3 gene and schizophrenia in the Chinese population. Schizophr Res. 2005;73:21–6. doi: 10.1016/j.schres.2004.07.002. [DOI] [PubMed] [Google Scholar]
- Cohen J. Statistical power analysis for the behavioral sciences. 2. Hillsdale, NJ: Lawrence Earlbaum Associates; 1988. [Google Scholar]
- Crook JM, Akil M, Law BC, Hyde TM, Kleinman JE. Comparative analysis of group II metabotropic glutamate receptor immunoreactivity in Brodmann’s area 46 of the dorsolateral prefrontal cortex from patients with schizophrenia and normal subjects. Mol Psychiatry. 2002;7:157–64. doi: 10.1038/sj.mp.4000966. [DOI] [PubMed] [Google Scholar]
- Davis KL, Stewart DG, Friedman JI, Buchsbaum M, Harvey PD, Hof PR, Buxbaum J, Haroutunian V. White matter changes in schizophrenia: evidence for myelin-related dysfunction. Arch Gen Psychiatry. 2003;60:443–56. doi: 10.1001/archpsyc.60.5.443. [DOI] [PubMed] [Google Scholar]
- Egan MF, Straub RE, Goldberg TE, Yakub I, Callicott JH, Hariri AR, Mattay VS, Bertolino A, Hyde TM, Shannon-Weickert C, Akil M, Crook J, Vakkalanka RK, Balkissoon R, Gibbs RA, Kleinman JE, Weinberger DR. Variation in GRM3 affects cognition, prefrontal glutamate, and risk for schizophrenia. Proc Natl Acad Sci USA. 2004;101:12604–9. doi: 10.1073/pnas.0405077101. [DOI] [PMC free article] [PubMed] [Google Scholar]
- Follett PL, Rosenberg PA, Volpe JJ, Jensen FE. NBQX attenuates excitotoxic injury in developing white matter. J Neurosci. 2000;20:9235–9241. doi: 10.1523/JNEUROSCI.20-24-09235.2000. [DOI] [PMC free article] [PubMed] [Google Scholar]
- Fujii Y, Shibata H, Kikuta R, Makino C, Tani A, Hirata N, Shibata A, Ninomiya H, Tashiro N, Fukumaki Y. Positive associations of polymorphisms in the metabotropic glutamate receptor type 3 gene (GRM3) with schizophrenia. Psychiatr Genet. 2003;13:71–6. doi: 10.1097/01.ypg.0000056682.82896.b0. [DOI] [PubMed] [Google Scholar]
- Gupta DS, McCullumsmith RE, Beneyto M, Haroutunian V, Davis KL, Meador-Woodruff JH. Metabotropic glutamate receptor protein expression in the prefrontal cortex and striatum in schizophrenia. Synapse. 2005;57:123–31. doi: 10.1002/syn.20164. [DOI] [PubMed] [Google Scholar]
- Hakak Y, Walker JR, Li C, Wong WH, Davis KL, Buxbaum JD, Haroutunian V, Fienberg AA. Genome-wide expression analysis reveals dysregulation of myelination-related genes in chronic schizophrenia. Proc Natl Acad Sci U S A. 2001;98:4746–4751. doi: 10.1073/pnas.081071198. [DOI] [PMC free article] [PubMed] [Google Scholar]
- Haroutunian V, Katsel P, Dracheva S, Stewart D, Davis K. Variations in oligodendrocyte-related gene expression across multiple cortical regions: implications for the pathophysiology of schizophrenia. The International Journal of Neuropsychopharmacology. 2007;10:565–573. doi: 10.1017/S1461145706007310. [DOI] [PubMed] [Google Scholar]
- Hassel B, Boldingh KA, Narvesen C, Iversen EG, Skrede KK. Glutamate transport, glutamine synthetase and phosphate-activated glutaminase in rat CNS white matter. A quantitative study. J Neurochem. 2003;87:230–237. doi: 10.1046/j.1471-4159.2003.01984.x. [DOI] [PubMed] [Google Scholar]
- Karadottir R, Cavelier P, Bergersen LH, Attwell D. NMDA receptors are expressed in oligodendrocytes and activated in ischaemia. Nature. 2005;438:1162–1166. doi: 10.1038/nature04302. [DOI] [PMC free article] [PubMed] [Google Scholar]
- Kriegler S, Chiu SY. Calcium signaling of glial cells along mammalian axons. J Neurosci. 1993;13:4229–4245. doi: 10.1523/JNEUROSCI.13-10-04229.1993. [DOI] [PMC free article] [PubMed] [Google Scholar]
- Krystal JH, Abi-Saab W, Perry E, D’Souza DC, Liu N, Gueorguieva R, McDougall L, Hunsberger T, Belger A, Levine L, Breier A. Preliminary evidence of attenuation of the disruptive effects of the NMDA glutamate receptor antagonist, ketamine, on working memory by pretreatment with the group II metabotropic glutamate receptor agonist, LY354740, in healthy human subjects. Psychopharmacology (Berl) 2005;179:303–9. doi: 10.1007/s00213-004-1982-8. [DOI] [PubMed] [Google Scholar]
- Kubicki M, McCarley RW, Shenton ME. Evidence for white matter abnormalities in schizophrenia. Curr Opin Psychiatry. 2005;18:121–34. doi: 10.1097/00001504-200503000-00004. [DOI] [PMC free article] [PubMed] [Google Scholar]
- Lim KO, Adalsteinsson E, Spielman D, Sullivan EV, Rosenbloom MJ, Pfefferbaum A. Proton magnetic resonance spectroscopic imaging of cortical gray and white matter in schizophrenia. Arch Gen Psychiatry. 1998;55:346–52. doi: 10.1001/archpsyc.55.4.346. [DOI] [PubMed] [Google Scholar]
- Lim KO, Hedehus M, Moseley M, de Crespigny A, Sullivan EV, Pfefferbaum A. Compromised white matter tract integrity in schizophrenia inferred from diffusion tensor imaging. Arch Gen Psychiatry. 1999;56:367–74. doi: 10.1001/archpsyc.56.4.367. [DOI] [PubMed] [Google Scholar]
- Mitkus SN, Hyde TM, Caruso M, Vakkalanka R, Kolachana B, Weinberger DR, Kleinman JE, Lipska BK. Expression of Oligodendrocyte-Associated Genes in Dorsolateral Prefrontal Cortex of Patients with Schizophrenia. Schizophrnia Research. 2007 doi: 10.1016/j.schres.2007.09.032. accepted. [DOI] [PMC free article] [PubMed] [Google Scholar]
- Makoff A, Volpe F, Lelchuk R, Harrington K, Emson P. Molecular characterization and localization of human metabotropic glutamate receptor type 3. Brain Res Mol Brain Res. 1996;40:55–63. doi: 10.1016/0169-328x(96)00037-x. [DOI] [PubMed] [Google Scholar]
- Marenco S, Steele SU, Egan MF, Goldberg TE, Straub RE, Sharrief AZ, Weinberger DR. Effect of metabotropic glutamate receptor 3 genotype on N-acetylaspartate measures in the dorsolateral prefrontal cortex. Am J Psychiatry. 2006;163:740–2. doi: 10.1176/appi.ajp.163.4.740. [DOI] [PMC free article] [PubMed] [Google Scholar]
- Marti SB, Cichon S, Propping P, Nothen M. Metabotropic glutamate receptor 3 (GRM3) gene variation is not associated with schizophrenia or bipolar affective disorder in the German population. Am J Med Genet. 2002;114:46–50. doi: 10.1002/ajmg.1624. [DOI] [PubMed] [Google Scholar]
- Matute C, Domercq M, Fogarty DJ, Pascual de Zulueta M, Sanchez-Gomez MV. On how altered glutamate homeostasis may contribute to demyelinating diseases of the CNS. Adv Exp Med Biol. 1999;468:97–107. [PubMed] [Google Scholar]
- Matute C, Alberdi E, Domercq M, Perez-Cerda F, Perez-Samartin A, Sanchez-Gomez MV. The link between excitotoxic oligodendroglial death and demyelinating diseases. Trends Neurosci. 2001;24:224–30. doi: 10.1016/s0166-2236(00)01746-x. [DOI] [PubMed] [Google Scholar]
- McDonald JW, Althomsons SP, Hyrc KL, Choi DW, Goldberg MP. Oligodendrocytes from forebrain are highly vulnerable to AMPA/kainate receptor-mediated excitotoxicity. Nat Med. 1998;4:291–7. doi: 10.1038/nm0398-291. [DOI] [PubMed] [Google Scholar]
- McRitchie DA, Halliday GM, Cartwright H. Quantitative analysis of the variability of substantia nigra pigmented cell clusters in the human. Neuroscience. 1995;68:539–51. doi: 10.1016/0306-4522(95)00163-d. [DOI] [PubMed] [Google Scholar]
- Moghaddam B, Adams BW. Reversal of phencyclidine effects by a group II metabotropic glutamate receptor agonist in rats. Science. 1998;281:1349–5. doi: 10.1126/science.281.5381.1349. [DOI] [PubMed] [Google Scholar]
- Norton N, Williams HJ, Dwyer S, Ivanov D, Preece AC, Gerrish A, Williams NM, Yerassimou P, Zammit S, O’Donovan MC, Owen MJ. No evidence for association between polymorphisms in GRM3 and schizophrenia. BMC Psychiatry. 2005;5:23. doi: 10.1186/1471-244X-5-23. [DOI] [PMC free article] [PubMed] [Google Scholar]
- Ohishi H, Shigemoto R, Nakanishi S, Mizuno N. Distribution of the messenger RNA for a metabotropic glutamate receptor, mGluR2, in the central nervous system of the rat. Neuroscience. 1993a;53:1009–18. doi: 10.1016/0306-4522(93)90485-x. [DOI] [PubMed] [Google Scholar]
- Ohishi H, Shigemoto R, Nakanishi S, Mizuno N. Distribution of the mRNA for a metabotropic glutamate receptor (mGluR3) in the rat brain: an in situ hybridization study. J Comp Neurol. 1993b;335:252–667. doi: 10.1002/cne.903350209. [DOI] [PubMed] [Google Scholar]
- Ohnuma T, Augood SJ, Arai H, McKenna PJ, Emson PC. Expression of the human excitatory amino acid transporter 2 and metabotropic glutamate receptors 3 and 5 in the prefrontal cortex from normal individuals and patients with schizophrenia. Brain Res Mol Brain Res. 1998;56:207–17. doi: 10.1016/s0169-328x(98)00063-1. [DOI] [PubMed] [Google Scholar]
- Patil ST, Zhang L, Martenyi F, Lowe SL, Jackson KA, Andreev BV, Avedisova AS, Bardenstein LM, Gurovich IY, Morozova MA, Mosolov SN, Neznanov NG, Reznik AM, Smulevich AB, Tochilov VA, Johnson BG, Monn JA, Schoepp DD. Activation of mGlu2/3 receptors as a new approach to treat schizophrenia: a randomized Phase 2 clinical trial. Nat Med. 2007;13:1102–1107. doi: 10.1038/nm1632. [DOI] [PubMed] [Google Scholar]
- Paxinos G, Huang XF. Atlas of the Human Brainstem. Academic Press; 1995. p. 57. [Google Scholar]
- Phillips T, Rees S, Augood S, Waldvogel H, Faull R, Svendsen C, Emson P. Localization of metabotropic glutamate receptor type 2 in the human brain. Neuroscience. 2000;95:1139–56. doi: 10.1016/s0306-4522(99)00353-x. [DOI] [PubMed] [Google Scholar]
- Rajkowska G, Goldman-Rakic PS. Cytoarchitectonic definition of prefrontal areas in the normal human cortex: II. Variability in locations of areas 9 and 46 and relationship to the Talairach Coordinate System. Cereb Cortex. 1995;5:323–37. doi: 10.1093/cercor/5.4.323. [DOI] [PubMed] [Google Scholar]
- Sanfilipo M, Lafargue T, Rusinek H, Arena L, Loneragan C, Lautin A, Feiner D, Rotrosen J, Wolkin A. Volumetric measure of the frontal and temporal lobe regions in schizophrenia: relationship to negative symptoms. Arch Gen Psychiatry. 2000;57:471–80. doi: 10.1001/archpsyc.57.5.471. [DOI] [PubMed] [Google Scholar]
- Sartorius LJ, Nagappan G, Lipska BK, Lu B, Sei Y, Ren-Patterson R, Li Z, Weinberger DR, Harrison PJ. Alternative splicing of human metabotropic glutamate receptor 3. J Neurochem. 2006;96:1139–48. doi: 10.1111/j.1471-4159.2005.03609.x. [DOI] [PubMed] [Google Scholar]
- Sesack SR, Pickel VM. In the rat medial nucleus accumbens, hippocampal and catecholaminergic terminals converge on spiny neurons and are in apposition to each other. Brain Res. 1990;527:266–79. doi: 10.1016/0006-8993(90)91146-8. [DOI] [PubMed] [Google Scholar]
- Smiley, Goldman-Rakic Heterogeneous targets of dopamine synapses in monkey prefrontal cortex demonstrated by serial section electron microscopy: A laminar analysis using the silver-enhanced diamonobenzidine sulfide immunolabelling technique. Cerebral Cortex. 1993;3:223–238. doi: 10.1093/cercor/3.3.223. [DOI] [PubMed] [Google Scholar]
- Smith Y, Bennett BD, Bolam JP, Parent A, Sadikot AF. Synaptic relationships between dopaminergic afferents and cortical or thalamic input in the sensorimotor territory of the striatum in monkey. J Comp Neurol. 1994;344:1–19. doi: 10.1002/cne.903440102. [DOI] [PubMed] [Google Scholar]
- Steel RM, Bastin ME, McConnell S, Marshall I, Cunningham-Owens DG, Lawrie SM, Johnstone EC, Best JJ. Diffusion tensor imaging (DTI) and proton magnetic resonance spectroscopy (1H MRS) in schizophrenic subjects and normal controls. Psychiatry Res. 2001;106:161–70. doi: 10.1016/s0925-4927(01)00080-4. [DOI] [PubMed] [Google Scholar]
- Tanabe Y, Nomura A, Masu M, Shigemoto R, Mizuno N, Nakanishi S. Signal transduction, pharmacological properties, and expression patterns of two rat metabotropic glutamate receptors, mGluR3 and mGluR4. J Neurosci. 1993;13:1372–8. doi: 10.1523/JNEUROSCI.13-04-01372.1993. [DOI] [PMC free article] [PubMed] [Google Scholar]
- Testa CM, Standaert DG, Young AB, Penney JB., Jr Metabotropic glutamate receptor mRNA expression in the basal ganglia of the rat. J Neurosci. 1994;14:3005–18. doi: 10.1523/JNEUROSCI.14-05-03005.1994. [DOI] [PMC free article] [PubMed] [Google Scholar]
- Testa CM, Friberg IK, Weiss SW, Standaert DG. Immunohistochemical localization of metabotropic glutamate receptors mGluR1a and mGluR2/3 in the rat basal ganglia. J Comp Neurol. 1998;390:5–19. 14. [PubMed] [Google Scholar]
- Whitfield HJ, Jr, Brady LS, Smith MA, Mamalaki E, Fox RJ, Herkenham M. Optimization of cRNA probe in situ hybridization methodology for localization of glucocorticoid receptor mRNA in rat brain: a detailed protocol. Cell Mol Neurobiol. 1990;10:145–57. doi: 10.1007/BF00733641. [DOI] [PMC free article] [PubMed] [Google Scholar]
- Vezina P, Kim JH. Metabotropic glutamate receptors and the generation of locomotor activity: interactions with midbrain dopamine. Neurosci Biobehav Rev. 1999;23:577–89. doi: 10.1016/s0149-7634(98)00055-4. [DOI] [PubMed] [Google Scholar]
- Walterfang M, Wood SJ, Velakoulis D, Pantelis C. Neuropathological, neurogenetic and neuroimaging evidence for white matter pathology in schizophrenia. Neurosci Biobehav Rev. 2006;30:918–48. doi: 10.1016/j.neubiorev.2006.02.001. [DOI] [PubMed] [Google Scholar]
- Werner P, Pitt D, Raine CS. Multiple sclerosis: altered glutamate homeostasis in lesions correlates with oligodendrocyte and axonal damage. Ann Neurol. 2001;50:169–80. doi: 10.1002/ana.1077. [DOI] [PubMed] [Google Scholar]