Abstract
Correct identification of peptides and proteins in complex biological samples from proteomic mass-spectra is a challenging problem in bioinformatics. The sensitivity and specificity of identification algorithms depend on underlying scoring methods, some being more sensitive, and others more specific. For high-throughput, automated peptide identification, control over the algorithms’ performance in terms of trade-off between sensitivity and specificity is desirable. Combinations of algorithms, called ‘consensus methods’, have been shown to provide more accurate results than individual algorithms. However, due to the proliferation of algorithms and their varied internal settings, a systematic understanding of relative performance of individual and consensus methods are lacking. We performed an in-depth analysis of various approaches to consensus scoring using known protein mixtures, and evaluated the performance of 2310 settings generated from consensus of three different search algorithms: Mascot, Sequest, and X!Tandem. Our findings indicate that the union of Mascot, Sequest, and X!Tandem performed well (considering overall accuracy), and methods using 80–99.9% protein probability and/or minimum 2 peptides and/or 0–50% minimum peptide probability for protein identification performed better (on average) among all consensus methods tested in terms of overall accuracy. The results also suggest method selection strategies to provide direct control over sensitivity and specificity.
Keywords: Proteomics, Mass-spectrometry, Peptide identification, Bioinformatics, Consensus methods, Consensus set, Comparative evaluation
Introduction
Routine studies in mass spectrometry-based proteomics rely on search algorithms to match tandem mass spectra (MS/MS) against a selected database for peptide identification. In general, the raw spectra file generated by a mass spectrometer is submitted to a search algorithm of choice, which generates an experimental peak list. The experimental peaks (precursor masses and their fragmentation patterns) are then searched by the algorithm against the amino acid sequences of a protein database with constrained search space parameters such as enzyme specificity, numbers of missed cleavages, amino acid modifications and mass tolerance. The details of the MS/MS search criteria greatly differ among the algorithms; additionally, the methods each algorithm uses to assign peptide and fragment ion scores vary in their logic and implementation details. The database search algorithms, therefore, play crucial roles to identify correctly peptides and corresponding proteins (Sadygov et al., 2004). Sequest (Eng et al., 1994) and Mascot (Perkins et al., 1999) are two of the most widely used search algorithms. Sequest peptide scores are based on the similarity between the peptides in experimental and theoretical lists, whereas Mascot uses a probability based Mowse scoring model, where the peptides are scored based on the probability that the match occurred at random. X!Tandem, another search algorithm, creates a model database containing only the identified proteins and performs an extensive search for modified/non-enzymatic peptides only on the identified proteins to improve confidence of identification (Craig et al., 2004). An increasing number of commercial and open source search algorithms are available (Balgley et al., 2007), with unique strengths and weaknesses, and are listed at www.ProteomeCommons.org. Each creates a top ranking protein list based on their scoring method, which cannot necessarily be deemed correct without further validation (Johnson et al. 2005).
To obtain greater mass spectral coverage for improved peptide and protein identification, recent studies have focused on consensus approaches, i.e. merging the search results generated by two or more algorithms (MacCoss et al., 2002; Moore et al., 2003; Chamrad et al., Resing et al., 2004; Boutilier et al.; Kapp et al.; Rudnick et al.2005; Rohrbough et al., 2006; Searle et al., Alves et al., 2008). Most of these evaluation studies focused only on the performance of individual algorithms, while few evaluated consensus approaches. Alves et al., for example, studied seven database search methods using a composite score approach, based on a calibrated expected-value. They reported that a weak correlation may be present among different methods and that the combination does improve retrieval accuracy.
The thorough evaluation of consensus method space is critical for a number of reasons. The first, and most important reason, is that consensus method space is combinatoric. The question of which individual method (e.g., Mascot, Sequest, X!Tandem) should contribute to the consensus result is compounded by the question of how to logically create the consensus (e.g., union vs. intersection vs. other logical statements). Moreover, just as the peptide list generated from each individual method varies according to the search engine’s parameter settings, the output of any given consensus approach will be sensitive to filter or probability settings.
To simplify our search of method space, we refer to a set of peptides derived via a given consensus approach as a ‘consensus set’. We refer to each specific combination of method, consensus logic, and consensus filter settings as a ‘consensus method’ (CM). For a given spectrometry profile, each CM will lead to one consensus set. To disambiguate, we refer to a specific implementation of an algorithm with specific search engine settings as a ‘method’. Individual methods (e.g., Mascot, Sequest), logically, are a type of CM with a set that contains one member. With a growing number of search algorithms, each having numerous search parameter settings, the resulting method space is enormous. Evaluating of the performance of each CM should lead us to improved understanding of the effects our assumptions have on individual search engines, and creating CMs, thus leading to improved peptide identification.
Materials and Methods
Datasets
Two datasets were used in this study. The first dataset was generated from a 10- protein mixture (Searle et al., 2004). In the original study, the sample was reduced with dithiothreitol (DTT), alkylated with iodoacetamide (IAc) and digested with trypsin (Promega) before 22 2-pmol injections. The ESI-MS and MS/MS spectra were acquired with a Micromass Q-TOF-2 with an online capillary LC (Waters, Milford, MA). The second dataset was generated at Thermo Scientific for the University of Pittsburgh’s Genomics and Proteomics Core Laboratories (GPCL) from a 50-human protein mixture (Sigma-Aldrich, St. Louis, MO) digest. The sample was reduced with tris-2-carboxyethylphosphine (TCEP), alkylated with methylmethanethiosulfonate (MMTS) and digested with trypsin (Promega) at GPCL. The ESI-MS and information dependent (IDA) MS/MS spectra were acquired at Thermo (by Research Scientist Tim Keefe) with an LTQ-XL coupled with a nano-LC system (Thermo Scientific, Waltham, MA). The IDA was set so that MS/MS was done on the top three intense peaks per cycle.
Database Search
Both datasets were searched using three search algorithms: Mascot (M), Sequest (S) and X!Tandem (X).
Sequest is a registered trademark of the University of Washington and is embedded into “Bioworks” software distributed by Thermo Scientific Inc. Sequest selects the top 500 candidate peptides based on the rank of preliminary score (Sp), computed by taking into consideration the spectral intensities of the matched fragment ions, continuity of an ion series, and peptide length. The top ranking peptides are then subjected to cross-correlation (Xcorr) analysis, which estimates the similarity between experimental and theoretical spectra (Sadygov et al., 2004; Jiang et al., 2007).
Mascot is a registered trademark of the Matrix Sciences Ltd. It is an open source tool for small datasets and the license is sold at a fee for automatic searching of large datasets. Mascot uses the probability-based Mowse scoring algorithm where the total score calculated for a peptide match is the probability (P) that the observed match is a random event. The final score is reported as -10*LOG10(P), thus a probability of 10−20 becomes a score of 200 implying a good peptide match (Kapp et al., 2005).
X!Tandem is freeware distributed by Global Proteome Machine Organization and is also embedded into the Scaffold software, described later. X!Tandem identifies proteins from the peptide sequences, creates a model database containing only the identified proteins, and performs an extensive search for modified/non-enzymatic peptides only on identified proteins. X!Tandem generates a hyperscore for each comparison between experimental spectra and model spectra, and calculates an expectation-value, giving an estimate of whether or not the observed match is a random event (www.proteomesoftware.com).
The database search results for the 10-protein dataset were provided by Proteome Software, Inc. A control protein database (control_sprot database, unknown version, 127876 entries) was used for searching the 10-protein dataset. The search parameters for the 10-protein dataset were precursor ion tolerance: 1.2 Dalton (Da), fragment ion tolerance: 0.50 Da, fixed modifications: carbamidomethyl on cysteine, and variable modification: oxidation on methionine. IPI Human v3.48 was used for searching the 50-protein dataset. The search parameters for the 50-protein dataset were precursor ion tolerance: 2 Da, fragment ion tolerance: 1 Da, fixed modifications: MMTC on cysteine, and variable modification: oxidation on methionine. The searches on the 50-protein dataset were performed at the GPCL Bioinformatics Analysis Core (BAC) University of Pittsburgh.
Data Merging
We used the software package Scaffold v2.0.1, licensed by Proteome software Inc., to merge search results from Mascot, Sequest and X!Tandem. The scheme that Scaffold uses to merge the probability estimates from Sequest or Mascot with X!Tandem is based upon applying Bayesian statistics to combine the probability of identifying a spectrum with the probability of agreement among search methods. The probability of agreement between search methods is calculated using Peptide and Protein Prophet (Keller et al., 2002; Nesvizhskii et al., 2003).
The search results for the 10-protein and 50-protein datasets were imported into Scaffold, and merged lists of peptides named MSX-10 and MSX-50 were generated for 10-protein and 50-protein datasets, respectively. MSX stands in these cases for the merged results from Mascot, Sequest, and X!Tandem. Please see Table 1 for a list of programs used in this study.
Table 1.
Programs used in this study, their immediate applications and the websites where more information can be obtained, are listed.
| Program | Application | Website |
|---|---|---|
| Mascot | Protein identification/ quantitation | http://www.matrixscience.com |
| Sequest | Protein identification/ quantitation | http://fields.scripps.edu, or http://www.thermo.com |
| X!Tandem | Protein identification | http://www.thegpm.org/TANDEM |
| Scaffold | Protein identification/ validation/quantitation | http://www.proteomesoftware.com |
CMs
Scaffold was used for the generation of CMs: peptides identified under variable Scaffold confidence filter settings, starting from the MSX-10 and MSX-50 peptide lists. Scaffold peptide lists can be generated based on three different settings, which limit the proteins displayed to those that meet all three of the following threshold values set. The three filters in Scaffold (www.proteomesoftware.com) explored were:
Minimum Protein: filters the results by Scaffold’s probability that the protein identification is correct. Identifications with lower probability scores are not shown. A dropdown menu offers several choices between 20–99.9%;
Minimum # Peptides: filters the results by the number of unique peptides on which the protein identification is based. Proteins identified with fewer unique peptides are not shown. A dropdown menu offers choices of 1–5;
Minimum Peptide Probability: filters the results by requiring a minimum identification probability of a peptide from at least one spectrum. A dropdown menu offers several values between 0–95%.
The CMs were manually exported from MSX-10 and MSX-50 peptide lists by keeping any two of the above three filter settings constant and varying the third one. A total of 210 files were generated this way; 11 files (MO, SO, XO, MSI, MXI, SXI, MSXI, MSU, MXU, SXU and MSXU) were generated from each of the 210 files, giving rise to a total of 2310 CMs possible with the Scaffold software filter setting combinations. MO, for example, stands for Mascot only method; MSI stands for the intersection between Mascot and Sequest; and MSXU stands for the union of Mascot Sequest and X!tandem. The list of peptides derived from each CM is defined as the consensus set.
Calculation of Sensitivity and Approximation of Specificity
A program written in Python (RJ and TS) was used to calculate the sensitivity (SN), and a measure we introduce and call “apparent specificity” (SP*) was used for each of the consensus sets. The program inputs are a text file containing the list of expected peptides, text files containing the list of peptides in each of the consensus sets (total 2310 peptide lists), and the total number of peptides that were not expected to be found (total number of false positives). The list of expected peptides was generated from the least stringent MSX peptide list by discarding the false positives (FP) and duplicates. The total number of FP was computed from the least stringent MSX peptide list by discarding the true positives and duplicate peptide sequences.
The program counts the true positives (TP) and false positives, and calculates the false negatives (FN), the SN and SP* for each CM. Because TPs and FNs are known for the two datasets, sensitivity was calculated directly as:
| (1) |
Because true negatives (TN) can not be known directly for studies such as ours, the false positive rate must be estimated. For ease of implementation, we used an indirect approximation of specificity, SP*. Given FPCM as the false positive rate of a given consensus method, and FPTotal as the universe of detected false positive by any method, we can define apparent specificity as calculated as follows:
| (2) |
The precise value of SP* will depend on the methods examined in a study, and it should be considered a relative value and only an approximate measure of the specificity. Values of apparent specificity can only be derived within the context of comparison of methods; it should be not assumed they are empirical estimates of specificity (SP), and because they are plastic to which methods are included in a consensus study, should be not compared directly across studies. Nevertheless, they allow a relative comparison of methods within a study.
Results
The performance of methods and CMs are summarized using “Receiver Operating Characteristics (ROC) Methods Plots”. These are identical to the previously described “data set ROC plots” (Lyons-Weiler, 2005), in this context applied to summarize the performance of various methods. These plots show a single optimally selected point on a ROC curve for each method, making comparative method space exploration tractable. ROC method plots are a good measure of sensitivity and the apparent specificity of an algorithm/ method at a particular cut-off. The cut-off we chose reflects a balance of errors of the first and second kind, mimicking the approach that focuses on maximum accuracy under the assumption of equal error type costs. ROC method plots were generated for both 10-protein and 50-protein datasets each containing 2310 CMs.
All Consensus Methods
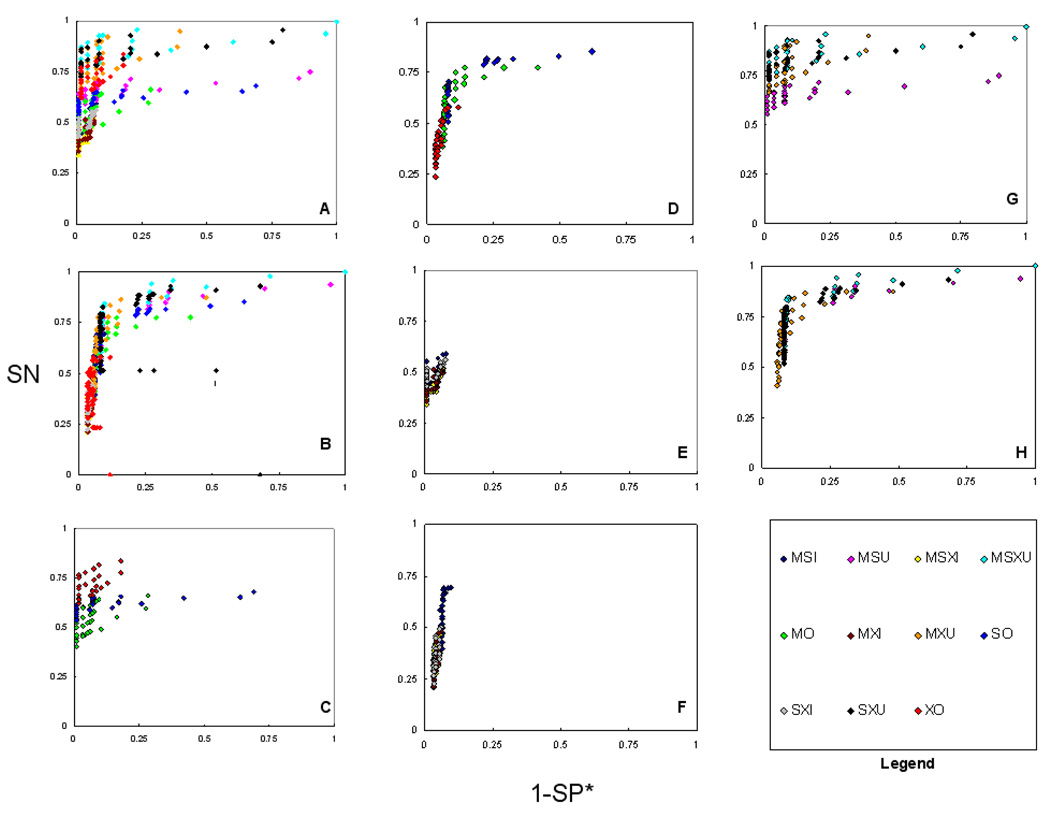
An ROC method plot is a plot of the paired values of SN and SP for any particular method of detection. Our findings (Figure 1) indicate that the union of Mascot, Sequest and X!Tandem (MSXU) for both datasets produced as accurately as possible (optimal) results in terms of SN and SP*, closely followed by SXU and MXU. Individual CMs were less accurate (worse under the optimization function of maximum accuracy) than the unions, but more accurate (better) than the intersections. A general observation for individual CMs of both datasets is: MO was more specific, whereas SO was found to be more sensitive when compared between MO and SO. Of the intersection CMs, MSI performed better in terms of both SN and SP*. For the10-protein dataset, XO performed better than both MO and SO.
Figure 1.
ROC methods plots (SN vs. 1-SP*) of consensus methods (CMs) for two datasets. The three search engines used were Mascot (M), Sequest (S), and X!Tandem (X). The search engine alone (O), intersection (I), and union (U) were compared. A) all CMs,10-protein, B) All CMs, 50-protein, C) individual CMs, 10-protein, D) individual CMs, 50-protein, E) intersection CMs, 10-protein, F) intersection CMs, 50-protein, G) union CMs, 10-protein, and H) union CMs, 50-protein. This figure illustrates the performance of all the consensus methods tested. In general MSXU followed closely by MXU performed accurate in both sensitivity (SN) and apparent specificity (SP*) among both 10-protein and 50-protein datasets.
General Scaffold Filter Trends
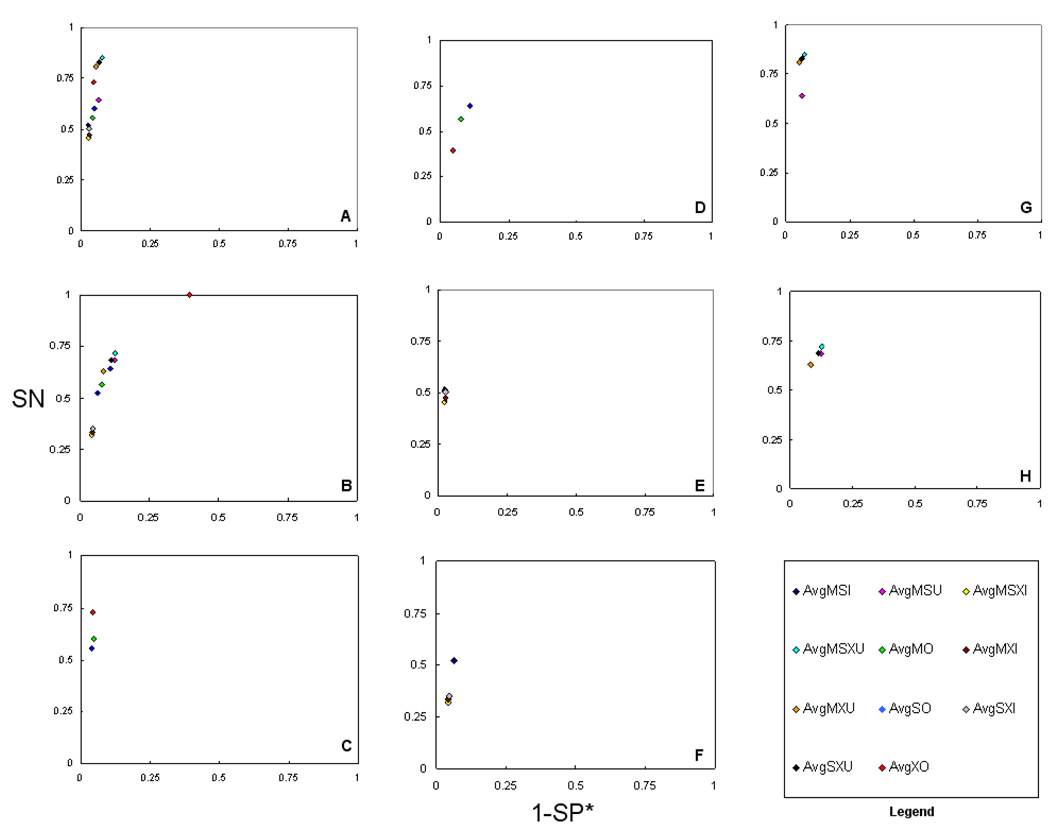
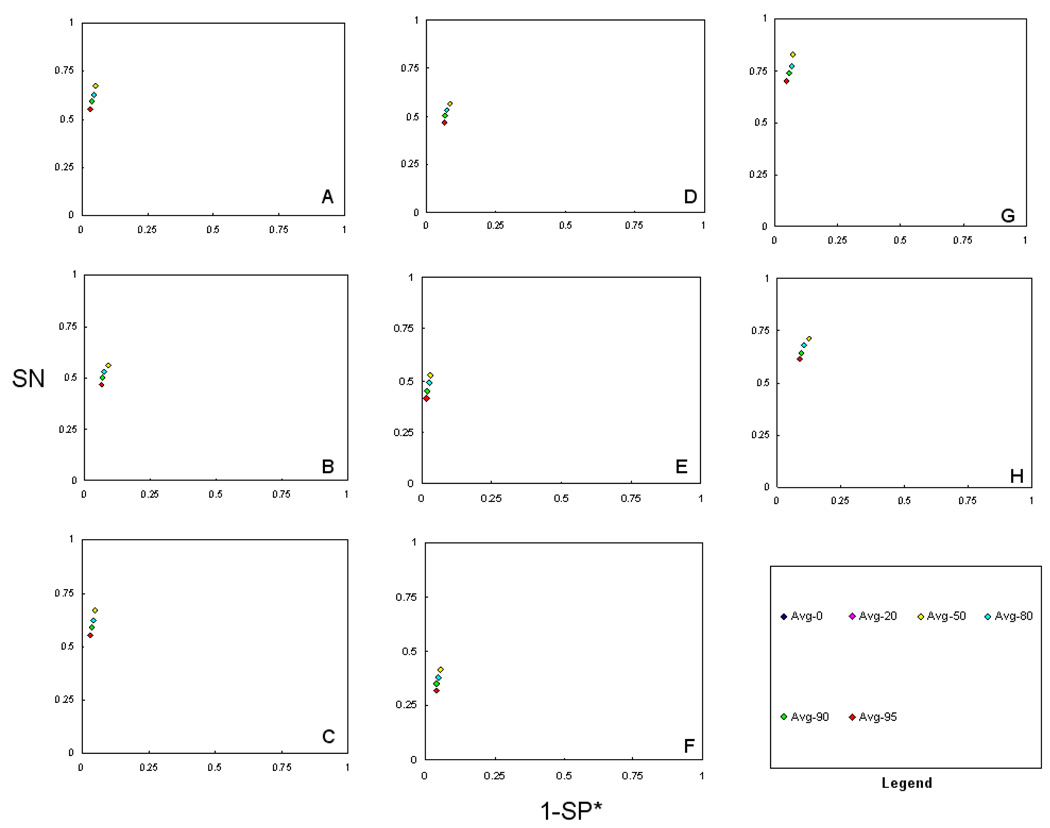
To further detect overall trends in the Scaffold filter settings, we averaged the SN and SP* values within the various filter settings. This allowed us to draw empirical generalizations on the impact of the filter settings. In Figure 2, we summarize the ROC method plot of the average of all the CMs, average of individual CMs, average of intersection CMs, and average of union CMs. The ROC method plot of the average of all CMs (Figure 2, A and B) supports that average MSXU (AvgMSXU) is more accurate than the average of the other ten CMs. Under averaging, SXU and MXU in the 10-protein dataset are the next best performing consensus methods, whereas SXU and MSU are next best performing in 50-protein dataset. The performance trends of average Mascot only (AvgMO), average Sequest only (AvgSO), and average X!Tandem only (AvgXO) individual CMs can be observed in Figure 2 (C and D). AvgXO- 10 (10-protein) showed better performance than AvgMO-10 and AvgSO-10, whereas AvgXO-50 (50-protein) showed the worst performance. One common observation among the two datasets is that both MO-10 and MO-50 tended to be more specific and both SO-10 and SO-50 tended to be more sensitive when compared between MO and SO. The performance of average intersection CMs (Figure 2 E and F) followed a common trend of MSI (intersection of Mascot and Sequest), a result reproduced with the findings from both both datasets. Under averaging, MSXU also showed better performance for both datasets.
Figure 2.
ROC methods plots (SN vs. 1-SP*) of average of consensus methods (CMs) for two datasets. A) average of all CMs,10-protein, B) average of all CMs, 50-protein, C) average of individual CMs, 10-protein, D) average of individual CMs, 50-protein, E) average of intersection CMs, 10-protein, F) average of intersection CMs, 50-protein, G) average of union CMs, 10-protein, and H) average of union CMs, 50-protein. This figure illustrates the performance of the average Scaffold settings of all eleven consensus methods. It is notable that the AvgMSXU appears, overall, most accurate in terms of both SN and SP*. This result was reproducible across both data sets. A comparative accuracy was also observed for the AvgMXU methods. Among the individual methods, MO tended to more specific, and SO tended to be more sensitive. Another finding is that intersection consensus methods showed the highest specificity but at a notable reduction in sensitivity.
Average Minimum Protein Probability of all CMs
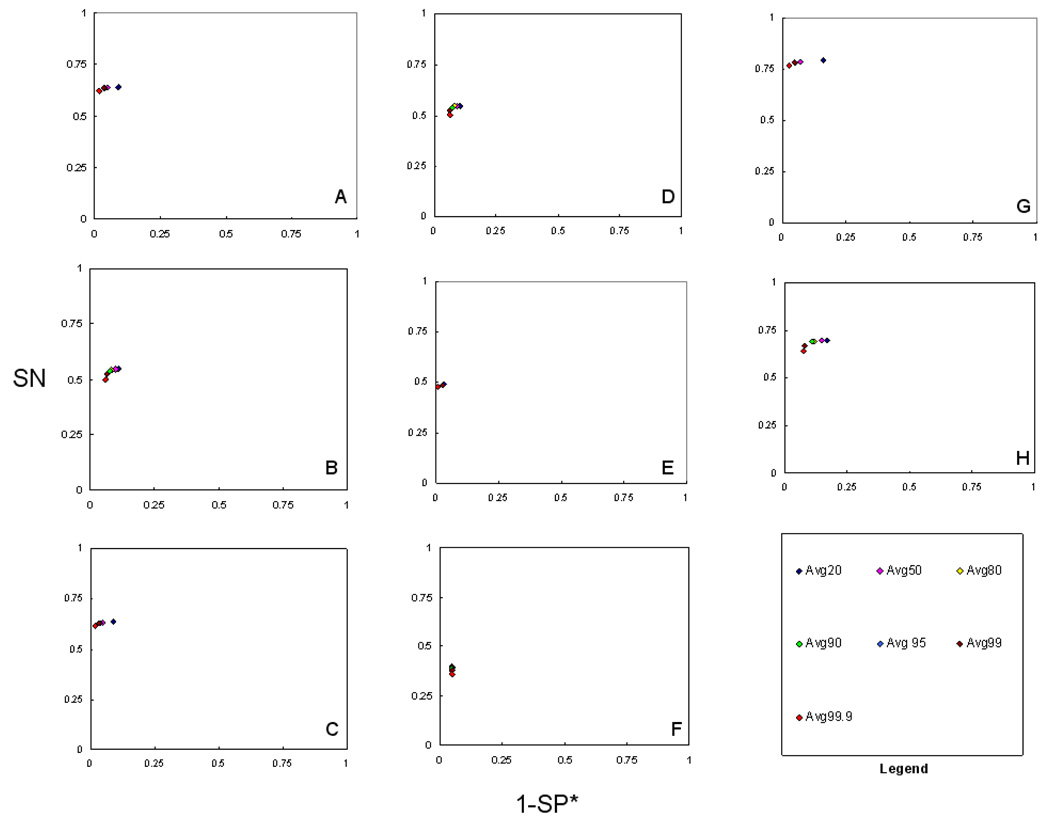
Figure 3 shows ROC method plots of all, individual, intersection, and union CMs within various settings of average minimum protein probability. Among all the CMs, SN remained somewhat constant except, for 50-protein dataset, the average SN of all sets with 99.9% minimum protein probability (Avg99.9) slightly dropped. SP* varied, with a trend of 99.9% being the most specific, and 50 to 99% having similar SP* for 10-protein dataset, and 80 to 99.9% being closely specific for the 50-protein dataset. The same result was observed for the averages of individual and union CMs for 10 and 50-protein datasets. The average of intersection sets with 20–99.9% minimum protein probability perform similarly in terms of SP* for both datasets, except SN falls with higher protein probability for the 50-protein dataset.
Figure 3.
ROC method plot (SN vs. 1-SP*) of average ‘minimum protein probability’ for all consensus methods (CMs) tested. The ‘minimum protein probability’ is the minimum probability at which a protein’s identification is considered correct. The ‘minimum protein probability’ values used were 20%, 50%, 80%, 90%, 95%, 99%, and 99.9%. A–H) Same as figure 2. In case of all CMs, individual CMs and union CMs somewhat constant SN for minimum protein probabilities were observed except Avg99.9 showed slightly dropped SN (A–D, G, and H). Avg50-Avg99 show similar SP* for 10-protein dataset whereas Avg80-Avg99 show close SP* for the 50-protein dataset. In case of intersection consensus methods, CMs Avg20-Avg99.9 performed similarly in terms of SP* for both datasets except SN is reduced via higher protein probability for the 50-protein dataset (E and F).
Average Minimum Number of Peptides of all CMs
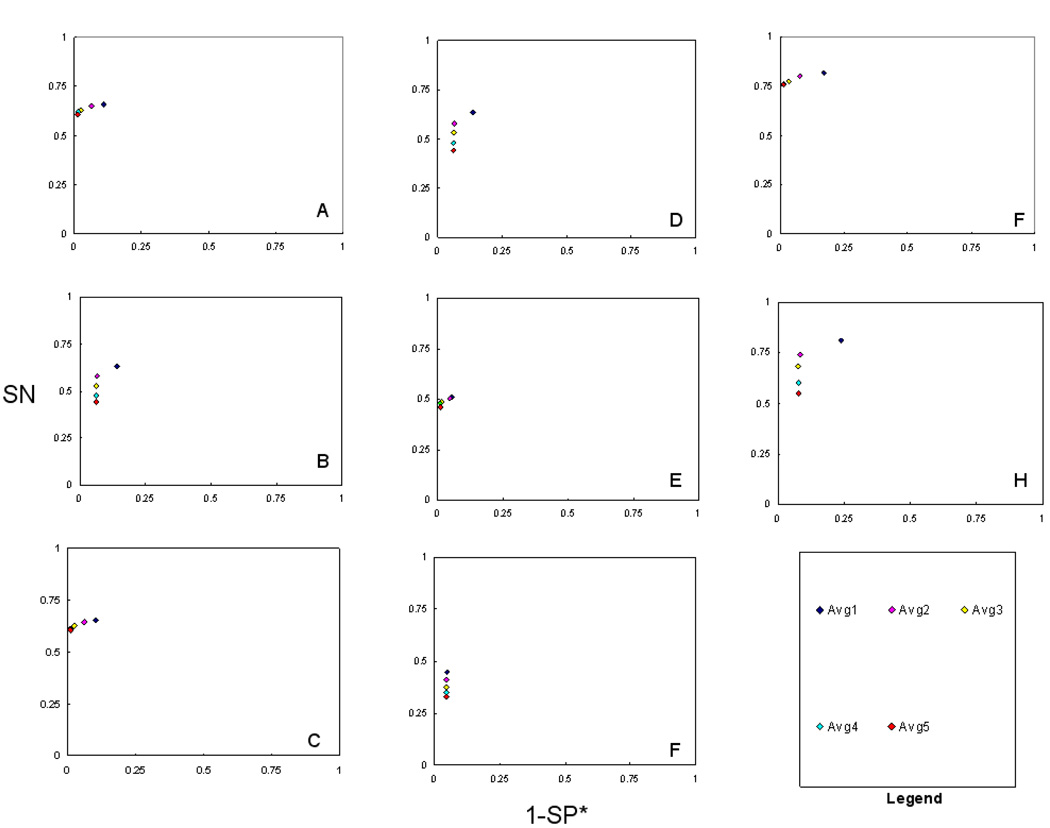
Figure 4 shows ROC method plots of all, individual, intersection, and union CMs in terms of average minimum number of peptides. Considering the average of all, individual and union CMs for both datasets average CMs with minimum of two peptides performed best. Average CMs with three to five minimum peptides were apparently more specific, but lost SN. The CM with one minimum peptide was found to have the highest SN for 50-protein dataset. The average of intersection sets with one to two minimum peptides were better in SN and those with 3–5 minimum peptides performed better in SP* for 10-protein dataset. For 50-protein dataset, the average intersection CMs with one to five minimum peptides performed similar in SP*, and those with one minimum peptide showed the highest SN.
Figure 4.
ROC method plot (SN vs. 1-SP*) of average ‘minimum number of peptides’ for all consensus methods (CMs) tested. The ‘minimum number of peptides’ value refers to the number of unique peptides the protein identification is based on. The ‘minimum number of peptides’ values used were 1, 2, 3, 4 and 5. A–H) Same as figure 2. Individual and union CMs with minimum two peptides performed accurately in terms of SN and SP*. CMs with three to five minimum peptides were apparently more specific, but at a loss in sensitivity. The intersection CMs with one to two minimum peptides were more sensitive and those with three to five minimum peptides performed apparently more specific for the10-protein dataset. For the 50-protein dataset, the average intersection CMs with one to five minimum peptides performed similar in SP*. Average CM with one minimum peptide was found to have the highest SN for this dataset.
Average Minimum Peptide Probability of all CMs
For average of all, individual, intersection, and union CMs in terms of average minimum protein probability, consensus methods with 0–50% minimum peptide probability consistently performed better (Figure 5).
Figure 5.
ROC method plot (SN vs. 1-SP*) of average ‘minimum peptide probability’ of all consensus methods (CMs) tested. The ‘minimum peptide probability’ requires a minimum probability from at least one spectrum. The minimum peptide probability values used were 0%, 20%, 50%, 80%, 90%, and 95%. A–H) Same as figure 2. All the CMs with average 0–50% minimum peptide probabilities performed consistently better that those with average 80–95% minimum peptide probabilities.
Consensus Methods that Provide Control Over Sensitivity and Specificity
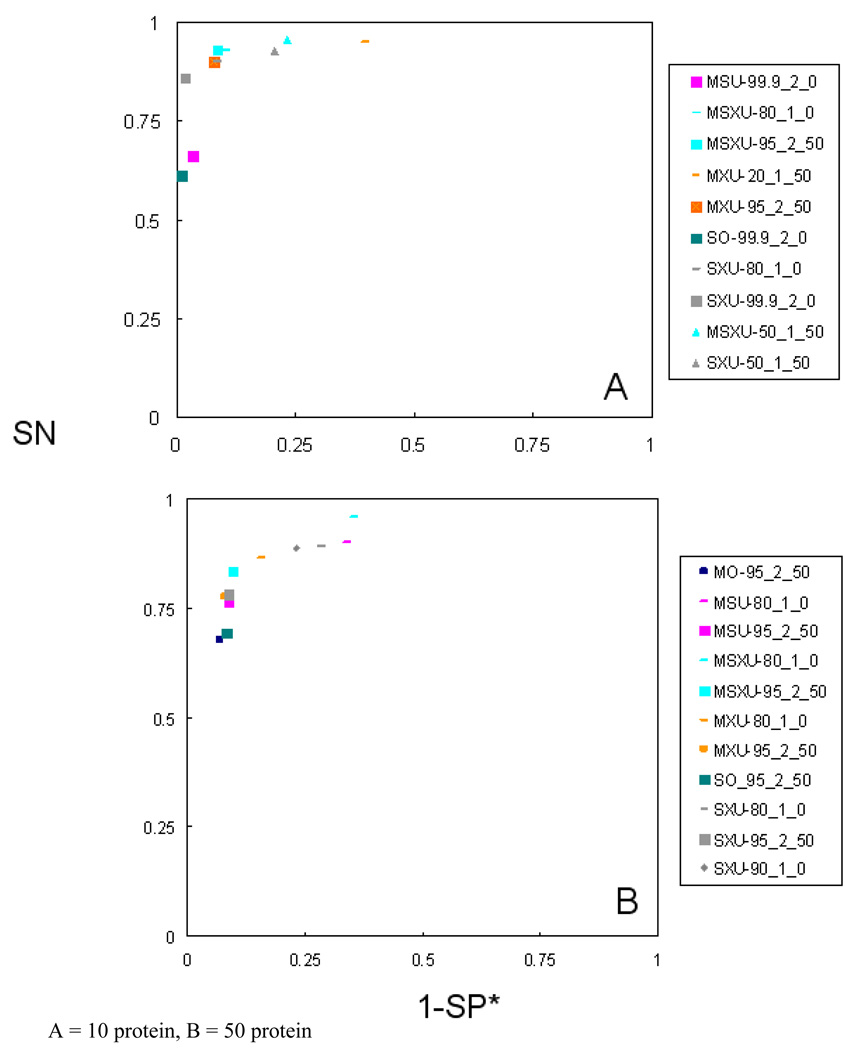
Figure 6 emphasizes the results from some selected methods to allow control over the SN and SP of a given search. Few selected spots are shown in the figure for clear viewing purpose. The figure points out to methods that are either highly sensitive or highly specific for those who are interested in SN at the cost SP* and vice versa. Some of these methods are obviously using either high protein probability or low minimum number of peptides, and therefore should be carefully implemented for peptide identification.
Figure 6.
Representative consensus methods demonstrating the potential for control over SN, SP and accuracy via choice of consensus method.
Discussion
The conclusions that data analysts might find most interesting include (a) the possibility that union methods may be generally recommended, (b) that various filter settings result in specific responses in SN and SP*, and (c) that certain CMs may be useful in controlling SN and SP.
From the sensitivity (SN) and apparent specificity (SP*) data, it is apparent that the MSXU-10 and MSXU-50 CMs showed overall better performance than the other CMs. The AvgMSXU-10 and AvgMSXU-50 also showed the same trend. The closely followed CMS were AvgMXU, which performed comparatively with AvgMSXU. Among the individual methods, better performance of AvgXO-10, while poor performance of AvgXO-50, may be related to relatively smaller database that was used for searching the 10-protein mixture, and requires further study. The observation that the MO performed better in terms of specificity and SO performed better in terms of sensitivity is due to the comparatively strict MOWSE algorithm used by Mascot, and the relatively liberal scoring algorithm used by Sequest, respectively.
Nevertheless, it is clear from the results that there is common trend of generalizability among the two datasets. The union approach performs better overall, compared to the intersection approach, in terms of raw accuracy, whereas the later performs better in terms of SP* at a cost to SN. The methods among the two data sets show similar performance trends considering minimum number of peptides and minimum peptide probability even though the best sets are with minimum protein probability between 80–99.9%. It is apparent that in case of both datasets, the CMs based on the identification of at least 2 minimum peptides and 0 to 50 percent minimum peptide probability consistently perform better than the others. We interpret this result as reflecting that when protein probability is set to at least 95%, the conservative settings of the original search engines already provide a de facto filter on the minimum peptide probability, and therefore strict filtering on minimum peptide probability does not further increase SN or SP*. Thus for this consensus study, the results were insensitive to minimum peptide probability. An important caveat is that this does not mean minimum peptide probability is an irrelevant filter or search parameter in all cases. Our results empirically support the position that, assuming that the cost of following up on false positives is equivalent to missing a true positive, one should consider at least two minimum peptides for confidence protein identification, and avoid ‘one hit wonders’ if maximum accuracy is desired.
An important caveat of the consensus study is that the study outcome is limited to the mass spectrum platform, database and search algorithms, as well as the initial database search parameters of choice. This may or may not limit the generalizability of our findings (Jiang et al., 2007).
Our approximation of SP via SP* is also worth considering. Obviously, as additional peptide signatures are added to the databases, and as additional search algorithms are developed, the universe of detected false positives increases. In this way, the results are comparable within a given study, but the SP* of a given method will change with the specifics of the given study. The approximation SP* is meant only to provide relative information.
Our results are based on the observation from two datasets of known proteins and will be further investigated with additional datasets, search engines, and databases as part of future research. The outcome of this study provided us with useful information for further consensus study, generalization, and automated program development. One can now focus on only methods that require identification of two minimum peptides and 50% minimum peptide probability, rather than searching through thousands of methods (assuming equal costs of misses and misleads). For choosing the optimal performance, we have focused on methods that are higher than 0.8 in both SN and SP*. We understand that there is not likely to be one universally best overall CM, but the outcome of this study has lead to the relative prioritization of a few ‘good’ methods to be preferred among thousands of methods. It is also likely that proteomic data analysts would prefer direct control over SN and SP in protein identification problem, and in some applications, prefer a more specific method at the cost of sensitivity, and vice versa, depending on the specific application. For example, in the case where high specificity is desired, the CMs that gave high specificity and retained reasonable sensitivity (>50%) were MO and MXU; in the case where high sensitivity is desired but low specificity could be tolerated one might consider the SO, MSU and the SXU CMs. Because known protein datasets were used, it was possible to manually validate the results. The outcome of this study informs on the trends, the response of the filter settings, and consensus set determination, but not necessarily on the application of any specific method on new datasets from other mass spectrometry platforms. The study results will hopefully bring about the design of future studies researching the effect of databases, algorithms and/or search parameters on CMs. The results will also provide feedback for priorities in the design of novel software to automate the evaluation approach used in this study.
Acknowledgement
The authors thank Mark Turner (Proteome Software Inc.) and Mark Pitman (GeneBio, Inc.) for sharing the search engine results for the 10-protein dataset. This research was made possible by Grant Number 1 UL1 RR024153 from the National Center for Research Resources (NCRR), a component of the National Institutes of Health (NIH), and NIH Roadmap for Medical Research.
References
- 1.Alves G, Wu WW, Wang G, Shen RF, Yu YK. Enhancing peptide identification confidence by combining search methods. J Proteome Research. 2008;7:3102–3113. doi: 10.1021/pr700798h. [DOI] [PMC free article] [PubMed] [Google Scholar]
- 2.Balgley BM, Laudeman T, Yang L, Song T, Lee CS. Comparative Evaluation of Tandem MS Search Algorithms Using a Target-Decoy Search Strategy. Mol Cell Proteomics. 2007;6:1599–1608. doi: 10.1074/mcp.M600469-MCP200. [DOI] [PubMed] [Google Scholar]
- 3.Boutilier K, Ross M, Podtelejnikov AV, Orsi C, Taylor R, et al. Comparison of different search engines using validated MS/MS test datasets. Anal Chim Acta. 2005;534:11–20. [Google Scholar]
- 4.Chamrad DC, Körting G, Stühler K, Meyer HE, Klose J, et al. Evaluation of algorithms for protein identification from sequence databases using mass spectrometry data. Proteomics. 2004;4:619–628. doi: 10.1002/pmic.200300612. [DOI] [PubMed] [Google Scholar]
- 5.Craig R, Beavis RC. TANDEM: matching proteins with tandem mass spectra. Bioinformatics. 2004;20:1466–1467. doi: 10.1093/bioinformatics/bth092. [DOI] [PubMed] [Google Scholar]
- 6.Eng JK, McCormack AL, Yates JR., III An approach to correlate tandem mass spectral data of peptides with amino acid sequences in a protein database. J Am Soc Mass Spectrom. 1994;5:976–989. doi: 10.1016/1044-0305(94)80016-2. [DOI] [PubMed] [Google Scholar]
- 7.Jiang X, Jiang X, Han G, Ye M, Zou H. Optimization of filtering criterion for SEQUEST database searching to improve proteome coverage in shotgun proteomics. BMC Bioinformatics. 2007;8:323–334. doi: 10.1186/1471-2105-8-323. [DOI] [PMC free article] [PubMed] [Google Scholar]
- 8.Johnson RS, Davis MT, Tayler JA, Patterson SD. Informatics for protein identification by mass spectrometry. Methods. 2005;35:223–236. doi: 10.1016/j.ymeth.2004.08.014. [DOI] [PubMed] [Google Scholar]
- 9.Kapp EA, Schutz F, Connolly LM, Chakel JA, Meza JE, et al. An evaluation, comparison, and accurate benchmarking of several publicly available MS/MS search algorithms: sensitivity and specificity of analysis. Proteomics. 2005;5:3475–3490. doi: 10.1002/pmic.200500126. [DOI] [PubMed] [Google Scholar]
- 10.Keller A, Nesvizhskii AI, Kolker E, Aebersold R. Empirical statistical model to estimate the accuracy of peptide identifications made by MS/MS and database search. Anal Chem. 2002;74:5383–5392. doi: 10.1021/ac025747h. [DOI] [PubMed] [Google Scholar]
- 11.Lyons-Weiler J. Standards of excellence and open questions in cancer biomarker research: an informatics perspective. Cancer Informatics. 2005;1:1–7. [PMC free article] [PubMed] [Google Scholar]
- 12.MacCoss MJ, Wu CC, Yates JR., III Probability-based validation of protein identifications using a modified SEQUEST algorithm. Anal Chem. 2002;74:5593–5599. doi: 10.1021/ac025826t. [DOI] [PubMed] [Google Scholar]
- 13.Moore RE, Young MK, Lee TD. Qscore: an algorithm for evaluating SEQUEST database search results. J Am Soc Mass Spectrom. 2003;12:378–386. doi: 10.1016/S1044-0305(02)00352-5. [DOI] [PubMed] [Google Scholar]
- 14.Nesvizhskii AI, Kolker E, Aebersold R. A statistical model for identifying proteins by tandem mass spectrometry. Anal Chem. 2003;75:4646–4658. doi: 10.1021/ac0341261. [DOI] [PubMed] [Google Scholar]
- 15.Perkins DN, Pappin DJ, Creasy DM, Cottrell JS. Probability-based protein identification by searching sequence databases using mass spectrometry data. Electrophoresis. 1999;20:3551–3567. doi: 10.1002/(SICI)1522-2683(19991201)20:18<3551::AID-ELPS3551>3.0.CO;2-2. [DOI] [PubMed] [Google Scholar]
- 16.Resing K, Meyer-Arendt K, Mendoza AM, Aveline-wolf LD, Jonscher KR, et al. Improving reproducibility and sensitivity in identifying human proteins by shotgun proteomics. Anal Chem. 2004;76:3556–3568. doi: 10.1021/ac035229m. [DOI] [PubMed] [Google Scholar]
- 17.Rohrbough J, Breci L, Merchant N, Miller S, Haynes PA. Verification of single-peptide protein identification by the application of complementary search algorithms. J Biomolecular Techniques. 2006;17:327–332. [PMC free article] [PubMed] [Google Scholar]
- 18.Rudnick PA, Wang Y, Evans EL, Lee CS, Balgley BM. Large scale analysis of MASCOT results using a mass accuracy-based threshold (MATH) effectively improves data interpretation. J Proteome Res. 2005;4:1353–1360. doi: 10.1021/pr0500509. [DOI] [PubMed] [Google Scholar]
- 19.Sadygov RG, Cociorva D, Yates JR., III Largescale database searching using tandem mass spectra: looking up the answer in the back of the book. Nat Methods. 2004;1:195–202. doi: 10.1038/nmeth725. [DOI] [PubMed] [Google Scholar]
- 20.Searle BC, Turner M, Nesvizhskii AI. Improving sensitivity by probabilistically combining results from multiple MS/MS search methodologies. J Proteome Research. 2008;7:245–253. doi: 10.1021/pr070540w. [DOI] [PubMed] [Google Scholar]
- 21.Searle BC, Dasari S, Turner M, Reddy AP, Choi D, et al. High-throughput identification of proteins and unanticipated sequence modifications using a mass-based alignment algorithm for MS/MS de novo sequencing results. Anal Chem. 2004;76:2220–2230. doi: 10.1021/ac035258x. [DOI] [PubMed] [Google Scholar]


