

Abstract
The proportion of neural progenitors that remain in (P fraction) and exit from (Q fraction) the cell cycle determines the degree of neurogenesis. Using S-phase labeling with 5-bromo-2′-deoxyuridine and a double nucleoside analog-labeling scheme, we measured the cell-cycle kinetics of neural progenitors and estimated the proportion of P and Q fractions in the subventricular zone (SVZ) of adult rats subjected to stroke. Stroke increased SVZ cell proliferation, starting 2 days, reaching a maximum 4 and 7 days after stroke. The cell-cycle length (TC) of SVZ cells changed dynamically over a period of 2 to 14 days after stroke, with the shortest length of 11 h at 2 days after stroke. The reduction of the TC resulted from a decrease of the G1 phase because the G2, M, and S phases were unchanged. In addition, during this period, reduction of the G1 phase was concomitant with an increase in the P fraction, whereas an augmentation of the Q fraction was associated with lengthening of the G1 phase. Furthermore, approximately 90% of cells that exited the cell cycle were neurons and the population of a pair of dividing daughter cells with a neuronal marker increased from 9% at 2 days to 26% at 14 days after stroke. These data suggest that stroke triggers early expansion of the progenitor pool via shortening the cell-cycle length and retaining daughter cells within the cell cycle, and the lengthening of G1 leads to daughter cells exiting the cell cycle and differentiating into neurons.
Keywords: cell cycle length, mitosis, neurogenesis, rat, stroke, subventricular zone
Introduction
Neurogenesis is coordinated with cell-cycle egress and neuronal differentiation (Caviness et al, 1995; McConnell, 1995; Rakic, 1995; Takahashi et al, 1996; Haydar et al, 1999; Calegari et al, 2005; Huttner and Kosodo, 2005). Takahashi et al (1996) show that increases in the proportion of cells that exit the cell cycle in pseudostratified ventricular epithelium are concurrent with extending the length of cell cycle over six embryonic interval days 11 to 17 (E11 to E17) and this increase in cell-cycle length parallels switching the cell divisions from proliferating to neuron-generating. Thus, neocortical formation proceeds via the sequence of progression of progenitors toward neuronal differentiation (McConnell, 1995; Rakic, 1995; Takahashi et al, 1996; Temple, 2001; Koutmani et al, 2004; Huttner and Kosodo, 2005).
The ventricular zone is replaced by an ependymal layer while the subventricular zone (SVZ) persists in the adult rodent (Morshead et al, 1998). The SVZ contains actively proliferating progenitors and relatively quiescent stem cells, which generate neurons and glia throughout adulthood (Morshead et al, 1998; Temple and Alvarez-Buylla, 1999). Stroke increases neurogenesis in the SVZ and newly generated neurons migrate toward ischemic boundary regions (Arvidsson et al, 2002; Parent et al, 2002; Jin et al, 2003; Zhang et al, 2004a, b, 2006; Gotts and Chesselet, 2005; Carmichael, 2006; Thored et al, 2006; Yamashita et al, 2006). Generation of new neurons involves proliferation of progenitors, subsequent withdrawal from the cell cycle and differentiation (Caviness et al, 1995; Takahashi et al, 1996). We showed previously that the adult SVZ contains asymmetric, symmetric terminal, and symmetric non-terminal cell divisions and that stroke-induced neurogenesis might result from transiently switching neural progenitors division from asymmetric to symmetric and from a reduction of the length of cell cycle (Zhang et al, 2006). However, what has not been investigated is whether changes of the proportion of asymmetric, symmetric terminal, and symmetric non-terminal cell divisions are related to changes of proportion of cells that remain or exit the cell cycle after stroke. In this study, we adapted a model of neocortical neurogenesis to examine cell-cycle kinetics of neural progenitors and estimated the Q and P fractions within the cell cycle over 14 days of stroke using a double nucleoside analog-labeling scheme method. Moreover, using triple immunostaining methods, we determined the fate of cells that exit the cell cycle. Our data suggest that stroke triggers early expansion of the SVZ neural progenitor pool via shortening the cell-cycle length and retaining daughter cells within the cell cycle, and that lengthening the cell cycle and the G1 phase leads to the daughter cells exiting the cell cycle and differentiating into neurons.
Materials and methods
All experimental procedures have been approved by Institutional Animal Care and Use Committee of Henry Ford Health System.
Animal Model of Stroke
Male Wistar rats (3- to 4-months old, n = 68) were employed. The right middle cerebral artery was occluded by placement of an embolus at the origin of the middle cerebral artery according to our published method (Zhang et al, 1997).
Cumulative and Single S-Phase Pulse 5-Bromo-2′-Deoxyuridine Labeling
Using a cumulative 5-bromo-2′-Deoxyuridine (BrdU)-labeling protocol established by Nowakowski et al (1989) and also based on our previous study (Zhang et al, 2006), we estimated the length of cell cycle (TC), the length of S phase (TS), and the proliferating population of SVZ cells. This protocol requires the serial BrdU injections be spaced so that the length of non-labeled intervals between injections is less than the length of S phase such that all nuclei passing through S phase will be labeled. Thus, BrdU labeling was performed by repeated intraperitoneal injection (2 to 3 h intervals; 50 mg/kg, Sigma, Atlanta, GA, USA) over a total period of 15.5 to 18.5 h, beginning at 0800 hours Selected rats from 2, 4, and 14 days after stroke were killed 30 mins after each of the BrdU injections. Three to four animals per time point were killed with a total of 10 time points. Rats without stroke were subjected to the same injection protocol of BrdU and were used as a control group (Zhang et al, 2006). To estimate the G2 and M phases (TG2 + M) of the cell cycle, a single-pulse BrdU protocol was used (Nowakowski et al, 1989; Takahashi et al, 1993; Zhang et al, 2006). Rats subjected to 2, 4, and 14 days of stroke received a single injection of BrdU (intraperitoneally, 50 mg/kg) at 0800 hours and were killed 30, 40, 50, 60, 90, 120, 160, and 180 mins after the injection, with 3 to 4 rats per time point (Zhang et al, 2006). The cell kinetics at 7 days after stroke were measured in our previous study (Zhang et al, 2006). Therefore, the single and cumulative BrdU protocols for 7-day time point were not performed in this study.
Double Nucleoside Analog S-Phase Labeling
To determine the P and Q fractions of proliferating SVZ cells, we adapted two separate tracer injection (Zink et al, 1998) protocols described by Takahashi et al (1994) with some modification (Supplementary Figure 1). To determine the number of cells in the combined Q + P fractions (NQ+P, protocol 1), rats subjected to 2, 4, 7, and 14 days of stroke were injected (intraperitoneally) with 5-chloro-2′-deoxyuridine (CldU, 50 mg/kg, Sigma) at 0800 hours and rats without stroke received same injection of CldU and were used as a control group. The CldU labeled the cells in S phase. Two hours later at 01000 hours, the rats were injected (intraperitoneally) with 5-iodo-2′-deoxyuridine (IdU, 50 mg/kg, Sigma), which again labeled cells in S phase. These rats were killed at a time which was longer than the duration of the cell cycle minus the duration of S phase (Takahashi et al, 1994). To determine the number of cells in the Q fraction (NQ, protocol 2), the second set of rats were injected (intraperitoneally) with CldU and IdU at 0800 and 1000 hours, respectively. After that, the rats received additional IdU injections at an interval > Tc-Ts (Takahashi et al, 1994), which labels the cells that re-enter S phase. Thus, the number of cells labeled only with CldU corresponds to the number of cells in the Q fraction (NQ) (Takahashi et al, 1994). Using the two injection protocols in two sets of rats, therefore, we were able to determine the proliferative and postmitotic behaviors of the 2-h cohort of cells of the SVZ, that is NQ+P and NQ from protocol 1 and 2, respectively. The Q fraction can then be calculated as Q = NQ/NP + Q and the P fraction is equal to 1-Q (Takahashi et al, 1994). The CldU and IdU have been used to label the S phase of SVZ cells (Maslov et al, 2004).
Figure 1.

Stroke changes of BrdU-labeling index (LI) determined by cumulative labeling with BrdU in SVZ cells. (A to D) Linear ascending of LI toward the plateau in normal rats and rats subjected to stroke. (A to D) The time at which BrdU reached a maximum (TC-TS) was 14 h in rats without stroke. However, the maximum (TC-TS) was (A)9,(A) 10, (C) 11, and (D) 15 h at (A)2,(B)4,(C)7, and (D) 14 days after stroke, respectively. The percentage of cells proliferating (GF) was 20% in non-stroke and (A) 24% (2 days), (B) 30% (4 days), (C) 31% (7 days), and (D) 24% (14 days) in stroke.
Histology and Immunohistochemistry
At the end of the experiment, animals were transcardially perfused with heparinized saline followed by 4% paraformaldehyde. Brains were postfixed in 4% paraformaldehyde and embedded in paraffin. Coronal sections (6 μm) that contain the lateral ventricles were cut serially at the level of AP + 10.6 mm (genu corpus callosum) and AP + 9.2 mm (anterior commissure crossing) (Paxinos and Watson, 1986). A subset of rats was killed and brain coronal sections (40 μm) of the lateral ventricles were cut on a cryostat set at -20°C and kept in -80°C.
Immunohistochemistry was performed, as described previously (Zhang et al, 2001). The following antibodies were used in this study: mouse anti-BrdU (1:1,000, Boehringer Mannheim, Indianapolis, IN, USA); mouse anti-BrdU (1:50, BD Biosciences, San Jose, CA, USA); rat-anti-BrdU (1:200, Accurate Chemicals, Westbury, NY, USA); rabbit anti-phospho-Histone H3 (HH3) (1:1,000, Upstate Biotech, Lake Placid, NY, USA) and goat anti-doublecortin (DCX; 1:200, Santa Cruz Biotechnology, Santa Cruz, CA, USA); guinea-pig anti-DCX (1:250, Chemicon, Temecula, CA, USA); rabbit anti-glial fibrillary acidic protein (1:500; Dako Cytomation California Inc., Carpinteria, CA, USA). HH3 is a marker of G2/M phases of proliferating cells (Kuan et al, 2004).
For BrdU immunostaining, DNA was first denatured by incubating coronal sections in 50% formamide 2 × SSC at 65°C for 2 h and then in 2 N HCl at 37°C for 30 mins (Zhang et al, 2001). Sections were incubated with the anti-BrdU antibody (1:1,000, Boehringer Mannheim) overnight and then incubated with biotinylated secondary antibody (1:200, Vector Laboratories, Burlingame, CA, USA) for 1 h. Reaction product was detected using 3′3′-diaminobenzidine-tetrahydrochloride (Sigma).
For double immunofluorescent staining of CldU and IdU, slides were pretreated with citrate followed by 2 N HCl for 30 mins at room temperature, and stained for CldU and IdU as described previously (Aten et al, 1994). Briefly, slides were incubated overnight with mouse anti-BrdU antibody (1:50, crossreactivity with IdU) and detected with anti-mouse CY3 antibodies (1:200, Jackson Immuno-Research, West Grove, PA, USA). Then, the slides were incubated with rat anti-BrdU antibody (1:200; cross-reactivity with CldU) overnight at 4°C. Secondary anti-rat fluorescein isothiocyanate-conjugated antibodies (1:200; Jackson ImmunoResearch) were applied for 1 h at room temperature. All slices were counterstained with 4′,6′-diamidino-2-phenylindole (Vector Laboratories, Burlingame, CA, USA).
For triple immunofluorescent staining with CldU, IdU and DCX, or glial fibrillary acidic protein, frozen coronal sections (40 μm) from protocol 2 were only used, since CIdU+ cells are Q population in this group. Slices were stained with antibodies against CldU and IdU as mentioned above. Then, sections were incubated with primary antibodies against DCX or glial fibrillary acidic protein and CY5-conjugated secondary antibodies against guinea-pig or rabbit (1:50; Jackson ImmunoResearch) for 1 h at room temperature.
Terminal deoxynucleotidyl transferase-mediated biotinylated UTP nick end labeling (TUNEL) was performed using the Apoptosis Detection Kit (ApopTag; Chemicon International, Temecula, NY, USA) according to the manufacturer's protocol.
Image Acquisition, Quantification of Immunoreactive Cells, and Measurement of Ischemic Lesion Area
For analysis of CldU- and IdU-positive cells, every 40th immunostained coronal section at the level of AP + 10.6 mm and AP + 9.2 mm (Paxinos and Watson, 1986) of each rat was digitized under a × 60 objective (Zeiss Axiovert fluorescent microscope, One Zeiss Drive, Thornwood, NY, USA) via the MCID computer imaging analysis system (Imaging Research, St Catharines, Canada). CldU-, IdU-, and 4′,6′-diamidino-2-phenylindole-labeled cells along the SVZ of the lateral ventricular wall were counted. BrdU-labeled and -unlabeled cells in each SVZ coronal section are presented as the number of the cells per section. Density for the four sections per rat was averaged to obtain a mean density value for each brain according to published methods (Kuhn et al, 1996; Zhang et al, 2001) Using this method, we counted the number of BrdU cells in the SVZ and the dentate gyrus. The results are comparable to the number obtained from the stereology method (Kuhn et al, 1996; Zhang et al, 2001). Focal cerebral ischemia results in cavitations in the ipsilateral hemisphere, which precludes cutting accurate thickness of vibratome sections. Therefore, the stereology method was not used in this study.
A Neuronogenetic Model
To determine daughter cell fate, we adapted a neurono-genetic model developed by Takahashi et al (1996). Cell division is `symmetric' when both daughter cells are either P or Q, or `asymmetric' when one daughter cell is Q and one is P (Takahashi et al, 1996). With an assumption that the cells of Q or P obey a binomial distribution, Takahashi et al (1996) propose that the probability of the same fate daughter cells will be P × P (P&P symmetric) or Q × Q (Q&Q symmetric); and the probability of asymmetric daughter cells will be 2 × P × Q (Takahashi et al, 1996). We plotted P and Q fractions after stroke.
Statistical Analysis
Concurrent linear regressions were considered through the least-square iteration process (Lu et al, 2006) with the estimated cell-cycle parameters of GF, TC, Ts for each stroke onset. The length of G1 can be estimated based on TC-S and TG2+M from both the cumulative- and single pulse-labeling experiments, where we assume stable lengths in TG2+M for rats with various stroke onsets, given no TG2+M differences among 7-day stroke, non-stroke (Lu et al, 2006), and 2 days stroke (data were not shown). Two-sample Z-tests were used to compare the cycle parameter difference between the two groups.
A one-way analysis of variance was used to compare P/Q fraction or the proliferative fate difference among the stroke groups. Generalized estimating equations were considered to analyze correlated measures (in sections) per rat. Analysis first tested for the group effect and followed by pairwise group comparison if the group effect was detected at the level of 0.05.
All data are presented as mean±s.d. and statistical significance was set at P < 0.05.
Results
Stroke Induces Dynamic Changes of Cell-Cycle Kinetics of Neural Progenitor Cells
We previously demonstrated that 7 days after stroke, the population of proliferating SVZ cells defined by the growth fraction (GF) was substantially increased, whereas the length of cell cycle was decreased (Zhang et al, 2006). To examine the temporal profile of the proliferating population and the length of cell cycle, we employed BrdU-labeling protocols to measure the GF and the length of cell cycle of SVZ cells 2, 4, and 14 days after stroke, which cover a major period of stroke-induced neurogenesis in this model (Zhang et al, 2001, 2004a, b, 2006). Data of the 7-day time point were obtained from historical measurements of the GF and the cell cycle, a part of which has been published (Zhang et al, 2006). Stroke significantly increased the GF of SVZ cells, starting 2 days and reached the maximum 4 and 7 days after stroke (Figure 1, Table 1). Fourteen days after stroke, the GF reduced to the level observed 2 days after stroke (Figure 1, Table 1). The length of the cell cycle was substantially shortened 2, 4, and 7 days after stroke with the shortest cell cycle 2 days after stroke (Table 1). The length of the cell cycle returned to that of the non-stroke level 14 days after stroke (Figure 1, Table 1). Changes of the GF were concurrent with alterations of the length of the cell cycle and the length of the G1 phase (Table 1). Consistent with previous findings (Zhang et al, 2006), few SVZ cells were TUNEL-positive (1.01±0.44%, 0.98±0.17%, 1.02± 0.16, 1.01±0.44, and 1.04±0.27 in non-stroke, 2, 4, 7, and 14 days after stroke, respectively. These data indicate that stroke induces dynamic changes of cell-cycle kinetics of SVZ neural progenitor cells.
Table 1.
Summary of the SVZ growth fraction, cell-cycle phase durations, and experimental interval
| Stroke (days) | GF (%) | Tc-Ts (h) | Tc (h) | TG1 (h) | TG2+M (h) | Experimental interval (h) |
|---|---|---|---|---|---|---|
| Nonstroke | 20 | 14.4 | 19 | 12.6 | 1.79 | 16 |
| 2 | 23.6* | 9.2* | 11.5* | 7.5* | 1.79 | 11 |
| 4 | 30*,# | 10.1*,# | 12.5*,# | 8.3*,# | 1.80 | 11 |
| 7 | 31.*,# | 11.4*,# | 15.3*,# | 9.6*,# | 1.78 | 13 |
| 14 | 24 | 14.9# | 19.7# | 13# | 1.79 | 16 |
IdU, 5-iodo-2′-deoxyuridine; SVZ, subventricular zone.
P<0.05 compared with rats without stroke.
P<0.05 compared with 2 days after stroke.
Experimental interval indicates a perfuse time after initial IdU injection.
Stroke Alters P and Q Fractions of Neural Progenitor Cells
After acquiring data of cell-cycle kinetics (Table 1), we performed CldU- and IdU-labeling protocols (see the Materials and methods section) in normal rats and in rats subjected to 2, 4, 7, and 14 days of stroke. These protocols determine the number of cells in the Q + P fractions (protocol 1), that is cells that exit (Q fraction of postmitotic cells) and remain in the cell cycle (P fraction of proliferative cells), and determine the number of Q fraction cells (protocol 2). In protocol 1, rats were administered CldU at 0800 hours and CldU labeled the cells in S phase. Two hours later at 1000 hours, these rats were injected IdU and were killed at a time which was later than the duration of the cell cycle minus the duration of S phase (Table 1). This labeling protocol resulted in three types of labeled cells: (1) cells that were labeled only with CldU represented cells that left the S phase during the 2 h interinjection interval but remained or left the cell cycle during the interval between injection of IdU and perfuse time (Figure 2A, green); (2) cells that were labeled only with IdU were cells that entered the S phase during the 2 h interinjection interval (Figure 2A, red); and (3) cells that remained in the S phase during the interval were labeled with CldU and IdU (Figure 2A, yellow). In protocol 2, rats were injected with additional IdU within a time which was longer than that the duration of the cell cycle minus the duration of S phase (Takahashi et al, 1996). Therefore, if CldU-labeled cells re-entered the S phase, these cells were also labeled with IdU (Figure 2B, yellow). Cells only labeled with CldU but not IdU represented the number of cells that exit the cell cycle (Q fraction, Figure 2B, green). The Q fraction of the SVZ, that is the fraction of cells exiting the cell cycle, for each experimental data, is NQ/NQ + P. The distribution of P cells was obtained by taking the difference between the number of P + Q cells and the number of Q cells (Takahashi et al, 1996). We found that the cells of the P + Q fraction were widely distributed throughout the SVZ in stroke animals (Figure 3). Consistent with a published study (Takahashi et al, 1996) and our experimental design of survival time (Table 1), mitosis was not found in any of the P + Q fraction cells. Table 2 lists the estimates of Q and P fractions for the proliferative population in the entire SVZ. In non-stroke SVZ, Q and P fractions were 0.85 and 0.15, respectively (Table 2). However, stroke induces dynamic changes of Q and P fractions. Two days after stroke, the Q fraction substantially decreased to 0.30, whereas the P fraction increased to 0.70 (Table 2, Figure 3E), suggesting that the majority of SVZ progenitor cells are within the cell cycle. After that, the Q fraction continuously increased and reached 0.69 at 14 days after stroke (Table 2, Figure 3E), suggesting that increased numbers of neural progenitor cells leave the cell cycle. A value of 0.54 was detected 7 days after stroke (Figure 3E), suggesting that 7 days after stroke is the critical time point that signals the shift from neural progenitor expansion to augmentation of neuron production. To examine whether cells that left the cell cycle have a neuronal phenotype, we performed triple immunofluorescent staining with antibodies against CldU, IdU, and DCX in rats subjected to dual S-phase labeling with protocol 2. We found that 86±18.6% (n = 3), 90±10.9% (n = 4), 88±11.1% (n = 4), and 92±9.7% (n = 4) of CIdU+ cells were DCX+ at 2, 4, 7, and 14 days after stroke, respectively (Figure 4). There was no statistically significant difference among these groups. As CIdU+ cells represented cells that left the cell cycle and DCX is a marker of neuroblasts, these data indicate that approximately 90% of cells that exit the cell cycle differentiate into neurons. We also counted the number of DCX-, CldU-, and IdU-positive cells and found that 13.89% (n = 3), 12.5% (n = 4), 13.6% (n = 4), and 18.3% (n = 4) of double labeled with CldU and IdU cells were DCX+ at 2, 4, 7, and 14 days after stroke, respectively. These data suggest that a sub-population of migrating neuroblasts is within the cell cycle, which is consistent with previous findings that migrating neuroblasts proliferate (Menezes et al, 1995; Luskin et al, 1997; Wichterle et al, 1997; Zhang et al, 2007a).
Figure 2.
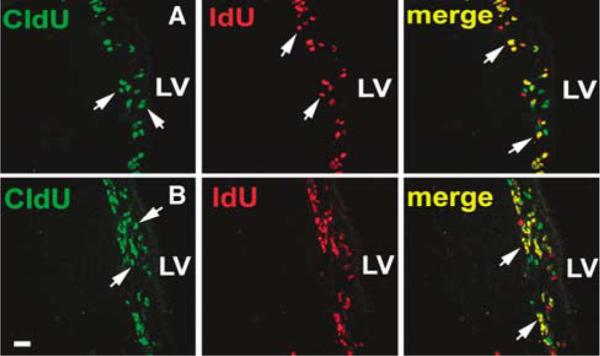
CldU- and IdU-positive cells in the SVZ were used for determining the combined Q + P fractions (protocol 1) and the Q fraction (protocol 2). (A and B) CldU- and ldU-positive SVZ cells in rats after the protocol 1 and 2 labeling, respectively. (A) CldU-positive cells (green, arrows) indicate cells that remained or left the cell cycle (P + Q fractions, NP+Q) during the interval between injection of IdU and killing time. (A) IdU-positive cells (red, arrows) represent cells that entered S phase during 2 h interinjection interval. (A) CldU- and IdU-positive cells (yellow, arrows) are cells that remained in the S phase during the interval. In (B) protocol 2, rats were injected with additional IdU within a time, which was longer than that the duration of the cell cycle minus the duration of S phase. Therefore, (B) CldU-positive cells (green, arrows) are cells that exit the cell cycle (Q fraction, NQ), whereas (B) CldU- and IdU-positive cells (yellow, arrows) are cells that re-entered the S phase. Images were acquired from representative rats without stroke. Bar = 20 μm. LV, lateral ventricle.
Figure 3.

CldU- and IdU-positive cells are evenly distributed in the expanded SVZ. (A) An increase in the number of CldU-(green) and IdU-(red) positive cells increased in the SVZ 7 days after (A) stroke compared with the number in the SVZ of (B) non-stroke rat. The area of the ipsilateral SVZ expanded 7 days after (C) stroke compared with the area of the SVZ in (D) non-stroke rat. (E) Changes of P and Q fractions over a period of 2 to 14 days after stroke. Bar = 100 μm. CC, corpus callosum; LV, lateral ventricle and Str., striatum.
Table 2.
Estimate of Q and P fractions
| 1 Stroke (days) | 2 NQ+P | 3 NQ | 4 Q | 5 P |
|---|---|---|---|---|
| Nonstroke | 11.5 | 9.6 | 0.85 | 0.15 |
| 2 | 14.9 | 4.45 | 0.30 | 0.70 |
| 4 | 19.4* | 8.5* | 0.44* | 0.56* |
| 7 | 19.6* | 10.8* | 0.54* | 0.46* |
| 14 | 13.5 | 9.17* | 0.69* | 0.31* |
The number of cells in the P and Q fractions (NQ+P) (column 2) was estimated by labeling protocol 1 and the number of cells in Q fraction alone (NQ) (column 3) was estimated by labeling protocol 2. The Q fraction (column 4) was obtained by NQ/NQ+P, in which values in column 3 were divided by those in column 2. The P fraction (column 5) was calculated with 1-Q.
P<0.05 compared 2 days after stroke.
Figure 4.
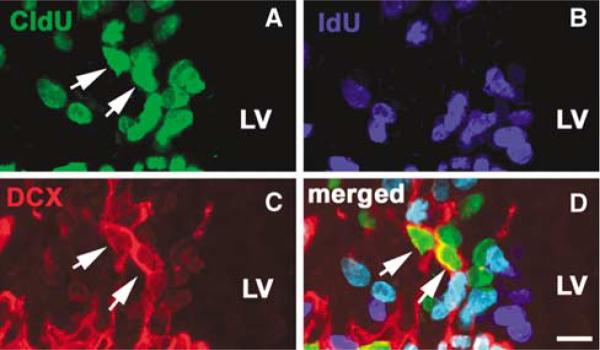
Cells that exited the cell cycle exhibit the neuronal phenotype. Microscopic images of triple immunofluorescent staining were obtained from a representative rat subjected to dual S-phase labeling with protocol 2 at 14 days after stroke. (A and D) CldU-positive cells (arrows) were (C and D) DCX-positive (arrows) but not (B) IdU-positive. Bar = 10 μm. LV, lateral ventricle.
Proliferating Neural Progenitor Cells Switch from Symmetric Proliferation (P + P) to Symmetric Presence of the Cell Cycle (Q + Q) During 2 to 14 Days after Stroke
By applying the neurogenetic model developed by Takahashi et al (1996), we predicted cell proliferative fate in which a cell division could be symmetric, that is, both daughter cells either leave (Q+ Q) or stay in the cell cycle (P + P), or asymmetric, with one daughter cell exiting the cell cycle (Q) and one that further divides (P) (Takahashi et al, 1996; Koutmani et al, 2004). Assuming that the cells of Q or P obey a binomial distribution, the probability of the same fate daughter cells will be P×P (P+P symmetric) or Q×Q (Q+Q symmetric); and the probability of asymmetric daughter cells will be 2×P×Q. Two days after stroke, 48% cells were P + P symmetric and only 10% cells were Q+Q symmetric, suggesting that the majority of cells are proliferating (Table 3, Figure 5). However, the percentage of (P + P)-symmetric cells decreased over a period of 4 to 14 days of stroke, concurrent with increases of the (Q+Q)-symmetric population (Table 3, Figure 5). By 14 days after stroke, only 11% cells were P + P symmetric, whereas 48% cells were Q+Q symmetric (Table 3, Figure 5), suggesting that many dividing cells leave the cell cycle. The percentages of asymmetric division cells (P +Q) were 42, 48, 47, and 41% at 2, 4, 7, and 14 days after stroke, respectively (Table 3, Figure 5).
Table 3.
Cell leaving and proliferative fates in the SVZ after stroke
| Nonstroke | 2 days | 4 days | 7 days | 14 days | |
|---|---|---|---|---|---|
| Symmetric PP | 0.03 | 0.48 | 0.32* | 0.23* | 0.11* |
| Symmetric QQ | 0.74 | 0.10 | 0.20* | 0.30* | 0.48* |
| Asymmetric cells | 0.22 | 0.42 | 0.48 | 0.47 | 0.41 |
SVZ, subventricular zone.
With an assumption that the cells of Q or P obey a binomial distribution, the probability of the same fate daughter cells will be P × P (P&P symmetric) or Q × Q (Q&Q symmetric); and the probability of asymmetric daughter cells will be 2 × P × Q (Takahashi et al, 1996). P<0.05 compared 2 days after stroke.
Figure 5.
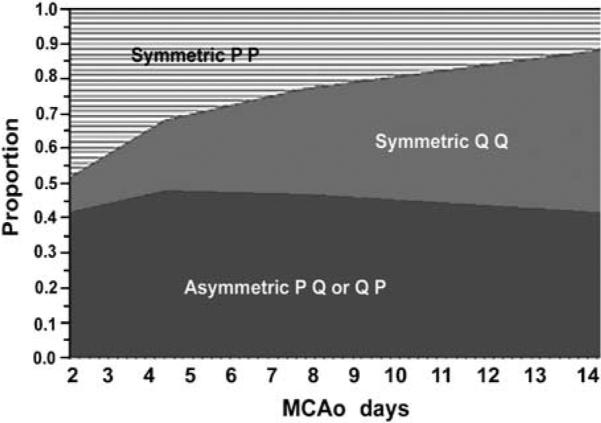
P and Q in relation to proliferative fate predicted by the mathematical model over a period of 2 to 14 days after stroke.
To test whether increased (Q+Q)-symmetric population as predicted above has a neuronal phenotype during 2 to 14 days after stroke, we performed double immunofluorescent staining with antibodies against HH3 and DCX. HH3 expression is confined to cells in G2 to early telophase of the cell cycle (Hendzel et al, 1997). HH3+ cells in the mitotic telophase were counted because only at this stage dividing cells exhibit the pair feature (Hendzel et al, 1997; Lu et al, 2006; Zhang et al, 2007b). As expected, the number of telophase HH3+ cells in the ipsilateral SVZ increased 2 days after stroke, peaked at 7 days after stroke, and then decreased but still increased compared with the number in non-stroke SVZ (Figure 6), which is consistent with our previous findings obtained by counting the number of total HH3+ cells (Zhang et al, 2004a). However, the number of HH3+ pairs with DCX+ continuously increased over a period of 2 (9±4.5%) to 14 days (26 ±7.8%) after stroke (Figure 6), suggesting increases of symmetrical neuronal differentiation. Concurrently, the length of the G1 phase increased 5.5 h from 7.5 h 2 days to 13 h 14 days after stroke (Table 1).
Figure 6.
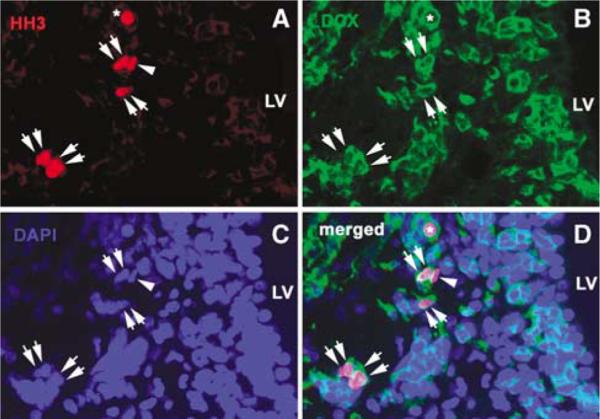
Dividing daughter cells exhibit neuronal phenotype. (A and D) Telophase HH3+ cells in the ipsilateral SVZ (red, double arrows) were (B and D) DCX+ (green, arrows). An arrowhead in A indicates that a dividing HH3+ cell was not (D) DCX+ (arrowhead). (C) 4′,6′-Diamidino-2-phenylindole staining revealed that HH3+ cells were in telophase of the cell cycle (double arrows). An asterisk in A, B, and D shows a HH3+ cell that was not counted because it was not in telophase. Bar = 20 μm. LV, lateral ventricle.
Discussion
This study shows that the cell-cycle length of SVZ neural progenitors concurrent with the G1 phase dynamically changed over a period of 2 to 14 days after stroke, with the shortest length being 11 h at 2 days after stroke. In addition, during this period, reduction of the cell cycle was concomitant with increases of the proportion of daughter cells that remained in the cell cycle (P fraction), whereas increases in the population of daughter cells that leave the cell cycle (Q fraction) were associated with lengthening of the cell cycle and the G1 phase. Furthermore, the population of a pair of dividing daughter cells with a neuronal marker increased from 9% at 2 days to 26% at 14 days after stroke. These data suggest that stroke triggers early expansion of the SVZ neural progenitor pool via shortening the cell-cycle length and retaining daughter cells within the cell cycle, and that lengthening the cell cycle and the G1 phase leads to daughter cells exiting the cell cycle and differentiating into neurons.
This study demonstrates a dynamic correlation of the cell-cycle kinetics to the proportion of daughter cells that remain and leave the cell cycle over a period of 2 to 14 days after stroke. Two to four days after stroke, the cell-cycle length is substantially reduced while the P fraction is dramatically increased to 0.7, indicating that many daughter cells remain within the cell cycle, which augments the pool of neural progenitor cells in the SVZ. This finding supports previous observations of a rapid expansion of the SVZ cells early after stroke (Zhang et al, 2007b). However, the cell-cycle length increased and by 14 days after stroke reached the length of non-stroke progenitor cells. In parallel, the Q fraction increased to ~0.7 while the P fraction decreased, indicating the many daughter cells exit the cell cycle. Triple immunofluorescent staining revealed that approximately 90% of cells that exit the cell cycle differentiate into neurons, which is consistent with published studies that an increase in new neuron population peaked at 7 to 14 days of stroke (Zhang et al, 2001; Arvidsson et al, 2002; Jin et al, 2003; Gotts and Chesselet, 2005; Carmichael, 2006; Yamashita et al, 2006). A recent study shows that stroke induces a second peak of neurogenesis 16 weeks after stroke (Thored et al, 2006). How the cell-cycle changes are involved in this peak of neurogenesis remains to be determined. The cell-cycle length is associated with neural progenitor cell progression from proliferation to neurogenic divisions during cortical neurogenesis (Takahashi et al, 1996; Calegari et al, 2005; Huttner and Kosodo, 2005). Neuron output from the pseudostratified ventricular epithelium is primarily dependent on the proportion of cells that exits the cell cycle (Caviness et al, 1995). Collectively, these data suggest that early in stroke-induced neurogenesis, neural progenitor cells primarily expand a pool of neural progenitor cells while more new neurons are produced in the later phase of the neurogenesis.
The lengthening of the cell cycle, in particular the G1 phase, promotes neural progenitor cell differentiation into neurons during embryonic development (Caviness et al, 1999; Hodge et al, 2004). This study shows that alteration of the G1 phase is the most likely contributor to the stroke-induced change of the cell-cycle length because the lengths of S, G2, and M phases were not changed over a period of 2 to 14 days of stroke. An increase in the length of the G1 phase from 2 to 14 days after stroke was concurrent with augmentation of progenitor cells that exit the cell cycle and differentiate into neurons. Our findings are consistent with previous studies showing that lengthening the G1 phase of the neuroepthelial cell cycle can trigger neuronal differentiation (Calegari et al, 2005; Gotz and Huttner, 2005). Using cumulative BrdU labeling of TIS21-green fluorescent protein, which is selectively expressed in neurogenic but not in proliferating neuroepthelial, knock-in mice, Calegari et al (2005) show that neurogenic progenitor cells have a significantly longer G1 phase of the cell cycle than the proliferating neuroepthelial cells. Thus, we speculate that the lengthening of the G1 phase of the cell cycle over 2 to 14 days after stroke may represent a switching of an actively proliferating type C cell population to type A neuroblast cell population, although it has not been shown whether type C cells have a different cell cycle from type A cells (Calegari et al, 2005).
Using the neurogenetic model, Takahashi et al (1996) determine the proliferative fate, showing that the (P + P)-symmetric cell divisions are dominant early in the cortical neurogenesis period, whereas the (Q + Q)-symmetric cell divisions predominate during late neurogenesis. Adapting this mathematic model, we found that stroke induces switching from the (P + P)-symmetric cell divisions (0.48) 2 days after stroke to the (Q + Q)-symmetric cell divisions (0.48) 14 days after stroke, with a critical turning point 7 days after stroke which signals the shift from neural progenitor expansion to augmentation of neuron production. This prediction is consistent with our previous findings that the peak of neural progenitor cell proliferation occurred 7 days after stroke, whereas a maximum increase in neuroblasts was detected 14 days after stroke (Zhang et al, 2004b). Immunofluorescent data in this study showed that approximately 90% of cells that exit the cell cycle were DCX+ and a substantial increase in the number of pair HH3+ and DCX+ cells were found 7 and 14 days after stroke. These observations suggest that the (Q + Q)-symmetric cell divisions lead to symmetric neuronal differentiation. Together, these data suggest that stroke triggers SVZ neural progenitor cells in the adult rat to recapture daughter cell proliferative fate observed in embryonic neural progenitor cells.
The adult rodent SVZ contains a heterogeneous population of cells (Doetsch et al, 1997). Actively proliferating progenitor cells (type A and C cells) constitute 34%, whereas relatively quiescent neural stem cells with a cell cycle of approximately 15 days (type B cells) are approximately 2% of the total population of SVZ cells (Morshead et al, 1994; Doetsch et al, 1997). During embryonic development, neuroepthelial cells that undergo neuron-generating divisions have a higher growth fraction than cells that undergo proliferactive divisions (Calegari et al, 2005). However, the difference is minor (only 0.04%) between two groups. This study shows that stroke substantially increased the growth fraction (50%, Table 1). Furthermore, we have previously shown that cells that migrate out of the SVZ do not affect estimation of cell kinetics (Lu et al, 2006), Therefore, cell-cycle parameters estimated with double nucleoside analog-labeling scheme protocols used in this study likely represent actively proliferating progenitor cells. However, it is possible that CldU or IdU labels a new cell population long after the injection, because the time period for which CldU or IdU labels cells after the injection is not known. By analysis of growth fraction and cell-cycle phases of SVZ neural progenitor cells 7 days after stroke, we have previously shown that the stroke-increased proliferating progenitor cell population is regulated by shortening the length of the cell cycle, decreasing the G1 phase, and increasing cell cycle re-entry (Zhang et al, 2006). This study confirms and extends these findings by showing dynamic changes of growth fraction, cell-cycle length, and the G1 phase over a period of 2 to 14 days after stroke. More importantly, this study shows that stroke triggers changes of the proportion of daughter cells that stay and leave the cell cycle (P and Q fractions). Consistent with previous findings (Zhang et al, 2006), we did not observe an increase in the number of TUNEL-positive cells in the SVZ over this period compared with the number in rats without stroke, indicating that cell death does not affect the measurement of cell-cycle parameters. In addition, ischemic lesion volume in this model is not significantly different over a period of 2 to 14 days after stroke (Zhang et al, 2001), which rules out the effect of the ischemic lesion on cell-cycle parameters. During embryonic days 11 to 17 (E11 to E17), growth fraction (GF), cell-cycle length (Tc), and P and Q fractions are important parameters to control cortical neurogenesis (Takahashi et al, 1996). Our data suggest that these parameters are involved in stroke-induced neurogenesis in the adult rodent SVZ.
Supplementary Material
Acknowledgements
We appreciate Yier Toh, Qing-e Lu, and Yuping Yang for technical assistance.
This work was supported by NINDS Grants PO1 NS23393, PO1 NS42345, RO1NS38292, and RO1HL 64766.
Footnotes
Supplementary Information accompanies the paper on the Journal of Cerebral Blood Flow & Metabolism website (http://www.nature.com/jcbfm)
References
- Arvidsson A, Collin T, Kirik D, Kokaia Z, Lindvall O. Neuronal replacement from endogenous precursors in the adult brain after stroke. Nat Med. 2002;8:963–70. doi: 10.1038/nm747. [DOI] [PubMed] [Google Scholar]
- Aten JA, Stap J, Hoebe R, Bakker PJ. Application and detection of IdUrd and CldUrd as two independent cell-cycle markers. Methods Cell Biol. 1994;41:317–26. [PubMed] [Google Scholar]
- Calegari F, Haubensak W, Haffner C, Huttner WB. Selective lengthening of the cell cycle in the neurogenic subpopulation of neural progenitor cells during mouse brain development. J Neurosci. 2005;25:6533–8. doi: 10.1523/JNEUROSCI.0778-05.2005. [DOI] [PMC free article] [PubMed] [Google Scholar]
- Carmichael ST. Cellular and molecular mechanisms of neural repair after stroke: making waves. Ann Neurol. 2006;59:735–42. doi: 10.1002/ana.20845. [DOI] [PubMed] [Google Scholar]
- Caviness VS, Jr, Takahashi T, Nowakowski RS. Numbers, time and neocortical neuronogenesis: a general developmental and evolutionary model. Trends Neurosci. 1995;18:379–83. doi: 10.1016/0166-2236(95)93933-o. [DOI] [PubMed] [Google Scholar]
- Caviness VS, Jr, Takahashi T, Nowakowski RS. The G1 restriction point as critical regulator of neocortical neuronogenesis. Neurochem Res. 1999;24:497–506. doi: 10.1023/a:1022579712262. [DOI] [PubMed] [Google Scholar]
- Doetsch F, Garcia-Verdugo JM, Alvarez-Buylla A. Cellular composition and three-dimensional organization of the subventricular germinal zone in the adult mammalian brain. J Neurosci. 1997;17:5046–61. doi: 10.1523/JNEUROSCI.17-13-05046.1997. [DOI] [PMC free article] [PubMed] [Google Scholar]
- Gotts JE, Chesselet MF. Migration and fate of newly born cells after focal cortical ischemia in adult rats. J Neurosci Res. 2005;80:160–71. doi: 10.1002/jnr.20434. [DOI] [PubMed] [Google Scholar]
- Gotz M, Huttner WB. The cell biology of neuro-genesis. Nat Rev Mol Cell Biol. 2005;6:777–88. doi: 10.1038/nrm1739. [DOI] [PubMed] [Google Scholar]
- Haydar TF, Kuan CY, Flavell RA, Rakic P. The role of cell death in regulating the size and shape of the mammalian forebrain. Cereb Cortex. 1999;9:621–6. doi: 10.1093/cercor/9.6.621. [DOI] [PubMed] [Google Scholar]
- Hendzel MJ, Wei Y, Mancini MA, Van Hooser A, Ranalli T, Brinkley BR, Bazett-Jones DP, Allis CD. Mitosis-specific phosphorylation of histone H3 initiates primarily within pericentromeric heterochromatin during G2 and spreads in an ordered fashion coincident with mitotic chromosome condensation. Chromosoma. 1997;106:348–60. doi: 10.1007/s004120050256. [DOI] [PubMed] [Google Scholar]
- Hodge RD, D'Ercole AJ, O'Kusky JR. Insulin-like growth factor-I accelerates the cell cycle by decreasing g1 phase length and increases cell cycle reentry in the embryonic cerebral cortex. J Neurosci. 2004;24:10201–10. doi: 10.1523/JNEUROSCI.3246-04.2004. [DOI] [PMC free article] [PubMed] [Google Scholar]
- Huttner WB, Kosodo Y. Symmetric versus asymmetric cell division during neurogenesis in the developing vertebrate central nervous system. Curr Opin Cell Biol. 2005;17:648–57. doi: 10.1016/j.ceb.2005.10.005. [DOI] [PubMed] [Google Scholar]
- Jin K, Sun Y, Xie L, Peel A, Mao XO, Batteur S, Greenberg DA. Directed migration of neuronal precursors into the ischemic cerebral cortex and striatum. Mol Cell Neurosci. 2003;24:171–89. doi: 10.1016/s1044-7431(03)00159-3. [DOI] [PubMed] [Google Scholar]
- Koutmani Y, Hurel C, Patsavoudi E, Hack M, Gotz M, Thomaidou D, Matsas R. BM88 is an early marker of proliferating precursor cells that will differentiate into the neuronal lineage. Eur J Neurosci. 2004;20:2509–23. doi: 10.1111/j.1460-9568.2004.03724.x. [DOI] [PubMed] [Google Scholar]
- Kuan CY, Schloemer AJ, Lu A, Burns KA, Weng WL, Williams MT, Strauss KI, Vorhees CV, Flavell RA, Davis RJ, Sharp FR, Rakic P. Hypoxia-ischemia induces DNA synthesis without cell proliferation in dying neurons in adult rodent brain. J Neurosci. 2004;24:10763–72. doi: 10.1523/JNEUROSCI.3883-04.2004. [DOI] [PMC free article] [PubMed] [Google Scholar]
- Kuhn HG, Dickinson-Anson H, Gage FH. Neurogenesis in the dentate gyrus of the adult rat: age-related decrease of neuronal progenitor proliferation. J Neurosci. 1996;16:2027–33. doi: 10.1523/JNEUROSCI.16-06-02027.1996. [DOI] [PMC free article] [PubMed] [Google Scholar]
- Lu M, Zhang RL, Zhang ZG, Yang JJ, Chopp M. Linkage of cell cycle kinetics between embryonic and adult stroke models: an analytical approach. J Neurosci Methods. 2006;161:323–30. doi: 10.1016/j.jneumeth.2006.10.021. [DOI] [PubMed] [Google Scholar]
- Luskin MB, Zigova T, Soteres BJ, Stewart RR. Neuronal progenitor cells derived from the anterior subventricular zone of the neonatal rat forebrain continue to proliferate in vitro and express a neuronal phenotype. Mol Cell Neurosci. 1997;8:351–66. doi: 10.1006/mcne.1996.0592. [DOI] [PubMed] [Google Scholar]
- Maslov AY, Barone TA, Plunkett RJ, Pruitt SC. Neural stem cell detection, characterization, and age-related changes in the subventricular zone of mice. J Neurosci. 2004;24:1726–33. doi: 10.1523/JNEUROSCI.4608-03.2004. [DOI] [PMC free article] [PubMed] [Google Scholar]
- McConnell SK. Constructing the cerebral cortex: neurogenesis and fate determination. Neuron. 1995;15:761–8. doi: 10.1016/0896-6273(95)90168-x. [DOI] [PubMed] [Google Scholar]
- Menezes JR, Smith CM, Nelson KC, Luskin MB. The division of neuronal progenitor cells during migration in the neonatal mammalian forebrain. Mol Cell Neurosci. 1995;6:496–508. doi: 10.1006/mcne.1995.0002. [DOI] [PubMed] [Google Scholar]
- Morshead CM, Craig CG, van der Kooy D. In vivo clonal analyses reveal the properties of endogenous neural stem cell proliferation in the adult mammalian forebrain. Development. 1998;125:2251–61. doi: 10.1242/dev.125.12.2251. [DOI] [PubMed] [Google Scholar]
- Morshead CM, Reynolds BA, Craig CG, McBurney MW, Staines WA, Morassutti D, Weiss S, van der Kooy D. Neural stem cells in the adult mammalian forebrain: a relatively quiescent subpopulation of subependymal cells. Neuron. 1994;13:1071–82. doi: 10.1016/0896-6273(94)90046-9. [DOI] [PubMed] [Google Scholar]
- Nowakowski RS, Lewin SB, Miller MW. Bromodeoxyuridine immunohistochemical determination of the lengths of the cell cycle and the DNA-synthetic phase for an anatomically defined population. J Neurocytol. 1989;18:311–8. doi: 10.1007/BF01190834. [DOI] [PubMed] [Google Scholar]
- Parent JM, Vexler ZS, Gong C, Derugin N, Ferriero DM. Rat forebrain neurogenesis and striatal neuron replacement after focal stroke. Ann Neurol. 2002;52:802–13. doi: 10.1002/ana.10393. [DOI] [PubMed] [Google Scholar]
- Paxinos G, Watson C. The rat brain in stereotaxic coordinates. 2nd ed. Academic Press Inc.; New York, NY: 1986. p. viii. [Google Scholar]
- Rakic P. A small step for the cell, a giant leap for mankind: a hypothesis of neocortical expansion during evolution. Trends Neurosci. 1995;18:383–8. doi: 10.1016/0166-2236(95)93934-p. [DOI] [PubMed] [Google Scholar]
- Takahashi T, Nowakowski RS, Caviness VS., Jr Cell cycle parameters and patterns of nuclear movement in the neocortical proliferative zone of the fetal mouse. J Neurosci. 1993;13:820–33. doi: 10.1523/JNEUROSCI.13-02-00820.1993. [DOI] [PMC free article] [PubMed] [Google Scholar]
- Takahashi T, Nowakowski RS, Caviness VS., Jr Mode of cell proliferation in the developing mouse neocortex. Proc Natl Acad Sci USA. 1994;91:375–9. doi: 10.1073/pnas.91.1.375. [DOI] [PMC free article] [PubMed] [Google Scholar]
- Takahashi T, Nowakowski RS, Caviness VS., Jr The leaving or Q fraction of the murine cerebral proliferative epithelium: a general model of neocortical neurono-genesis. J Neurosci. 1996;16:6183–96. doi: 10.1523/JNEUROSCI.16-19-06183.1996. [DOI] [PMC free article] [PubMed] [Google Scholar]
- Temple S. The development of neural stem cells. Nature. 2001;414:112–7. doi: 10.1038/35102174. [DOI] [PubMed] [Google Scholar]
- Temple S, Alvarez-Buylla A. Stem cells in the adult mammalian central nervous system. Curr Opin Neurobiol. 1999;9:135–41. doi: 10.1016/s0959-4388(99)80017-8. [DOI] [PubMed] [Google Scholar]
- Thored P, Arvidsson A, Cacci E, Ahlenius H, Kallur T, Darsalia V, Ekdahl CT, Kokaia Z, Lindvall O. Persistent production of neurons from adult brain stem cells during recovery after stroke. Stem Cells. 2006;24:739–47. doi: 10.1634/stemcells.2005-0281. [DOI] [PubMed] [Google Scholar]
- Wichterle H, Garcia-Verdugo JM, Alvarez-Buylla A. Direct evidence for homotypic, glia-independent neuronal migration. Neuron. 1997;18:779–91. doi: 10.1016/s0896-6273(00)80317-7. [DOI] [PubMed] [Google Scholar]
- Yamashita T, Ninomiya M, Hernandez Acosta P, Garcia-Verdugo JM, Sunabori T, Sakaguchi M, Adachi K, Kojima T, Hirota Y, Kawase T, Araki N, Abe K, Okano H, Sawamoto K. Subventricular zone-derived neuro-blasts migrate and differentiate into mature neurons in the post-stroke adult striatum. J Neurosci. 2006;26:6627–36. doi: 10.1523/JNEUROSCI.0149-06.2006. [DOI] [PMC free article] [PubMed] [Google Scholar]
- Zhang R, Zhang Z, Wang L, Wang Y, Gousev A, Zhang L, Ho KL, Morshead C, Chopp M. Activated neural stem cells contribute to stroke-induced neurogenesis and neuroblast migration toward the infarct boundary in adult rats. J Cereb Blood Flow Metab. 2004b;24:441–8. doi: 10.1097/00004647-200404000-00009. [DOI] [PubMed] [Google Scholar]
- Zhang R, Zhang Z, Zhang C, Zhang L, Robin A, Wang Y, Lu M, Chopp M. Stroke transiently increases subventricular zone cell division from asymmetric to symmetric and increases neuronal differentiation in the adult rat. J Neurosci. 2004a;24:5810–5. doi: 10.1523/JNEUROSCI.1109-04.2004. [DOI] [PMC free article] [PubMed] [Google Scholar]
- Zhang RL, Chopp M, Zhang ZG, Jiang Q, Ewing JR. A rat model of embolic focal cerebral ischemia. Brain Research. 1997;766:83–92. doi: 10.1016/s0006-8993(97)00580-5. [DOI] [PubMed] [Google Scholar]
- Zhang RL, LeTourneau Y, Gregg SR, Wang Y, Toh Y, Robin AM, Zhang ZG, Chopp M. Neuroblast division during migration toward the ischemic striatum: a study of dynamic migratory and proliferative characteristics of neuroblasts from the subventricular zone. J Neurosci. 2007a;27:3157–62. doi: 10.1523/JNEUROSCI.4969-06.2007. [DOI] [PMC free article] [PubMed] [Google Scholar]
- Zhang RL, Zhang ZG, Lu M, Wang Y, Yang JJ, Chopp M. Reduction of the cell cycle length by decreasing G1 phase and cell cycle reentry expand neuronal progenitor cells in the subventricular zone of adult rat after stroke. J Cereb Blood Flow Metab. 2006;26:857–63. doi: 10.1038/sj.jcbfm.9600237. [DOI] [PubMed] [Google Scholar]
- Zhang RL, Zhang ZG, Wang Y, Letourneau Y, Liu XS, Zhang X, Gregg SR, Wang L, Chopp M. Stroke induces ependymal cell transformation into radial glia in the subventricular zone of the adult rodent brain. J Cereb Blood Flow Metab. 2007b;27:1684–91. doi: 10.1038/sj.jcbfm.9600430. [DOI] [PubMed] [Google Scholar]
- Zhang RL, Zhang ZG, Zhang L, Chopp M. Proliferation and differentiation of progenitor cells in the cortex and the subventricular zone in the adult rat after focal cerebral ischemia. Neuroscience. 2001;105:33–41. doi: 10.1016/s0306-4522(01)00117-8. [DOI] [PubMed] [Google Scholar]
- Zink D, Cremer T, Saffrich R, Fischer R, Trendelenburg MF, Ansorge W, Stelzer EH. Structure and dynamics of human interphase chromosome territories in vivo. Hum Genet. 1998;102:241–51. doi: 10.1007/s004390050686. [DOI] [PubMed] [Google Scholar]
Associated Data
This section collects any data citations, data availability statements, or supplementary materials included in this article.