

Abstract
Background
Fibrinogen is a multifunctional circulating glycoprotein involved in wound-healing, thrombosis, platelet aggregation and inflammation, and elevated levels predict vascular disease. Despite evidence of such crucial biological functions and moderate heritability, comprehensive analysis of the influence of genetic variation on fibrinogen is not available.
Methods and Results
To address this issue, we undertook a genome-wide association study evaluating the potential relationships between 337,343 single nucleotide polymorphisms (SNPs) and plasma fibrinogen levels among 17,686 apparently healthy women participating in the Women’s Genome Health Study (WGHS). As C-reactive protein is also an inflammatory marker known to predict cardiovascular diseases, we compared the determinants of fibrinogen levels with those of C-reactive protein.
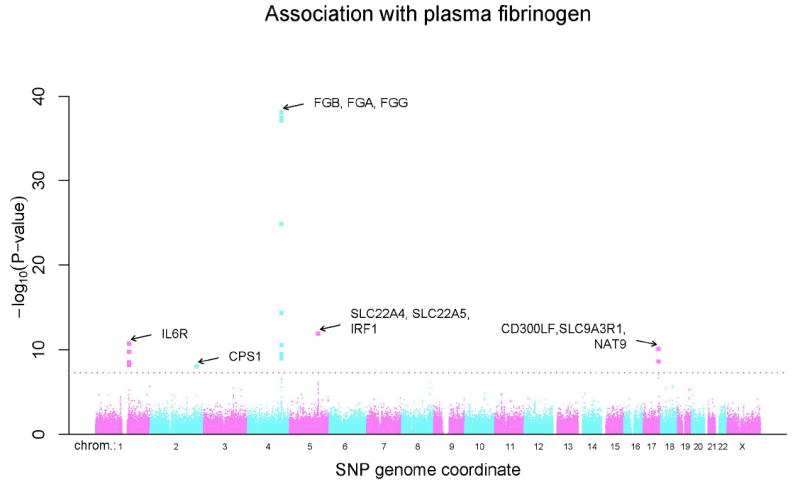
Four novel loci were identified, in addition to the fibrinogen gene cluster, which were associated with fibrinogen levels at genome-wide levels of significance (range of P-values from 8.82×10-09 to 8.04×10-39). Two of the loci related to common chronic inflammatory diseases: the first, at locus 5q31.1 (SLC22A5, SLC22A4, IRF1) lies immediately adjacent to a locus linked to Crohn’s disease (P-value for lead SNP 1.24 × 10⁻¹²) and the second, at locus 17q25.1 (CD300LF, SLC9A3R1, NAT9) has been associated with psoriasis (P-value for lead SNP 7.72×10⁻¹¹). A third locus at 1q21.3 (IL6R) lies within the interleukin 6 receptor gene, a critical component of the inflammatory cascade (P-value for lead SNP 1.80×10⁻¹¹). A novel locus at 2q34 (CPS1) participates in the urea cycle (P-value 8.82×10-09). The majority of implicated SNPs showed little evidence of dual association with C-reactive protein levels.
Conclusions
An agnostic survey of the human genome identifies novel loci related to common chronic inflammatory diseases as genetic determinants of fibrinogen levels, in addition to loci that relate to the inflammatory cascade, the urea cycle and the fibrinogen gene cluster.
Keywords: fibrinogen, genetics, inflammation, coagulation, women
Introduction
Fibrinogen is a circulating glycoprotein involved in wound-healing, thrombosis, platelet aggregation and inflammation which also has roles in cell adhesion, vasoconstriction, and chemotactic activity 1. Like the acute phase reactant C-reactive protein (CRP), plasma fibrinogen levels also associate with increased risk of myocardial infarction, stroke, and vascular mortality2,3, and these two inflammatory biomarkers may provide complementary information4. In addition to environmental factors that affect fibrinogen level, there is evidence of substantial heritability of fibrinogen (25-51%) in twin and family studies 5,6. To date, evaluations of genetic determinants of fibrinogen have typically used a candidate gene approach and focused on the FGA, FGB and FGG genes, which encode fibrinogen’s alpha, beta and gamma polypeptide chains. In these studies, variants within the promoter and genic regions of FGB have been associated with stable and acute phase fibrinogen levels7-9 as well as vascular events10,11. In aggregate, however, these polymorphisms explain only a small fraction of the estimated heritable effects on fibrinogen and the multi-functional nature of the protein itself suggests that other loci should have substantive effects. We therefore undertook a genome-wide association study evaluating potential relationships between 337,343 SNPs and plasma fibrinogen among 17,686 apparently healthy women participating in the Women’s Genome Health Study (WGHS)12. As C-reactive protein is also an inflammatory marker known to predict cardiovascular diseases, we also directly compared the determinants of fibrinogen levels with those of C-reactive protein13.
Methods
The study cohort was derived from participants of the Women’s Genome Health Study12, the genetic arm of the Women’s Health Study. In brief, participants in WGHS include American women with no prior history of cardiovascular disease, cancer, or other major chronic illness who provided a baseline blood sample during the enrollment phase of the Women’s Health Study between 1992 and 1995 as well as consent for blood based analyses related to the risk of incident chronic diseases. All baseline blood samples underwent ascertainment in a single core laboratory for fibrinogen levels using an immunoturbidimetric assay (Kamiya Biomedical, Seattle, Wash), which was standardized to a calibrator from the World Health Organization14. The coefficients of variation obtained from blinded simultaneously analyzed quality controls were <5% for fibrinogen. DNA extracted from the baseline blood samples underwent SNP genotyping using the Illumina Infinium II assay to query a genome-wide set of 315,176 haplotype-tagging SNP markers (Human HAP300 panel) as well as a focused panel of 45,882 missense and haplotype tagging SNPs selected to enhance coverage of genomic regions in which we had a strong a priori interest owing to presence of genes believed to be of relevance to metabolic, cardiovascular, and inflammatory diseases.
Before performing any genetic analyses, all SNPs were evaluated for high call rates (>90%) and the percentage of missing SNPs for each individual was calculated (<2%). For SNPs with adequate data, Hardy-Weinberg disequilibria (P>10-6) were evaluated to identify potential genotyping errors. In total, 337,343 SNPs passed criteria for use. We also compared the Illumina-based SNP data for each individual participant for a panel of 44 common SNPs that have previously been ascertained in this population using alternative genotyping technologies; this step is used as a secondary check to ensure accurate specimen labeling prior to any analyses.
For the purpose of this analysis, we limited our evaluation to 17,686 non-diabetic WGHS participants who were of Caucasian ancestry and were not taking lipid-lowering agents.
Because population stratification can result in inflated type I error in genome-wide association analysis, a principal component analysis using 1443 ancestry informative SNPs was performed using PLINK15 in order to confirm self-reported ancestry. Briefly, these SNPs were chosen based on a fixation index16 (Fst) > 0.4 in HapMap populations (YRB, CEU, CHB+JPT) and inter-SNP distance at least 500 kb in order to minimize linkage disequilibrium. Different ethnic groups were clearly distinguished with the two first components. Based on this analysis, 69 individuals were excluded from further evaluation as they did not cluster with other Caucasians, leaving 17,686 participants for the current study population. Two additional steps were taken to rule out the possibility that residual stratification within Caucasians was responsible for the associations observed. First, association analysis was done with correction by genomic control. Second, a principal component analysis17 was performed in previously identified Caucasians (only) using 64,208 SNPs chosen to have pair-wise linkage disequilibrium lower than r2=0.2. The first ten components were then used as covariates in the association analysis. As adjustment by these covariates did not change the conclusions, we present analysis among Caucasian participants without further correction for sub-Caucasian ancestry.
Analysis was performed to define any novel gene locus associated with fibrinogen levels. In all statistical analyses, we adjusted plasma levels of fibrinogen on an a priori basis for age, smoking, body mass index, hormone therapy, and menopausal status, the major environmental determinants of fibrinogen levels. For all genotype-phenotype association analyses, we assumed an additive model of inheritance and initially conducted univariable linear regression analyses to test the null hypothesis that fibrinogen levels did not differ by individual SNP genotypes (PLINK v1.03)15. To identify any clusters of SNPs that might be associated with fibrinogen levels, we used a genome-wide criterion of statistical significance of <5×10-08.
Once any locus with genome-wide significance was identified, a forward selection linear multiple regression model was used to further define the extent of the genetic association. Briefly, all genotyped SNPs within 100 kb of the most significantly associated SNP at each locus and passing quality control requirements were tested for possible incorporation into a multiple regression model. In stepwise fashion, a SNP was added to the model if it had the smallest P-value among all the SNPs not yet included in the model and if it was statistically significant after adjusting for multiple comparisons.
Subsequently, in models that included all SNPs that non-redundantly provided information on fibrinogen levels within a given loci, we used a similar multiple regression model to calculate the total proportion of variation in fibrinogen accounted for by the common SNPs evaluated.
Last, to address the hypothesis that plasma levels of fibrinogen and C-reactive protein have different genetic determinants, fibrinogen levels were regressed on SNPs of genome-wide significance for C-reactive protein, and CRP levels regressed on SNPs of genome-wide significance for fibrinogen in fully-adjusted models.
The study was approved by the institutional review committee at Brigham and Women’s Hospital and the subjects gave informed consent.
Results
Among the 17,686 women in this cohort, median fibrinogen levels were 350.6 mg/dL (range 29.1-1104.5 mg/dL). The distribution of P-values for the association of each individual SNP with plasma fibrinogen levels according to chromosomal position and number is shown in Figure 1, while Table 1 presents a listing of the genome-wide significant SNPs (P<5×10-08) and model-selected SNPs along with their beta coefficients, p-values and median levels of fibrinogen for homozygous carriers of the minor allele, heterozygotes and homozygous carriers of the major allele. Nineteen SNPs were individually associated with fibrinogen at a genome-wide level of significance and cluster in one of five chromosomal regions: 5 in chromosome locus 1q21.3 (IL6R), one in chromosome locus 2q34 (CPS1), 10 in chromosome locus 4q32.1 (the fibrinogen gene cluster), 1 in chromosome 5q31.1 (within or near genes of solute carrier family 22 (members 5 and 4)), and 2 in chromosome 17q25.1 (near genes SLC9A3R1 and NAT9, as well as a member of an immunoglobulin gene family, CD300LF; other members of this family in this region include CD300A, CD300LN, CD300C and CD300E). For four of the loci, effects of genotype on plasma fibrinogen level conform to an additive model. However, rs7422339 (CPS1) showed evidence (p=0.0002) for non-additive effects of the minor allele as judged by a likelihood ratio test comparing the additive regression model to an alternative genotype model with an additional degree of freedom. Specifically, the association for CPS1 tended toward a dominant genetic model, with median fibrinogen values of 354 mg/dL (N=8281) for major allele homozygotes, 348 mg/dL (N=7481) for heterozygotes and 349 mg/dL (N=1706) for minor allele homozygotes.
Figure 1.

The distribution of P-values for the association of individual SNPs with plasma fibrinogen levels according to chromosome number and position.
Table 1.
SNPs (beta-coefficients and P-value) associated with plasma fibrinogen levels in the Women’s Genome Health Study (WGHS) after adjustment for age, smoking status, body mass index, menopausal status and current hormone replacement therapy
| Median Fibrinogen level (mg/dL)e | Genome-wide Association Values | Non-redundant SNPs at each Locus (from model selection) | ||||||||||||
|---|---|---|---|---|---|---|---|---|---|---|---|---|---|---|
| Nearest Candidate Gene(s) | Loci | SNP | Positiona (bp) | Function | MAFb | HWc | A1-A2d | A1A1 | A1A2 | A2A2 | Beta | P-valuef | Beta | P-valueg |
| IL6R | 1q21.3 | rs6684439 | 152662463 | intron | 0.40 | 0.36 | G-A | 353 | 350 | 345 | -4.69 | 2.77×10-09 | ||
| rs4845623 | 152682401 | intron | 0.42 | 0.36 | A-G | 353 | 351 | 346 | -4.55 | 6.08×10-09 | ||||
| rs4537545 | 152685503 | intron | 0.41 | 0.20 | G-A | 353 | 351 | 345 | -5.01 | 1.66×10⁻¹⁰ | ||||
| rs4129267 | 152692888 | intron | 0.40 | 0.36 | G-A | 353 | 351 | 345 | -5.30 | 1.84×10⁻¹¹ | ||||
| rs8192284h | 152693594 | coding-nonsynonymous | 0.40 | 0.33 | A-C | 353 | 351 | 345 | -5.30 | 1.80×10⁻¹¹ | -5.44 | 6.57×10⁻¹² | ||
| CPS1 | 2q34 | rs7422339 | 211248752 | coding-nonsynonymous | 0.31 | 0.96 | C-A | 354 | 348 | 349 | -4.84 | 8.82×10-09 | -4.85 | 7.92×10-09 |
| FGB, FGA, FGG | 4q32.1 | rs1388070 | 155520388 | unknown | 0.35 | 0.80 | A-G | 347 | 352 | 356 | 5.12 | 3.23×10⁻¹⁰ | ||
| rs4482740 | 155665755 | unknown | 0.36 | 0.43 | G-A | 346 | 352 | 360 | 6.32 | 4.40×10⁻¹⁵ | ||||
| rs7654425 | 155676058 | unknown | 0.34 | 0.34 | A-G | 355 | 348 | 344 | -5.19 | 2.98×10⁻¹⁰ | ||||
| rs7698829 | 155680917 | intron | 0.14 | 1.00 | A-G | 352 | 348 | 339 | -7.00 | 6.39×10⁻¹⁰ | ||||
| rs1800790 | 155703158 | locusi | 0.21 | 0.04 | G-A | 345 | 358 | 370 | 12.31 | 2.91×10-38 | ||||
| rs6056 | 155708271 | coding-synonymous | 0.18 | 0.16 | G-A | 346 | 359 | 370 | 12.94 | 8.04×10-39 | 14.08 | 2.45×10-42 | ||
| rs4220 | 155711209 | coding-nonsynonymous | 0.18 | 0.15 | G-A | 346 | 359 | 370 | 12.79 | 6.65×10-38 | ||||
| rs1044291 | 155712802 | unknown | 0.34 | 0.56 | G-A | 355 | 348 | 344 | -5.47 | 2.76×10⁻¹¹ | ||||
| rs2070016 | 155729764 | intron | 0.15 | 0.19 | A-G | 347 | 358 | 365 | 11.23 | 1.29×10⁻²⁵ | ||||
| rs1049636 | 155745420 | intron | 0.30 | 0.11 | A-G | 352 | 350 | 345 | -5.19 | 9.95×10⁻¹⁰ | ||||
| rs1800788 | 155703364 | locus | 0.20 | 0.46 | G-A | 350* | 351* | 350* | 1.70 | 0.082* | 5.13 | 3.68×10-07 | ||
| SLC22A5, SLC22A4, IRF1 | 5q31.1 | rs1016988 | 131772473 | unknown | 0.20 | 0.65 | A-G | 354 | 346 | 338 | -6.84 | 1.24×10⁻¹² | -6.49 | 2.29×10⁻¹¹ |
| rs10479002 | 131699561 | coding-synonymous | 0.04 | 1 | G-C | 350* | 358* | 383* | 9.51 | 1.27×10-06* | 8.36 | 2.33×10-05 | ||
| CD300LF, SLC9A3R1, NAT9 | 17q25.1 | rs10512597 | 70211428 | intron | 0.18 | 0.07 | G-A | 352 | 347 | 341 | -6.45 | 7.72×10⁻¹¹ | -6.61 | 3.21×10⁻¹¹ |
| rs1037170 | 70214509 | intron | 0.27 | 0.59 | A-G | 352 | 349 | 345 | -5.22 | 2.29×10-09 | ||||
Table 1 Legend
These 2 SNPs were identified in forward selection models that include the other lead SNPs in bold. See text for details.
Based on NCBI Build 36.1
MAF: Minor allele frequency based on the combined samples.
HW: Deviation from Hardy-Weinberg equilibrium P-value based on the combined samples.
A1=major allele, A2=minor allele. A1A1=homozygotes for major allele. A1A2=heterozygotes. A2A2=homozygotes for minor allele
Crude median fibrinogen levels (mg/dL) observed among homozygous carriers of the major allele, heterozygotes and homozygous carriers of the minor allele for each selected SNP
SNPs of genome-wide significance with P <5×10-08 are shown for residuals of fibrinogen regressed on each SNP.
P-values from forward selection models are shown, after adjustment for age, smoking habit, body mass index, menopausal status and current hormone therapy.
We evaluated for inclusion in this selection model 139 SNPs distributed across the 5 loci. P-values <0.00036 were considered to correct for the total number of SNPs considered.
In bold are non-redundant SNPs in each of 5 loci that contribute to fibrinogen levels in forward selection model
Within 2kb of a gene
Abbreviations
IL6R = interleukin 6 receptor
CPS1 = carbamoyl phosphate synthetase I
FGB = fibrinogen, beta polypeptide chain
FGA = fibrinogen, alpha polypeptide chain
FGG = fibrinogen, gamma polypeptide chain
SLC22A5 = solute carrier family 22 (organic cation transporter), member 5
SLC22A4 = solute carrier family 22 (organic cation transporter), member 4
IRF1= interferon regulatory factor 1
CD300LF = immunoglobulin superfamily, member 13;
SLC9A3R1=solute carrier family 9, isoform A3, regulatory factor 1;
NAT9= a member of the N-acetyltransferase family
Also presented in Table 1 are the results of forward selection models that summarize evidence of nonredundant contributions to fibrinogen level for each of the five loci. At the IL6R, CPS1 and CD300LF loci, only one lead SNP was included by model selection (rs8192284, rs7422339 and rs10512597 respectively). Two SNPs were included at 4q32.1 (FGB, FGA, FGG; rs6056, rs1800788) and 5q31.1 (SLC22A5, SLC22A4, IRF1; rs1016988, rs10479002). The genetic contexts of the five loci are shown in Figure 2.
Figure 2.
Genetic Context of Loci with Genome-Wide Significant Associations with Fibrinogen Data are presented that map each SNP according to its physical location at each of the 5 loci, as well a plot of the P-values in relation to the distance from known recombination hotspots according to HapMap. Top panel: genes from RefSeq release 25 are shown. Only one isoform is shown when multiple splicing variants are known. Lower panel: SNPs are shown according to their physical location and P-values (red dots). Also shown is the genetic distance in cM from the lowest P-value SNP (light grey line) along with the position of recombination hotspots (light grey vertical bars). Recombination rates and hotspots are based on HapMap data, as described by McVean et al.32.
The IL6R region is shown in Figure 2-A, the CPS1 region in Figure 2-B, the fibrinogen gene cluster (4q32.1) in Figure 3-C, the SLC22A5, SLC22A4, IRF1 locus (5q31.1) in Figure 2-D and the CD300LF, SLC9A3R1, NAT9 locus in Figure 2-E.
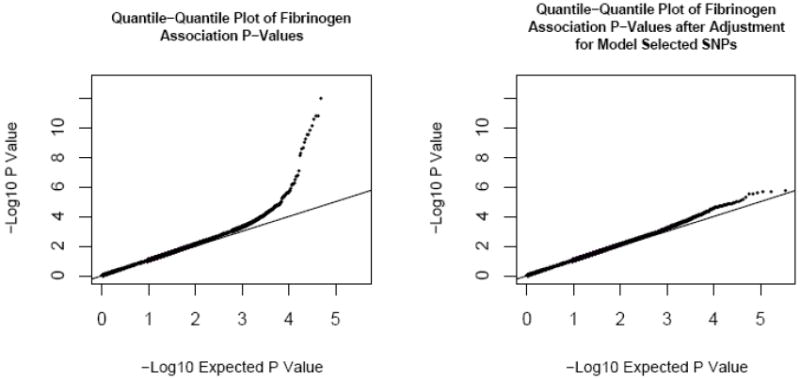
As shown in the quantile-quantile plots (Figure 3), p-values larger than 0.001 conform to the expected null distribution. The excess of p-values smaller than 0.001 was due largely to the associations of the candidate loci; after further adjustment of fibrinogen residuals by model-selected SNPs, there is a significant decrease in excess of small p-values in genome-wide association testing (Figure 3, right panel).
Figure 3.
Quantile-Quantile Plot of Actual and Expected P-Values for Association with Fibrinogen
Table 2 shows a comparison of phenotypic variance explained by independent genetic factors and clinical covariates. Of the genetic variance, which explained a total of 1.93% of the fibrinogen phenotype, 12.4% was attributable to polymorphism within the IL6R locus, 8.8% to the CPS1 locus, 50.3% to fibrinogen gene cluster, 17.6% to the 5q31.1 locus and 10.9% to the 17q25.1 locus. Clinical covariates (age, body mass index, smoking and hormone use) accounted for a significant proportion of the phenotypic variance (14.0%).
Table 2.
Proportion of Phenotypic Variance According to Individual Clinical and Genetic Covariates
| Category | Variable | Proportion of Variance Explained % (r2) | Proportion of Variance Explained by Category % (r2) |
|---|---|---|---|
| Clinical covariates | Age | 3.07 | 13.96 |
| BMI (in WHO categories) | 8.31 | ||
| Smoking status (current vs. other) | 1.37 | ||
| Menopausal Status | <0.001 | ||
| Hormone user | 1.21 | ||
| 1q21.3 (IL6R) Locus | rs8192284 | 0.24 | 0.24 |
| 2q34 (CPS1) Locus | rs7422339 | 0.17 | 0.17 |
| 4q32.1 (FGB, FGA, FGG) Locus | rs6056 | 0.84 | 0.97 |
| rs1800788 | 0.13 | ||
| 5q31.1 (SLC22A5, SLC22A4, IRF1) Locus | rs1016988 | 0.25 | 0.34 |
| rs10479002 | 0.09 | ||
| 17q25.1 (CD300LF, SLC9A3R1, NAT9) Locus | rs10512597 | 0.21 | 0.21 |
| TOTAL | 15.89 | ||
Replication of the SLC22A5/IRF1, the IL6R, and the known FGB findings are also provided in the accompanying manuscript from Dehghan et al (p-values1.01×10-13, 7.42×10-06 and 1.84×10⁻²⁷ respectively). With respect to CD300LF and CPS1, the Dehghan data also support replication, albeit at p-values of 0.001 and 0.01. Even after correction for the five loci tested, these remain significant with p-values ≤ 0.01, and consistent direction of effect.
Because fibrinogen and CRP levels correlate (r=0.4), we assessed the degree of overlap between genome-wide significant determinants of these inflammatory biomarkers. As shown in Table 3, of the genes related to fibrinogen, the IL6R SNP (rs8192284; p=1.04×10⁻²²) and the CD300LF SNP (rs10512597; p=9.85×10-04) were also associated with CRP levels. By contrast, of the genes related to CRP13, only the IL6R, GCKR (rs780094; p=0.002) and LEPR SNP (rs1892534, p=0.009) also showed evidence of association with fibrinogen.
Table 3.
Relationship of SNPs of Genome-Wide Significance to Fibrinogen with CRP Levels and Relationship of SNPs of Genome-Wide Significance to CRP with Fibrinogen Levels
| Nearest Candidate Gene(s) | SNPs | Association with Fibrinogen | Association with CRP* | ||
|---|---|---|---|---|---|
| Beta-Coefficient | P-value | Beta-Coefficient | P-value | ||
| Genes/SNPs Associated with Fibrinogen at Genome-wide Significance | |||||
| IL6R | rs8192284 | -5.299 | 1.80×10⁻¹¹ | -0.109 | 1.04×10⁻²² |
| CPS1 | rs7422339 | -4.843 | 8.82×10-09 | 0.004 | 0.750 |
| FGB, FGA, FGG | rs6056 | 12.940 | 8.04×10-39 | -0.002 | 0.867 |
| SLC22A5, SLC22A4, IRF1 | rs1016988 | -6.839 | 1.24×10⁻¹² | -0.022 | 0.112 |
| CD300LF, SLC9A3R1, NAT9 | rs10512597 | -6.450 | 7.72×10⁻¹¹ | -0.046 | 9.85×10-04 |
| Genes/SNPs Associated with CRP* at Genome-wide Significance | |||||
| IL6R | rs8192284 | -5.299 | 1.80×10⁻¹¹ | -0.109 | 1.04×10⁻²² |
| CRP | rs3091244 | -0.111 | 0.890 | 0.224 | 7.10×10-88 |
| LEPR | rs1892534 | -2.067 | 0.009 | -0.148 | 2.24×10-40 |
| GCKR | rs780094 | 2.410 | 0.002 | 0.131 | 2.74×10⁻³² |
| Gene Desert | rs10778213 | 1.998 | 0.010 | -0.089 | 3.75×10⁻¹⁶ |
| HNF1A | rs7310409 | -0.587 | 0.462 | -0.176 | 9.61×10-56 |
| APOE | rs769449 | -1.337 | 0.251 | -0.270 | 5.98×10-57 |
CRP was log-transformed
Abbreviations
CRP = C-reactive protein
LEPR = leptin receptor protein
GCKR = glucokinase regulatory protein
HNF1 = hepatic nuclear factor-1 (transcription factor 1, hepatic [TCF1])
APOE = apolipoprotein E
Discussion
In this genome-wide study of 337,343 polymorphisms among 17,686 women, four novel loci were associated with fibrinogen in addition to the known association with the fibrinogen gene cluster. Two of the novel loci relate to known human chronic inflammatory diseases but are genetically associated with fibrinogen levels for the first time, one to a critical component of the inflammatory cascade and one to the urea cycle.
The locus at 5q31.1 (SLC22A5, SLC22A4, IRF1) implicated in our study, and in the accompanying study by Dehghan et al, is immediately adjacent to a 250 kb locus that has previously been linked to Crohn’s disease and has been referred to as the IBD5 region18. Recent confirmation of the association of this locus with Crohn’s disease has emerged from the Wellcome Trust Consortium19. Because this region is rich in candidate genes and is characterized by extensive linkage disequilibrium, one cannot be certain of the causal variant or the underlying biological mechanism. Of note, candidate genes encompassed by this region include a cytokine gene cluster (IL5, IL4, IL13) as well as a regulator of interferon alpha production (IRF1) among others. Other genes in this region are SLC22A5 and SLC22A4, which are high affinity sodium-dependent uptake transporters that function in the transport of l-carnitine and in the elimination of cationic drugs in the intestine. Specific SNPs of these genes have been shown to affect transcriptional efficiency of SLC22A420, due to an allelic difference in affinity to runt-related transcription factor 1 (RUNX1)21. Preliminary data have also implicated this region to other diseases with autoimmune etiologies such as type I diabetes22.
The association at locus 17q25.1 is intronic to the CD300LF and RAB37 genes. CD300LF is a member of an immunoglobulin superfamily gene cluster that may serve as an inhibitory receptor to regulate the maturation and differentiation of immune cells, helping to contain inflammation23; RAB37 is a GTPase expressed in mast cells24. This locus has been associated with psoriasis, and is referred to as PSORS2 25,26. Particular focus has been on the nearby LD block which encompasses SLC9A3R1 and NAT9; a SNP that lies between the two genes may lead to loss of RUNX1 binding, a common theme for other inflammatory diseases such as rheumatoid arthritis and lupus27. This is however, to our knowledge, the first report of a relationship of this region to circulating fibrinogen levels.
The IL6R SNP, rs8192284, associated with fibrinogen is a non-synonymous SNP that is also associated with CRP13. The biological relevance of this SNP was supported by recent data from the Health ABC study, where the same missense SNP accounted for a significant percentage of variance of both soluble IL6R levels and plasma IL-6 levels28. IL-6 is an important upstream messenger cytokine in inflammation that changes the program of protein synthesis in the liver from “housekeeping” proteins, such as albumin, to a family of acute phase proteins made in the liver, such as CRP and fibrinogen. Our finding that polymorphism in the IL6R gene is a determinant of fibrinogen expression is consistent with data linking IL-6 to hepatic production of fibrinogen. These data support the close biological relationship between fibrinogen levels and IL-6, and is concordant with the reported relationship of IL-6 with incident diabetes and atherothrombosis29.
With regard the CPS1 SNP, rs7422339, carbamoylphosphate synthetase I is a mitochondrial matrix enzyme that catalyses the first and rate-limiting step of the hepatic urea cycle. The hepatic urea cycle is responsible for the elimination of ammonia in the form of urea as well as the synthesis of arginine, a precursor of the potent vasodilatator nitric oxide. Specifically, the CPS1 SNP rs7422339 associated with fibrinogen in our study encodes for the substitution of asparagine for threonine (T1405N) in the region critical for N-acetyl-glutamate binding and results in 20-30% higher enzymatic activity30. This variation has been shown to influence nitric oxide metabolite concentrations and vasodilation following agonist stimulation31, as well as the risk of veno-occlusive disease after bone marrow transplantation; such data may be concordant with data linking fibrinogen with vascular disease.
Last, the IL6R SNP (rs8192284), the GCKR SNP (rs780094) and SLC9A3R1 SNP (rs10512597) were related to both fibrinogen and CRP, suggesting they may be central regulators of inflammation. However, the majority of implicated SNPs showed little evidence of dual association, showing that fibrinogen and CRP may have different genetic architecture, even though both are predictive of vascular disease.
Conclusions
In aggregate, our genome-wide study identifies four novel loci related to fibrinogen, the 5q31.1 locus related to IBD, the 17q25.1 locus related to psoriasis, IL6R, a critical component of inflammation, and CPS1, all of which are replicated in the accompanying manuscript from Dehghan et al. We also confirm the fibrinogen gene cluster locus. These data identify new components of fibrinogen regulation, a glycoprotein with multiple critical functions in humans including clotting, thrombosis and inflammation. The link to regions of the genome associated with common human autoimmune diseases may provide further insights into their pathophysiology.
Acknowledgments
Funding Sources Supported by grants from the National Heart Lung and Blood Institute and the National Cancer Institute (Bethesda, MD), the Donald W Reynolds Foundation (Las Vegas, NV), the Doris Duke Charitable Foundation (New York, NY), and the Fondation Leducq (Paris, FR), with collaborative scientific support for genotyping provided by Amgen, Inc (Thousand Oaks, CA). J.S.D. receives support from the National Heart, Lung, and Blood Institute and the Michael Lerner Foundation. G.P. receives support by a Fond de la Recherche en Sante du Quebec scholarship. D.C receives support from the National Heart, Lung and Blood Institute.
Footnotes
Conflict of Interest Disclosures P.M.R. has also received grant support from Aztra-Zeneca, Novartis, Sanofi-Aventis, and is listed as a coinventor on patents held by the Brigham and Women’s Hospital that relate to the use of inflammatory biomarkers in cardiovascular disease. J.P.M reports holding equity in Amgen, Inc. J.S.D, G.P, D.C., R.Y.L.Z, D.J.K and A.P have no other conflicts to disclose.
References
- 1.Gabay C, Kushner I. Acute-phase proteins and other systemic responses to inflammation. N Engl J Med. 1999;340:448–54. doi: 10.1056/NEJM199902113400607. [DOI] [PubMed] [Google Scholar]
- 2.Kannel WB, Wolf PA, Castelli WP, D’Agostino RB. Fibrinogen and risk of cardiovascular disease. The Framingham Study. Jama. 1987;258:1183–6. [PubMed] [Google Scholar]
- 3.Danesh J, et al. Plasma fibrinogen level and the risk of major cardiovascular diseases and nonvascular mortality: an individual participant meta-analysis. Jama. 2005;294:1799–809. doi: 10.1001/jama.294.14.1799. [DOI] [PubMed] [Google Scholar]
- 4.Mora S, Rifai N, Buring JE, Ridker PM. Additive value of immunoassay-measured fibrinogen and high-sensitivity C-reactive protein levels for predicting incident cardiovascular events. Circulation. 2006;114:381–7. doi: 10.1161/CIRCULATIONAHA.106.634089. [DOI] [PubMed] [Google Scholar]
- 5.Hamsten A, Iselius L, de Faire U, Blomback M. Genetic and cultural inheritance of plasma fibrinogen concentration. Lancet. 1987;2:988–91. doi: 10.1016/s0140-6736(87)92557-8. [DOI] [PubMed] [Google Scholar]
- 6.Livshits G, Schettler G, Graff E, Blettner M, Wahrendorf J, Brunner D. Tel Aviv-Heidelberg three-generation offspring study: genetic determinants of plasma fibrinogen level. Am J Med Genet. 1996;63:509–17. doi: 10.1002/(SICI)1096-8628(19960628)63:4<509::AID-AJMG1>3.0.CO;2-J. [DOI] [PubMed] [Google Scholar]
- 7.Humphries SE, Cook M, Dubowitz M, Stirling Y, Meade TW. Role of genetic variation at the fibrinogen locus in determination of plasma fibrinogen concentrations. Lancet. 1987;1:1452–5. doi: 10.1016/s0140-6736(87)92205-7. [DOI] [PubMed] [Google Scholar]
- 8.van ’t Hooft FM, von Bahr SJ, Silveira A, Iliadou A, Eriksson P, Hamsten A. Two common, functional polymorphisms in the promoter region of the beta-fibrinogen gene contribute to regulation of plasma fibrinogen concentration. Arterioscler Thromb Vasc Biol. 1999;19:3063–70. doi: 10.1161/01.atv.19.12.3063. [DOI] [PubMed] [Google Scholar]
- 9.Kathiresan S, Yang Q, Larson MG, Camargo AL, Tofler GH, Hirschhorn JN, Gabriel SB, O’Donnell CJ. Common genetic variation in five thrombosis genes and relations to plasma hemostatic protein level and cardiovascular disease risk. Arterioscler Thromb Vasc Biol. 2006;26:1405–12. doi: 10.1161/01.ATV.0000222011.13026.25. [DOI] [PubMed] [Google Scholar]
- 10.Scarabin PY, Bara L, Ricard S, Poirier O, Cambou JP, Arveiler D, Luc G, Evans AE, Samama MM, Cambien F. Genetic variation at the beta-fibrinogen locus in relation to plasma fibrinogen concentrations and risk of myocardial infarction. The ECTIM Study. Arterioscler Thromb. 1993;13:886–91. doi: 10.1161/01.atv.13.6.886. [DOI] [PubMed] [Google Scholar]
- 11.Zito F, Di Castelnuovo A, Amore C, D’Orazio A, Donati MB, Iacoviello L. Bcl I polymorphism in the fibrinogen beta-chain gene is associated with the risk of familial myocardial infarction by increasing plasma fibrinogen levels. A case-control study in a sample of GISSI-2 patients. Arterioscler Thromb Vasc Biol. 1997;17:3489–94. doi: 10.1161/01.atv.17.12.3489. [DOI] [PubMed] [Google Scholar]
- 12.Ridker PM, Chasman DI, Zee RY, Parker A, Rose L, Cook NR, Buring JE. Rationale, design, and methodology of the Women’s Genome Health Study: a genome-wide association study of more than 25,000 initially healthy american women. Clin Chem. 2008;54:249–55. doi: 10.1373/clinchem.2007.099366. [DOI] [PubMed] [Google Scholar]
- 13.Ridker PM, Pare G, Parker A, Zee RY, Danik JS, Buring JE, Kwiatkowski D, Cook NR, Miletich JP, Chasman DI. Loci related to metabolic-syndrome pathways including LEPR, HNF1A, IL6R, and GCKR associate with plasma C-reactive protein: the Women’s Genome Health Study. Am J Hum Genet. 2008;82:1185–92. doi: 10.1016/j.ajhg.2008.03.015. [DOI] [PMC free article] [PubMed] [Google Scholar]
- 14.Whitton CM, Sands D, Hubbard AR, Gaffney PJ. A collaborative study to establish the 2nd International Standard for Fibrinogen, Plasma. Thromb Haemost. 2000;84:258–62. [PubMed] [Google Scholar]
- 15.Purcell S, Neale B, Todd-Brown K, Thomas L, Ferreira MA, Bender D, Maller J, Sklar P, de Bakker PI, Daly MJ, Sham PC. PLINK: a tool set for whole-genome association and population-based linkage analyses. Am J Hum Genet. 2007;81:559–75. doi: 10.1086/519795. [DOI] [PMC free article] [PubMed] [Google Scholar]
- 16.Hudson RR, Slatkin M, Maddison WP. Estimation of levels of gene flow from DNA sequence data. Genetics. 1992;132:583–9. doi: 10.1093/genetics/132.2.583. [DOI] [PMC free article] [PubMed] [Google Scholar]
- 17.Price AL, Patterson NJ, Plenge RM, Weinblatt ME, Shadick NA, Reich D. Principal components analysis corrects for stratification in genome-wide association studies. Nat Genet. 2006;38:904–9. doi: 10.1038/ng1847. [DOI] [PubMed] [Google Scholar]
- 18.Rioux JD, Daly MJ, Silverberg MS, Lindblad K, Steinhart H, Cohen Z, Delmonte T, Kocher K, Miller K, Guschwan S, Kulbokas EJ, O’Leary S, Winchester E, Dewar K, Green T, Stone V, Chow C, Cohen A, Langelier D, Lapointe G, Gaudet D, Faith J, Branco N, Bull SB, McLeod RS, Griffiths AM, Bitton A, Greenberg GR, Lander ES, Siminovitch KA, Hudson TJ. Genetic variation in the 5q31 cytokine gene cluster confers susceptibility to Crohn disease. Nat Genet. 2001;29:223–8. doi: 10.1038/ng1001-223. [DOI] [PubMed] [Google Scholar]
- 19.Genome-wide association study of 14,000 cases of seven common diseases and 3,000 shared controls. Nature. 2007;447:661–78. doi: 10.1038/nature05911. [DOI] [PMC free article] [PubMed] [Google Scholar]
- 20.Peltekova VD, Wintle RF, Rubin LA, Amos CI, Huang Q, Gu X, Newman B, Van Oene M, Cescon D, Greenberg G, Griffiths AM, St George-Hyslop PH, Siminovitch KA. Functional variants of OCTN cation transporter genes are associated with Crohn disease. Nat Genet. 2004;36:471–5. doi: 10.1038/ng1339. [DOI] [PubMed] [Google Scholar]
- 21.Tokuhiro S, Yamada R, Chang X, Suzuki A, Kochi Y, Sawada T, Suzuki M, Nagasaki M, Ohtsuki M, Ono M, Furukawa H, Nagashima M, Yoshino S, Mabuchi A, Sekine A, Saito S, Takahashi A, Tsunoda T, Nakamura Y, Yamamoto K. An intronic SNP in a RUNX1 binding site of SLC22A4, encoding an organic cation transporter, is associated with rheumatoid arthritis. Nat Genet. 2003;35:341–8. doi: 10.1038/ng1267. [DOI] [PubMed] [Google Scholar]
- 22.Santiago JL, Martinez A, de la Calle H, Fernandez-Arquero M, Figueredo MA, de la Concha EG, Urcelay E. Evidence for the association of the SLC22A4 and SLC22A5 genes with type 1 diabetes: a case control study. BMC Med Genet. 2006;7:54. doi: 10.1186/1471-2350-7-54. [DOI] [PMC free article] [PubMed] [Google Scholar]
- 23.Speckman RA, Wright Daw JA, Helms C, Duan S, Cao L, Taillon-Miller P, Kwok PY, Menter A, Bowcock AM. Novel immunoglobulin superfamily gene cluster, mapping to a region of human chromosome 17q25, linked to psoriasis susceptibility. Hum Genet. 2003;112:34–41. doi: 10.1007/s00439-002-0851-y. [DOI] [PubMed] [Google Scholar]
- 24.Masuda ES, Luo Y, Young C, Shen M, Rossi AB, Huang BC, Yu S, Bennett MK, Payan DG, Scheller RH. Rab37 is a novel mast cell specific GTPase localized to secretory granules. FEBS Lett. 2000;470:61–4. doi: 10.1016/s0014-5793(00)01288-6. [DOI] [PubMed] [Google Scholar]
- 25.Nair RP, Henseler T, Jenisch S, Stuart P, Bichakjian CK, Lenk W, Westphal E, Guo SW, Christophers E, Voorhees JJ, Elder JT. Evidence for two psoriasis susceptibility loci (HLA and 17q) and two novel candidate regions (16q and 20p) by genome-wide scan. Hum Mol Genet. 1997;6:1349–56. doi: 10.1093/hmg/6.8.1349. [DOI] [PubMed] [Google Scholar]
- 26.Tomfohrde J, Silverman A, Barnes R, Fernandez-Vina MA, Young M, Lory D, Morris L, Wuepper KD, Stastny P, Menter A, et al. Gene for familial psoriasis susceptibility mapped to the distal end of human chromosome 17q. Science. 1994;264:1141–5. doi: 10.1126/science.8178173. [DOI] [PubMed] [Google Scholar]
- 27.Helms C, Cao L, Krueger JG, Wijsman EM, Chamian F, Gordon D, Heffernan M, Daw JA, Robarge J, Ott J, Kwok PY, Menter A, Bowcock AM. A putative RUNX1 binding site variant between SLC9A3R1 and NAT9 is associated with susceptibility to psoriasis. Nat Genet. 2003;35:349–56. doi: 10.1038/ng1268. [DOI] [PubMed] [Google Scholar]
- 28.Reich D, Patterson N, Ramesh V, De Jager PL, McDonald GJ, Tandon A, Choy E, Hu D, Tamraz B, Pawlikowska L, Wassel-Fyr C, Huntsman S, Waliszewska A, Rossin E, Li R, Garcia M, Reiner A, Ferrell R, Cummings S, Kwok PY, Harris T, Zmuda JM, Ziv E. Admixture mapping of an allele affecting interleukin 6 soluble receptor and interleukin 6 levels. Am J Hum Genet. 2007;80:716–26. doi: 10.1086/513206. [DOI] [PMC free article] [PubMed] [Google Scholar]
- 29.Kado S, Nagase T, Nagata N. Circulating levels of interleukin-6, its soluble receptor and interleukin-6/interleukin-6 receptor complexes in patients with type 2 diabetes mellitus. Acta Diabetol. 1999;36:67–72. doi: 10.1007/s005920050147. [DOI] [PubMed] [Google Scholar]
- 30.Summar ML, Hall L, Christman B, Barr F, Smith H, Kallianpur A, Brown N, Yadav M, Willis A, Eeds A, Cermak E, Summar S, Wilson A, Arvin M, Putnam A, Wills M, Cunningham G. Environmentally determined genetic expression: clinical correlates with molecular variants of carbamyl phosphate synthetase I. Mol Genet Metab. 2004;81(Suppl 1):S12–9. doi: 10.1016/j.ymgme.2003.11.014. [DOI] [PubMed] [Google Scholar]
- 31.Summar ML, Gainer JV, Pretorius M, Malave H, Harris S, Hall LD, Weisberg A, Vaughan DE, Christman BW, Brown NJ. Relationship between carbamoyl-phosphate synthetase genotype and systemic vascular function. Hypertension. 2004;43:186–91. doi: 10.1161/01.HYP.0000112424.06921.52. [DOI] [PubMed] [Google Scholar]
- 32.McVean GA, Myers SR, Hunt S, Deloukas P, Bentley DR, Donnelly P. The fine-scale structure of recombination rate variation in the human genome. Science. 2004;304:581–4. doi: 10.1126/science.1092500. [DOI] [PubMed] [Google Scholar]
- 33.Barrett JC, Fry B, Maller J, Daly MJ. Haploview: analysis and visualization of LD and haplotype maps. Bioinformatics. 2005;21:263–5. doi: 10.1093/bioinformatics/bth457. [DOI] [PubMed] [Google Scholar]