Abstract
Purpose
To better understand pathophysiological mechanisms underlying Pattern Electroretinogram (PERG) losses in glaucoma by simulating either RGC dysfunction or RGC loss in normal subjects.
Materials and Methods
The steady-state PERG has been recorded in ten normal subjects (mean age 31 ± 8 years) according to the PERGLA paradigm by means of skin electrodes in response to horizontal gratings (1.7 cycles/deg, 99% contrast, 40 cd/m2 mean luminance, circular field size 25 deg diameter) alternating 16.28 times/s. Simulated RGC dysfunction has been obtained by reducing either contrast and mean luminance, or blurring the visual stimulus. Simulated RGC loss has been obtained by reducing stimulus area. Outcome measures were PERG amplitude and phase obtained by Discrete Fourier Transform of PERG waveforms.
Results
Progressive PERG amplitude reductions spanning the entire dynamic range of PERG response could be obtained by progressively reducing stimulus contrast and luminance, blurring the stimulus, and reducing stimulus area. The same variations in stimulus conditions caused phase changes of disparate sign and magnitude. Phase advanced (latency shortened) by reducing stimulus contrast of or blurring the stimulus; phase lagged (latency increased) by reducing stimulus luminance; phase remained constant by reducing stimulus area.
Conclusions
PERG amplitude and phase are essentially uncoupled, implying that these measures reflect distinct aspects of RGC activity. Based on our results and known PERG physiology, we propose a model in which that both RGC dendrites and RGC axons contribute to the PERG signal. PERG delays may represent and indication of synaptic dysfunction that is potentially reversible.
Keywords: Pattern Electroretinogram (PERG), glaucoma, retinal ganglion cells
The pattern electroretinogram (PERG) depends on the integrity of retinal ganglion cells (RGC) 1, 2 and represents an important surrogate measure of RGC function in glaucoma 3–7 8 and other optic nerve disorders.9 In glaucoma, the PERG may be used for early detection, (e.g.,10) monitoring progression, (e.g., 11) and for monitoring the beneficial effects of IOP-lowering treatments.12 The PERG may be altered even before the appearance of visual field defects as measured by Standard Automated Perimetry (SAP) and losses of the retinal nerve fiber layer (RNFL) as measured by OCT.8 The recent introduction of a user-friendly and reproducible method of recording steady-state PERG responses using skin electrodes and automated analysis (PERGLA paradigm) has generated further interest in the PERG technique for applications in glaucoma13–15 together with the need of better insight on pathophysiological mechanisms underlying PERG losses.
Using the PERGLA paradigm, patients with glaucoma may display large amplitude reductions (up to 90%) and/or phase lags (latency delays up to 15 ms) compared to age-matched controls.10, 15 The physiological significance of these abnormalities has not been elucidated. Amplitude and phase represent two distinct aspects of neural activity. Response amplitude is related to the number 16 and/or vitality17 of retinal neurons contributing to the recorded electrical signal. To a first approximation, the smaller the number of neurons activated by the visual stimulus the smaller the electrical signal; the sicker the neurons (and/or abnormal connectivity or gain relationships between neurons) the smaller the electrical signal. Temporal phase lag is an additional index of vitality of activated neurons that may or may not be associated with amplitude reduction. Mechanisms of phase lag are less understood than those of amplitude reduction, and will represent a major focus of this study. To a first approximation, the slower the electrical signal generated by activated neurons the larger the phase lag.18
To better understand physiological significance of PERG losses in glaucoma, we have manipulated the stimulus characteristics (luminance, contrast, area) in order to reproduce in normal subjects the entire range of amplitude and phase abnormalities reported to occur in glaucoma. Luminance changes at constant contrast are expected to affect primarily the activity of photoreceptors and have secondary effects on 2nd order neurons; contrast changes at constant mean luminance are not expected to affect the mean activity of photoreceptors but are expected to affect primarily the activity of postreceptoral neurons with strong center-surround antagonism (i.e., RGCs); changes in stimulus area are expected to affect the number of activated neurons. The type and magnitude of stimulus manipulation to reproduce specific PERG changes may provide clues on specific sites/mechanisms of response alteration and offer a framework for interpretation of PERG losses in glaucoma.
Methods
PERG technique
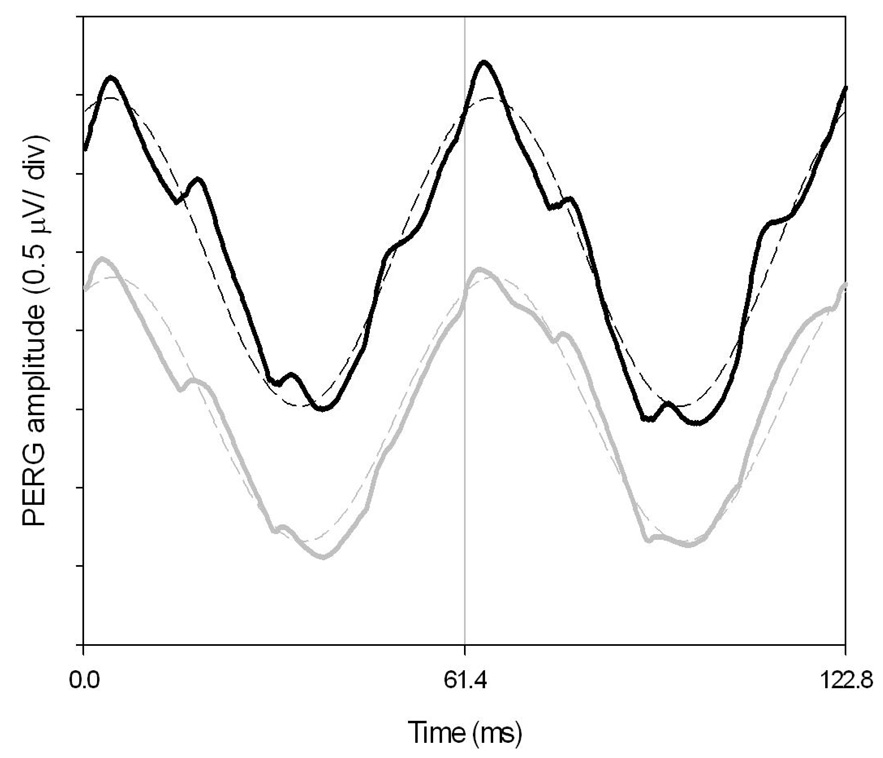
The PERG has been recorded according to the PERGLA paradigm incorporated in a commercial apparatus (Lace Elettronica, Rome, Italy) as previously described.13 In brief, the PERG was recorded simultaneously from both eyes by means of small (9 mm diameter) skin electrodes taped on the lower eyelids (references ipsilateral temples, common ground central forehead). The pattern stimulus was displayed on a CRT monitor (VTM, Bologna, Italy, 65 Hz refresh rate, not interlaced) within a Ganzfeld bowl, and consisted typically of horizontal gratings (1.7 cycles/degree, 25 degree diameter circular field, 99% contrast, 40 cd/m2 mean luminance). The surround lighting was 3 cd/m2. The grating was temporally modulated in counterphase at 8 Hz, corresponding to 16.28 contrast reversals/s). We checked with a radiometer (Model DR-2000, Gamma Scientific, San Diego, CA) that the mean luminance and contrast values provided by the produces were correct. The spatio-temporal characteristics of patterned stimuli were chosen to maximize PERG amplitude. 19, 20 Prior testing, subjects were allowed at least 5 minutes exposure to the room background, approximately similar to the Ganzfeld background. During testing, subjects fixated on a target at the center of the stimulus with the appropriate correction for a viewing distance of 30 cm. Subjects did not receive dilating drops, and were allowed to blink freely. Signals were band pass filtered (1–30 Hz), amplified (100,000 fold), and averaged (600 sweeps) in two successive blocks of 300 sweeps each, separated by a brief pause of about 15 seconds. The first 30 sweeps of each block were discarded to avoid transients and allow steady fixation. Sweeps contaminated by eye blinks or gross eye movements were automatically rejected over a threshold voltage of 25 µV. The total recording time was about 3 minutes. Since the PERG was recorded in response to relatively fast alternating gratings, the response waveforms were steady-state (sinusoidal-like) with a temporal period corresponding to the reversal rate (Fig. 1). PERG waveforms were automatically evaluated in the frequency domain by Discrete Fourier Transform (DFT) to isolate the component at the reversal rate (16.28 Hz), and measure its amplitude in µV(1/2 of the peak-to-trough amplitude) and temporal phase in π rad. Phase values are bound within ± 1 π rad. To avoid inherent discontinuity of phase data around 0 and ± 1 π rad, phase readings were automatically unwrapped by subtracting actual readings from the value modulo of 2 π rad [2 minus actual reading]. Phase values were thus bound between 1 and 3 π rad without discontinuities. At the reversal rate of 16.28 Hz, the value modulo of 2 π rad corresponds to 1/16.28* 1000 = 61.4 ms. Phase advances (shorter latencies) are associated with increasing values, and phase lags (longer latencies) are associated with decreasing values.
Figure 1.
Examples of steady-state PERGs recorded for each eye of a normal subject in response to a pattern of horizontal gratings (1.7 cy/deg, 99% contrast, 40 cd/m2 mean luminance, circular field size 25 deg diameter) alternating at 16.28 times/s or every 61.4 ms. The continuous lines represent the actual PERG waveforms (black, right eye; grey, left eye). The dashed waveforms superimposed on the PERG waveforms represent the harmonic components at the reversal frequency, isolated by means of Digital Fourier Transform (DFT). The amplitude and phase of DFT-isolated components represent the actual PERG measures.
It has to be pointed out that phase values are not unique. There exist an infinite set of phases separated by 2π radians (61.4 ms in our conditions), so there is an inherent ambiguity about the absolute value of temporal phase. In our protocol the phase advances or lags in an orderly fashion between conditions (e.g., changing contrast, luminance, area); the amount of phase shift is small (a fraction of π rad or a few ms) compared to the value modulo (2 π rad or 61.4 ms). Therefore it is safe to assume that phase shifts occur within the same modulo, and therefore represent unambiguous, progressive changes in PERG latency with changing conditions. The situation is different when the changing condition is stimulus temporal frequency. Under these conditions, phase lags are apparent (do not represent actual changes in PERG latency), since what is changing is the value modulo in ms that becomes progressively smaller with increasing temporal frequency. The results of this is that the phase lags progressively with increasing temporal frequency to span the entire modulo (2 π rad), at which point the phase jumps back by 2 π rad and the phase shifts starts over. The curve representing the phase shift with increasing temporal frequency has therefore a saw tooth appearance. To choose the correct phase at points of discontinuity it is necessary to add or subtract (manually or automatically) multiples of 2π rad to the raw data to produce maximum orderliness (unwrapping of phase discontinuities).21 The slope of unwrapped phase with temporal frequency provides a means to calculate the absolute value of latency of steady-state responses. This approach has been successfully used to evaluate the temporal properties of the visual system in normal subjects (e.g., 19, 22, 23) as well as in disease, including glaucoma.24–26 In this study only one temporal frequency will be used, so that phase changes will occur within a constant value modulo.
Rationale
In a normal subject, a PERG signal of a given amplitude and phase in response to an optimal visual stimulus is expected to reflect the maximized activity of the neural ensemble upon which the visual stimulus is projected. In a glaucoma subject, a reduced/delayed PERG signal may indicate diminished activity of the viable neurons — including connectivity or gain relationships among neurons — diminished number of neurons, or a combination of either conditions. Our approach A) aims at simulating diminished activity of existing neurons by reducing stimulus contrast or mean luminance, and also by artificially inducing optical opacities that blur the visual stimulus. Our approach B) aims at simulating diminished number of neurons by reducing stimulus area.
The effect of contrast was studied by setting the contrast at different values (99%, 50%, 25%, 12%) at constant mean luminance of 40 cd/m2. The effect of luminance was studied by adding neutral filters to each eye that attenuated mean luminance by 0.5 log units, 1 log units, or 1.5 log units, while the visual stimulus on the display had 99% contrast. The effect of blur was studied by adding Bangerter foils (1.0, 0.8, 0.6, 0.4, 0.3, 0.2, 0.1, Fresnel Prism & Lens Co. Eden Prairie, MN) to each eye, while the visual stimulus on the display had 99% contrast and 40 cd/m2 mean luminance. The effect of area was studied by reducing the stimulus size either concentrically (i.e., decreasing the stimulus diameter) or sectorially (i.e., removing sectors) while the remaining visual stimulus on the display had 99% contrast and 40 cd/m2 mean luminance. The removed part of the stimulus was a uniform gray field with 40 cd/m2 mean luminance.
The PERG has been simultaneously recorded from both eyes. Graphic representation and statistical analysis of data have been performed for the right eye only. Virtually identical results have been obtained by analyzing left eyes.
Study subjects
Subjects were 10 normal young individuals (mean age 31 ± 8 years) who were free of systemic or ocular diseases as assessed by routine ophthalmologic examination, and had best corrected Snellen visual acuity of ≥ 20/20. Subjects had refractive errors smaller than −3.0 spherical diopters and ± 1.5 cylindrical diopters. The methods applied in the study adhered to the tenets of the Declaration of Helsinki for the use of human subjects in biomedical research. Institutional Review Board approval was obtained for this study, and informed consent was obtained from each subject before recording.
Results
Approach A: simulating diminished activity of existing neurons
Luminance reduction
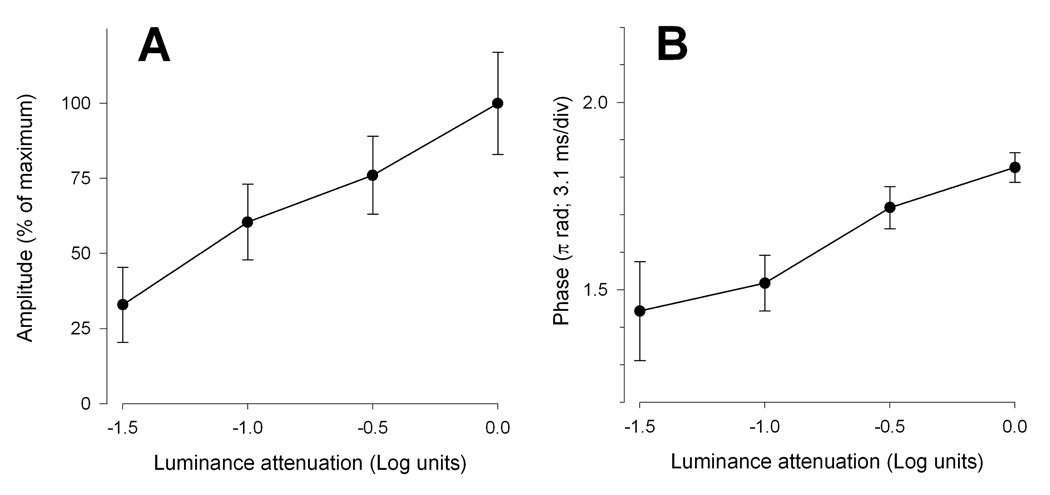
With decreasing mean luminance, the steady-state PERG amplitude (Fig. 2A) progressively decreased (ANOVA, P=0.014) in approximately linear fashion to reach a value about 67% smaller than the baseline values with 1.5 Log units of luminance attenuation. The PERG phase also progressively decreased (ANOVA, P=0.009) to a level 0.38 π rad smaller (latency increased by 12.06 ms) with 1.5 Log units of luminance attenuation (Fig. 2B).
Figure 2.
Mean PERG amplitude (A) and phase (B) as a function of mean luminance. Error bars represent the SEM. In panel A the Y-axis has been normalized to the maximum amplitude.
Contrast reduction
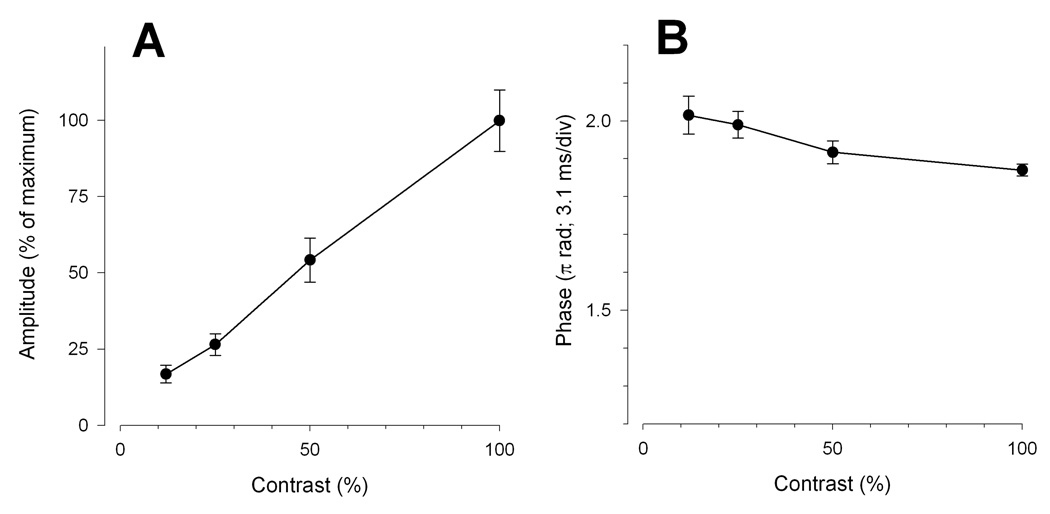
With decreasing contrast, the PERG amplitude progressively decreased (ANOVA, P<0.01) in approximately linear fashion to reach a value about 82% smaller than baseline at 12% contrast (Fig. 3A). Phase, instead increased (ANOVA, P=0.02) by 0.15 π rad (latency shortened by 4.6 ms) between 99% and 12% contrast (Fig. 3B).
Figure 3.
Mean PERG amplitude (A) and phase (B) as a function of contrast. Error bars represent the SEM. In panel A the Y-axis has been normalized to the maximum amplitude.
Image degradation
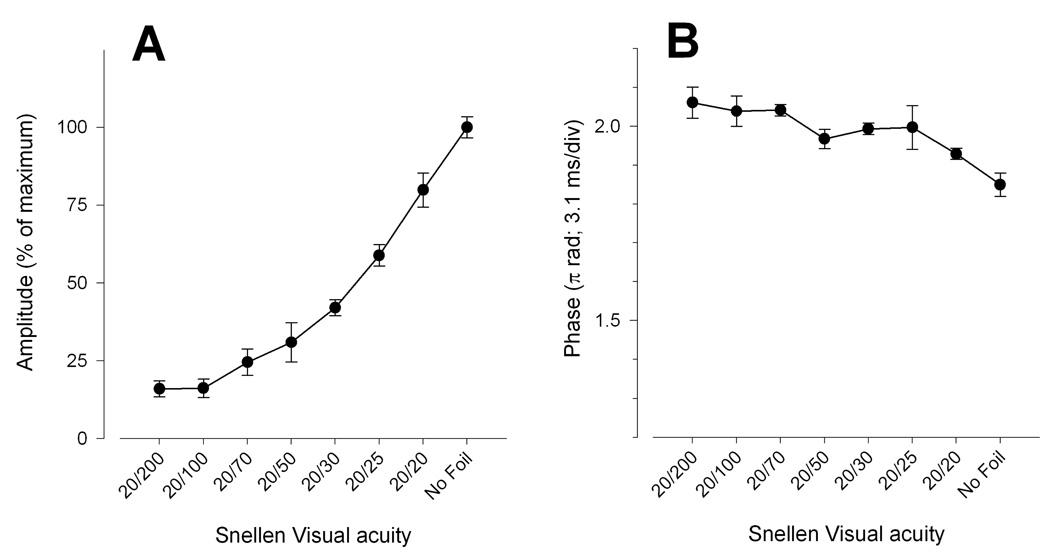
With increasing blur, the PERG amplitude progressively decreased (ANOVA, P<0.001) and tended to level off at a value about 83% smaller than baseline for filters 0.2 and 0.1, which correspond to a reduction in visual acuity to 20/100 and 20/200 (Fig. 4A). As for contrast reduction, phase increased (ANOVA, P=0.001) with increasing blur by 0.21 π rad (latency shortened by 6.6 ms) between baseline (no filter) and 0.1 filter (Fig. 4B).
Figure 4.
Mean PERG amplitude (A) and phase (B) as a function of increasing density of Bangerter foils. Error bars represent the SEM. In panel A the Y-axis has been normalized to the maximum amplitude. Acuity values correspond to those reported for each foil by the producer Fresnel Prism & Lens Co. Eden Prairie, MN.
Approach B: simulating diminished number of neurons
Sectorial area reduction
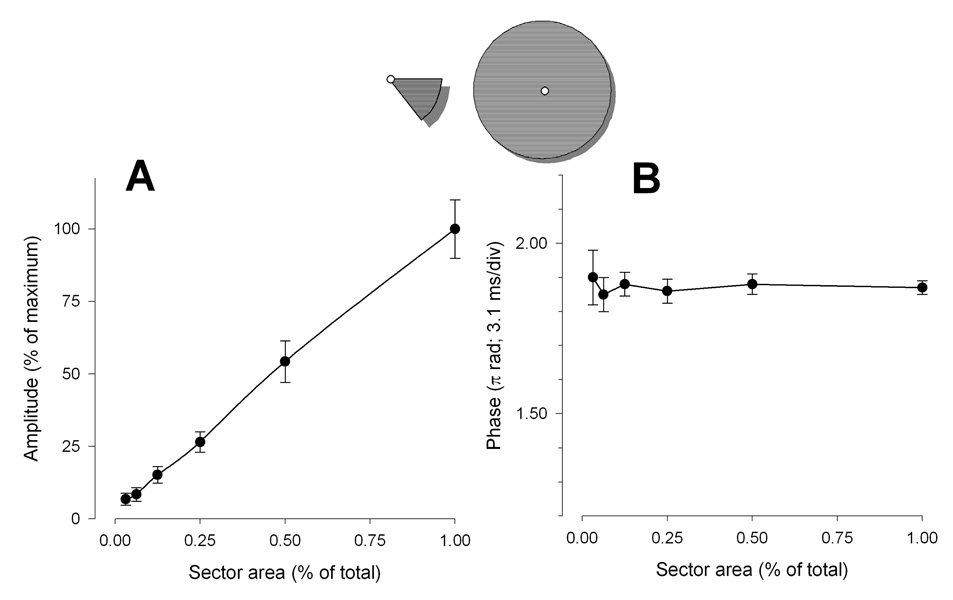
With decreasing area the PERG amplitude progressively decreased (ANOVA, P<0.001) in a linear fashion to reach a value about 93% smaller than baseline (noise range level) for an area size 1/32 of total (Fig. 5A). Phase remained remarkably constant (ANOVA, P=0.98) across conditions (Fig. 5B).
Figure 5.
Mean PERG amplitude (A) and phase (B) as a function of sector area. Error bars represent the SEM. In panel A the Y-axis has been normalized to the maximum amplitude. In both panels the X-axis has been normalized to the maximum area.
Concentric area reduction
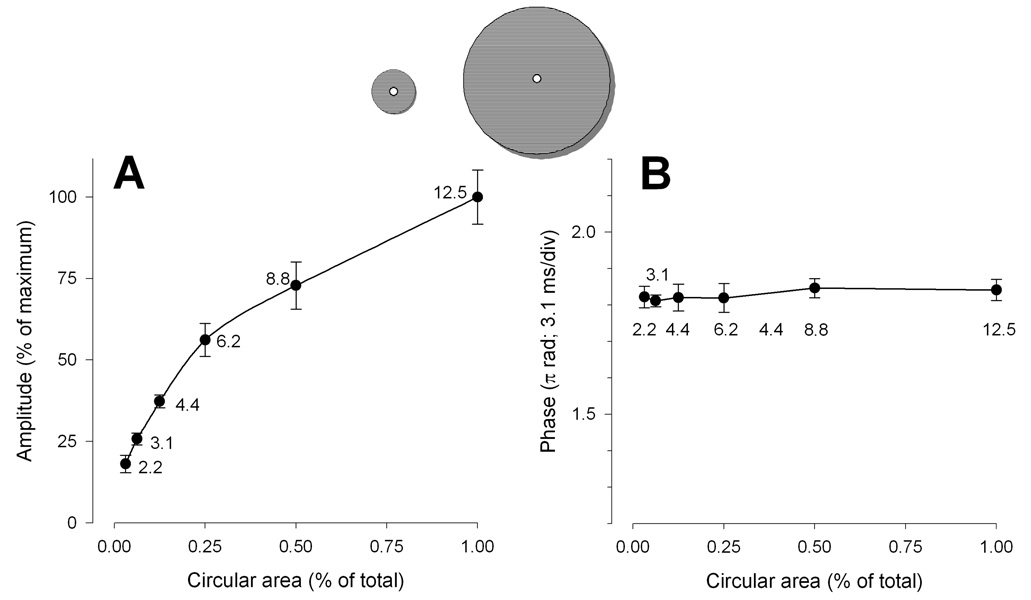
By concentrically decreasing the stimulus area the PERG amplitude progressively decreased (ANOVA, P<0.001) (Fig. 6A). Differently from sector area, however, the relationship between amplitude and area was highly non-linear. About 60% of the total signal could be elicited with just 25% (6 deg eccentricity) of the total area (12.5 deg eccentricity). The relationship between amplitude and area and could be well described by a simple logarithmic equation [y=y0+a·ln(area)] with a constant a of 0.24. Phase remained constant (ANOVA, P=0.96) across conditions (Fig. 6B).
Figure 6.
Mean PERG amplitude (A) and phase (B) as a function of concentric area. Error bars represent the SEM. In panel A the Y-axis has been normalized to the maximum amplitude. In both panels the X-axis has been normalized to the maximum area.
Discussion
This study aimed at characterizing the effects of stimulus parameters on the steady-state PERG using a paradigm (PERGLA) that was introduced to render the testing more user-friendly and clinically useful in glaucoma. In normal controls, stimulus-response relationships simulated a range of pathological conditions occurring in glaucoma patients. Analysis of these conditions sought to better understand the physiological significance of PERG amplitude and phase and provide clues on interpretation of PERG losses in glaucoma. Our results are in general agreement with previous reports showing that the amplitude of the steady-state PERG decreases with decreasing contrast, luminance, area, and increasing blur. 20, 27–30 31, 32 The same stimulus manipulations induce in disparate phase changes. PERG phase may delay (by reducing luminance), advance (by reducing contrast or increasing blur) or remain constant (by reducing area). Therefore, a key outcome of this series of experiments is that amplitude and phase are essentially uncoupled. This implies that amplitude and phase represent distinct aspects of neural activity. Relevant questions for glaucoma are whether or not the electrical sources of these distinct aspects of neural activity originate from the same cellular compartments and where these compartments are located in the retina. Here we provide a working model to provide a possible answer to these questions.
Our model relies on three main assumptions, which are based on a large body of literature on PERG generators.2, 27 The first assumption is that RGCs are the main generators of the PERG. The second assumption is that stimulus contrast, typically defined as difference in luminance between adjacent pattern elements divided by their sum (LumMax − LumMin)/(LumMax + LumMin), is the effective stimulus for the center-surround antagonism of RGCs.33 Reduction of the stimulus mean luminance does not change stimulus contrast. It should be taken into account that stimulus contrast is not the only stimulus parameter that affects PERG amplitude. PERG amplitude may be also be secondarily affected by events occurring in the pre-ganglionic retina. It is well known that by reducing stimulus luminance, the full field photopic ERG decreases in amplitude and increases in latency. (e.g., 34) Analogue changes in PERG are expected based on reduced activation of photoreceptors. The third assumption is that by reducing mean luminance at maximum contrast, outer retina activity is diminished and delayed, and this offsets RGC activity to a lower level of amplitude and latency; by reducing the contrast at constant mean luminance RGC activity is diminished but outer retina activity is not changed.
Approach A: simulating diminished activity of existing neurons
In an idealized glaucoma patient, outer retina function is expected to be normal. Hence any increase in PERG latency (phase delay) must depend on pathological events occurring at RGCs and/or in the inner retina circuitry impinging on them. Our results show that by reducing stimulus contrast or stimulus area at constant mean luminance the PERG amplitude is reduced, but the PERG latency is not delayed. This implies that diminished activity of RGCs (such as resulting by a combination of missing RGCs and sick RGCs) explains PERG amplitude losses but not phase delays often found in glaucoma. To explain phase delays one needs to hypothesize that the input to RGCs may be diminished, as it occurs by reducing stimulus luminance. Since photoreceptor dysfunction has been excluded in glaucoma, (see however35) a likely candidate for reduced input to RGCs may be reduced synaptic function 36 between 2nd and 3rd order neurons. Synaptic dysfunction between 2nd and 3rd order neurons in glaucoma may occur for a number of reasons, such as RGC dendritic shrinkage with loss of both neuronal dendritic connection extent and complexity, 37–39 and synapse elimination.40 These dendritic modifications typically precede neuronal loss and result in reduced responsiveness of RGCs in glaucoma. 41 Reduced responsiveness of RGCs includes reduced ability to follow stimuli of increased temporal frequency, implying a slower temporal dynamics and longer latency. A phase delay without amplitude attenuation could arise from synaptic and transport delays.42
In the vertebrate retina, RGC electrical activity is generated in the form of both graded synaptic currents at the level of dendrites and action potentials at the level of axons.43 Based on a substantial body of literature, both dendritic and axonal activity appear to contribute to the PERG. (see for review 44) By blocking action potentials in the inner retina with intravitreal injections of tetrodotoxin (TTX), the PERG amplitude can be reduced (by about 50%) but not abolished.45, 46 All RGC activity can be abolished by optic nerve section which causes retrograde degeneration of RGC together with their dendrites.47 This implies that RGC dendritic activity (TTX-independent) is necessary to the PERG generation and represent a substantial component of the PERG signal.
Reducing stimulus contrast at constant mean luminance results in phase advancement (latency shortening). A likely explanation for this is that PERG generators include a mixed population of RGCs.48 RGC are commonly divided in two major classes: M-cells (morphologically known as parasol with large dendritic field size and projecting to the Magnocellular layers of the lateral geniculate nucleus), and P- cells (morphologically known as midget cells with small dendritic field size and projecting to the Parvocellular layers of the lateral geniculate nucleus). M cells are much more sensitive to luminance contrast than P cells 49 and their response has a faster temporal dynamics than P cells. 33 Low contrast stimuli are expected to elicit relatively larger contribution of M generators with shorter latency compared to high contrast stimuli, and this may be reflected in PERG phase advancement.28
Blurring the visual stimulus with Bangerter foils at constant mean luminance results in phase advancement of even larger magnitude compared contrast reduction alone. A likely explanation for this is that Bangerter foils, in addition to reducing stimulus contrast, also suppress the square-wave edges of the grating pattern, thereby removing the high-spatial frequency content of the stimulus. Since P cells have smaller receptive fields compared to M cells, blurring is expected to shift the relative contribution of M and P generators towards M generators with shorter latency, and this may be reflected in PERG phase advancement. PERG phase advancement may be also obtained with simulated blur (i.e., comparing a square-wave gratings with a smoothed-wave grating 28) or by reducing the stimulus spatial frequency.19, 23 The implication for glaucoma is that while patients with cataracts may display non-specific PERG amplitude reductions due to stimulus deterioration, PERG phase delays are not expected.
Approach B: simulating diminished number of neurons
By reducing the stimulus area, either sectorially or concentrically, the phase does not change. Linear amplitude reduction with sectorial reduction of stimulus area indicates complete spatial summation,50 and excludes generators sources external to the area covered by the stimulus as it might occur if substantial stray light were generated at the stimulus boundaries.
Amplitude reduction with concentric reduction of stimulus area is instead highly non-linear, the macular area being strongly overrepresented in the PERG signal. The relative contribution of extramacular retinal regions to the PERG signal progressively diminishes with increasing eccentricity. Since common visual field abnormalities occur at extramacular eccentricities, 51 the PERG is not expected to show a strong correlation with both visual field 10, 52 and RNFL thickness. 8, 53 The fact that the PERG indeed shows moderate correlation with both visual field mean deviation and mean RNFL thickness, and is often altered before evident visual defects, or for visual defects peripheral to the PERG stimulus10, 52, 54, 55 implies that PERG losses reflect early damage involving macular RGCs.
Conclusions
The PERG has been used since more than 25 years as an objective test for RGC function in glaucoma. The introduction of reproducible methods of recording using skin electrodes has generated renewed interest in the technique. Interpretation of PERG losses is still object of discussion. PERG amplitude losses do not have a unique solution. Excluding co-morbid retinal disorders, PERG amplitude losses may occur because of lost RGCs, sick RGCs, or a combination of both conditions. Older normal subjects, compared to young normal subjects, have reduced amplitude and delayed phase (e.g., 10, 13). From a PERG perspective, therefore, older age may be considered qualitatively similar to glaucoma, albeit quantitatively different. The model of neuronal dysfunction/loss we have proposed includes age- and glaucoma related alterations. PERG amplitude loss may also occur because of optical opacities that deteriorate the optical quality of the stimulus.
Alterations of PERG phase have not been systematically investigated. Some laboratories reported that latency delays are rarely observed in glaucoma (e.g., 56, while others using different experimental conditions reported sizable latency delays in a substantial proportion of patients (e.g., 57; 10). This implies that the choice of a specific PERG paradigm may play a role in detection of PERG alterations. According to the working model proposed in this study, PERG phase advances may indicate optical deterioration of the pattern stimulus; PERG phase delays suggest pathophysiological mechanisms such as dendritic dysfunction or delay of axonal transport, and may represent an opportunity to detect RGC dysfunction preceding cell death. At this stage, RGC damage is potentially reversible.12 Recent results of our group show that reversible PERG amplitude loss and phase delays may occur in patients with pituitary tumors.58 Reversible PERG amplitude losses and remarkable phase delays may also be temporarily induced in some glaucoma suspects during head-down body tilt.59 The PERGLA paradigm we used appears suitable to show phase delays in a variety of conditions that make the working model we proposed clinically relevant.
Acknowledgments
Supported by NIH-NEI RO1 EY014957, NIH center grant P30-EY014801, and by an unrestricted grant to the University of Miami from Research to Prevent Blindness.
Footnotes
Conflict of interest: VP, Lace Elettronica, Italy
References
- 1.Maffei L, Fiorentini A. Electroretinographic responses to alternating gratings before and after section of the optic nerve. Science. 1981;211(4485):953–955. doi: 10.1126/science.7466369. [DOI] [PubMed] [Google Scholar]
- 2.Zrenner E. The physiological basis of the pattern electroretinogram. In: Osborne N, Chader G, editors. Progress in Retinal Research. v. 9. Oxford: Pergamon Press; 1990. [Google Scholar]
- 3.Trick GL. Pattern electroretinogram: an electrophysiological technique applicable to primary open-angle glaucoma and ocular hypertension. J glaucoma. 1992;1:271–279. [PubMed] [Google Scholar]
- 4.Korth M. The value of electrophysiological testing in glaucomatous diseases. J Glaucoma. 1997;6(5):331–343. [PubMed] [Google Scholar]
- 5.Bach M. Electrophysiological approaches for early detection of glaucoma. Eur J Ophthalmol. 2001;11 Suppl 2:S41–S49. doi: 10.1177/112067210101102s05. [DOI] [PubMed] [Google Scholar]
- 6.Ventura LM, Porciatti V. Pattern electroretinogram in glaucoma. Curr Opin Ophthalmol. 2006;17(2):196–202. doi: 10.1097/01.icu.0000193082.44938.3c. [DOI] [PMC free article] [PubMed] [Google Scholar]
- 7.Porciatti V. Electrophysiological testing in glaucoma. Expert Review of Ophthalmology. 2007;2(5):747–754. [Google Scholar]
- 8.Ventura LM, Sorokac N, De Los Santos R, et al. The relationship between retinal ganglion cell function and retinal nerve fiber thickness in early glaucoma. Invest Ophthalmol Vis Sci. 2006;47(9):3904–3911. doi: 10.1167/iovs.06-0161. [DOI] [PMC free article] [PubMed] [Google Scholar]
- 9.Holder GE. The pattern electroretinogram in anterior visual pathway dysfunction and its relationship to the pattern visual evoked potential: a personal clinical review of 743 eyes. Eye. 1997;11(Pt 6):924–934. doi: 10.1038/eye.1997.231. [DOI] [PubMed] [Google Scholar]
- 10.Ventura LM, Porciatti V, Ishida K, et al. Pattern electroretinogram abnormality and glaucoma. Ophthalmology. 2005;112(1):10–19. doi: 10.1016/j.ophtha.2004.07.018. [DOI] [PMC free article] [PubMed] [Google Scholar]
- 11.Bach M, Unsoeld AS, Philippin H, et al. Pattern ERG as an early glaucoma indicator in ocular hypertension: a long-term, prospective study. Invest Ophthalmol Vis Sci. 2006;47(11):4881–4887. doi: 10.1167/iovs.05-0875. [DOI] [PubMed] [Google Scholar]
- 12.Ventura LM, Porciatti V. Restoration of retinal ganglion cell function in early glaucoma after intraocular pressure reduction: a pilot study. Ophthalmology. 2005;112(1):20–27. doi: 10.1016/j.ophtha.2004.09.002. [DOI] [PMC free article] [PubMed] [Google Scholar]
- 13.Porciatti V, Ventura LM. Normative data for a user-friendly paradigm for pattern electroretinogram recording. Ophthalmology. 2004;111(1):161–168. doi: 10.1016/j.ophtha.2003.04.007. [DOI] [PMC free article] [PubMed] [Google Scholar]
- 14.Yang A, Swanson WH. A new pattern electroretinogram paradigm evaluated in terms of user friendliness and agreement with perimetry. Ophthalmology. 2007;114(4):671–679. doi: 10.1016/j.ophtha.2006.07.061. [DOI] [PMC free article] [PubMed] [Google Scholar]
- 15.Fredette MJ, Anderson DR, Porciatti V, Feuer W. Reproducibility of pattern electroretinogram in glaucoma patients with a range of severity of disease with the new glaucoma paradigm. Ophthalmology. 2008;115(6):957–963. doi: 10.1016/j.ophtha.2007.08.023. [DOI] [PMC free article] [PubMed] [Google Scholar]
- 16.Johnson MA, Drum BA, Quigley HA, et al. Pattern-evoked potentials and optic nerve fiber loss in monocular laser-induced glaucoma. Invest Ophthalmol Vis Sci. 1989;30(5):897–907. [PubMed] [Google Scholar]
- 17.Siliprandi R, Bucci MG, Canella R, Carmignoto G. Flash and pattern electroretinograms during and after acute intraocular pressure elevation in cats. Invest Ophthalmol Vis Sci. 1988;29(4):558–565. [PubMed] [Google Scholar]
- 18.Lee BB, Martin PR, Valberg A. Amplitude and phase of responses of macaque retinal ganglion cells to flickering stimuli. J Physiol. 1989;414(1):245–263. doi: 10.1113/jphysiol.1989.sp017686. [DOI] [PMC free article] [PubMed] [Google Scholar]
- 19.Porciatti V, Burr DC, Morrone MC, Fiorentini A. The effects of aging on the pattern electroretinogram and visual evoked potential in humans. Vision Res. 1992;32(7):1199–1209. doi: 10.1016/0042-6989(92)90214-4. [DOI] [PubMed] [Google Scholar]
- 20.Porciatti V, Sorokac N, Buchser W. Habituation of retinal ganglion cell activity in response to steady state pattern visual stimuli in normal subjects. Invest Ophthalmol Vis Sci. 2005;46(4):1296–1302. doi: 10.1167/iovs.04-1242. [DOI] [PMC free article] [PubMed] [Google Scholar]
- 21.Oppehneim AV, Schafer RW. Digital signal processing. Englewood Cliffs, N.J.: Prentice-Hall, Inc.; 1975. p. 598. [Google Scholar]
- 22.Morrone C, Porciatti V, Fiorentini A, Burr DC. Pattern-reversal electroretinogram in response to chromatic stimuli: I. Humans. Vis Neurosci. 1994;11(5):861–871. doi: 10.1017/s0952523800003825. [DOI] [PubMed] [Google Scholar]
- 23.Padovano S, Falsini B, Ciavarella P, et al. Spatial-temporal interactions in the steady-state pattern electroretinogram. Doc Ophthalmol. 1995;90(2):169–176. doi: 10.1007/BF01203336. [DOI] [PubMed] [Google Scholar]
- 24.Porciatti V, Sartucci F. Retinal and cortical evoked responses to chromatic contrast stimuli. Specific losses in both eyes of patients with multiple sclerosis and unilateral optic neuritis. Brain. 1996;119(Pt 3):723–740. doi: 10.1093/brain/119.3.723. [DOI] [PubMed] [Google Scholar]
- 25.Porciatti V, Di Bartolo E, Nardi N, Fiorentini A. Responses to chromatic and luminance contrast in glaucoma: a psychophysical and electrophysiological study. Vision Res. 1997;37(14):1975–1987. doi: 10.1016/s0042-6989(97)00018-7. [DOI] [PubMed] [Google Scholar]
- 26.Porciatti V, Bonanni P, Fiorentini A, Guerrini R. Lack of cortical contrast gain control in human photosensitive epilepsy. Nat Neurosci. 2000;3(3):259–263. doi: 10.1038/72972. [DOI] [PubMed] [Google Scholar]
- 27.Hess RF, Baker CL., Jr Human pattern-evoked electroretinogram. J Neurophysiol. 1984;51(5):939–951. doi: 10.1152/jn.1984.51.5.939. [DOI] [PubMed] [Google Scholar]
- 28.Brodie SE, Conte MM. Dependence of the pattern-ERG on variations of the stimulus pattern. Clin. Vision Sci. 1992;7(4):283–291. [Google Scholar]
- 29.Heinrich TS, Bach M. Contrast adaptation in human retina and cortex. Invest Ophthalmol Vis Sci. 2001;42(11):2721–2727. [PubMed] [Google Scholar]
- 30.Leipert KP, Gottlob I. Pattern electroretinogram: effects of miosis, accommodation, and defocus. Doc Ophthalmol. 1987;67(4):335–346. doi: 10.1007/BF00143951. [DOI] [PubMed] [Google Scholar]
- 31.Bach M, Mathieu M. Different effect of dioptric defocus vs. light scatter on the pattern electroretinogram (PERG) Doc Ophthalmol. 2004;108(1):99–106. doi: 10.1023/b:doop.0000018415.00285.56. [DOI] [PubMed] [Google Scholar]
- 32.Mauck K, Dodt E, Schnaudigel OE, Ohrloff C. Effect of cataracts on contrast pattern reversal stimuli exemplified by the pattern electroretinogram. Ophthalmologe. 1996;93(4):463–466. [PubMed] [Google Scholar]
- 33.Kaplan E, Benardete E. The dynamics of primate retinal ganglion cells. Prog Brain Res. 2001;134:17–34. doi: 10.1016/s0079-6123(01)34003-7. [DOI] [PubMed] [Google Scholar]
- 34.Rufiange M, Dumont M, Lachapelle P. Modulation of the human photopic ERG luminance-response function with the use of chromatic stimuli. Vision Research. 2005;45(17):2321–2330. doi: 10.1016/j.visres.2005.02.010. [DOI] [PubMed] [Google Scholar]
- 35.Nork TM, Ver Hoeve JN, Poulsen GL, et al. Swelling and loss of photoreceptors in chronic human and experimental glaucomas. Arch Ophthalmol. 2000;118(2):235–245. doi: 10.1001/archopht.118.2.235. [DOI] [PubMed] [Google Scholar]
- 36.Lopez JC. Quantifying synaptic efficacy. 2002;3(5):332. [Google Scholar]
- 37.Morgan JE. Retinal ganglion cell shrinkage in glaucoma. J Glaucoma. 2002;11(4):365–370. doi: 10.1097/00061198-200208000-00015. [DOI] [PubMed] [Google Scholar]
- 38.Shou T, Liu J, Wang W, et al. Differential dendritic shrinkage of alpha and beta retinal ganglion cells in cats with chronic glaucoma. Invest Ophthalmol Vis Sci. 2003;44(7):3005–3010. doi: 10.1167/iovs.02-0620. [DOI] [PubMed] [Google Scholar]
- 39.Weber A, Kaufman P, Hubbard W. Morphology of single ganglion cells in the glaucomatous primate retina. Invest. Ophthalmol. Vis. Sci. 1998;39(12):2304–2320. [PubMed] [Google Scholar]
- 40.Stevens B, Allen N, Vazquez L, et al. The classical complement cascade mediates CNS synapse elimination. Cell. 2007;131(6):1164–1178. doi: 10.1016/j.cell.2007.10.036. [DOI] [PubMed] [Google Scholar]
- 41.Weber AJ, Harman CD. Structure-function relations of parasol cells in the normal and glaucomatous primate retina. Invest Ophthalmol Vis Sci. 2005;46(9):3197–3207. doi: 10.1167/iovs.04-0834. [DOI] [PMC free article] [PubMed] [Google Scholar]
- 42.Frishman LJ, Freeman AW, Troy JB, et al. Spatiotemporal frequency responses of cat retinal ganglion cells. J Gen Physiol. 1987;89(4):599–628. doi: 10.1085/jgp.89.4.599. [DOI] [PMC free article] [PubMed] [Google Scholar]
- 43.Dowling JE, Werblin FS. Synaptic organization of the vertebrate retina. Vision Res. 1971 Suppl 3:1–15. doi: 10.1016/0042-6989(71)90026-5. [DOI] [PubMed] [Google Scholar]
- 44.Porciatti V. The mouse pattern electroretinogram. Doc Ophthalmol. 2007;115(3):145–153. doi: 10.1007/s10633-007-9059-8. [DOI] [PMC free article] [PubMed] [Google Scholar]
- 45.Trimarchi C, Biral G, Domenici L, et al. The Flash- and pattern electroretinogram generators in the cat: a pharmacological approach. Clin. Vision Sci. 1990;6:19–24. [Google Scholar]
- 46.Viswanathan S, Frishman LJ, Robson JG. The uniform field and pattern ERG in macaques with experimental glaucoma: removal of spiking activity. Invest Ophthalmol Vis Sci. 2000;41(9):2797–2810. [PubMed] [Google Scholar]
- 47.Maffei L, Fiorentini A, Bisti S, Hollander H. Pattern ERG in the monkey after section of the optic nerve. Exp Brain Res. 1985;59(2):423–425. doi: 10.1007/BF00230925. [DOI] [PubMed] [Google Scholar]
- 48.Kaplan E, Lee BB, Shapley R, editors. New views of primate retina function. Vol. 9. New York: Pergamon Press; 1990. pp. 273–336. [Google Scholar]
- 49.Kaplan E, Shapley RM. The primate retina contains two types of ganglion cells, with high and low contrast sensitivity. Proc Natl Acad Sci U S A. 1986;83(8):2755–2757. doi: 10.1073/pnas.83.8.2755. [DOI] [PMC free article] [PubMed] [Google Scholar]
- 50.Hess RF, Baker CL, Zrenner E, Schwarzer J. Differences between electroretinograms of cat and primate. J Neurophysiol. 1986;56(3):747–768. doi: 10.1152/jn.1986.56.3.747. [DOI] [PubMed] [Google Scholar]
- 51.Keltner JL, Johnson CA, Cello KE, et al. Classification of visual field abnormalities in the ocular hypertension treatment study. Arch Ophthalmol. 2003;121(5):643–650. doi: 10.1001/archopht.121.5.643. [DOI] [PubMed] [Google Scholar]
- 52.Hood DC, Xu L, Thienprasiddhi P, et al. The pattern electroretinogram in glaucoma patients with confirmed visual field deficits. Invest Ophthalmol Vis Sci. 2005;46(7):2411–2418. doi: 10.1167/iovs.05-0238. [DOI] [PubMed] [Google Scholar]
- 53.Parisi V, Manni G, Centofanti M, et al. Correlation between optical coherence tomography, pattern electroretinogram, and visual evoked potentials in open-angle glaucoma patients. Ophthalmology. 2001;108(5):905–912. doi: 10.1016/s0161-6420(00)00644-8. [DOI] [PubMed] [Google Scholar]
- 54.Bach M, Sulimma F, Gerling J. Little correlation of the pattern electroretinogram (PERG) and visual field measures in early glaucoma. Doc Ophthalmol. 1997;94(3):253–263. doi: 10.1007/BF02582983. [DOI] [PubMed] [Google Scholar]
- 55.Bach M, Birkner-Binder D, Pfeiffer N. In incipient glaucoma the pattern electroretinogram displays diffuse, retinal damage. Ophthalmologe. 1993;90(2):128–131. [PubMed] [Google Scholar]
- 56.Bach M, Hoffmann MB. Update on the pattern electroretinogram in glaucoma. Optom Vis Sci. 2008;85(6):386–395. doi: 10.1097/OPX.0b013e318177ebf3. [DOI] [PubMed] [Google Scholar]
- 57.Parisi V, Miglior S, Manni G, et al. Clinical ability of pattern electroretinograms and visual evoked potentials in detecting visual dysfunction in ocular hypertension and glaucoma. Ophthalmology. 2006;113(2):216–228. doi: 10.1016/j.ophtha.2005.10.044. [DOI] [PubMed] [Google Scholar]
- 58.Venzara FXI, Ventura LM, Porciatti V. Reversible Dysfunction of Retinal Ganglion Cells in Compressive and Non-Compressive Pituitary Tumors. Invest. Ophthalmol. Vis. Sci. 2007;48 2007; 48;E-Abstract 928. [Google Scholar]
- 59.Ventura LM, Golubev I, Mansuri O, et al. Head-Down Posture Induces PERG Alterations in Glaucoma Suspects. Invest. Ophthalmol. Vis. Sci. 2008;49(5):2876. [Google Scholar]


