

Abstract
Purpose
To improve our understanding of Stargardt disease by comparing structural changes seen on spectral domain optical coherence tomography (SD-OCT) to those visible on fundus autofluorescence (FAF).
Methods
FAF and SD-OCT were obtained on 22 eyes of 11 patients with Stargardt disease. SD-OCT images were obtained at the fovea and at the eccentric preferred retinal locus (PRL). The diameters of “absent” (hypo-autofluorescent) and “abnormal” FAF areas were measured. The extent of the transverse defect of the junction between the inner and outer segments of the photoreceptors (IS-OS) was measured in the foveal area. The PRL was evaluated with fundus photography and microperimetry.
Results
Twenty-one of 22 eyes showed defective FAF. For 17 eyes, FAF was absent in the fovea and for 4 eyes the FAF was abnormal. All eyes showed disorganization and/or loss of the IS-OS junction in the foveal area on SD-OCT. The diameter of the absent FAF area was smaller than the measurement of the IS-OS junction loss; the latter was closer to the diameter of the abnormal FAF area. Seventeen eyes had an eccentric PRL associated with a retinal area with no defects on FAF.
Conclusions
For the majority of eyes changes on SD-OCT correlated well with changes on FAF. However for 3 patients, photoreceptor abnormalities were seen in the fovea on SD-OCT without an equivalent abnormality on FAF. This suggests that for these patients, the structural integrity of the photoreceptors may be affected earlier than changes in the RPE at least as detected by FAF.
Stargardt disease is a form of macular degeneration that leads to a progressive loss of central visual function. It is most commonly inherited as an autosomal recessive trait but there are also families with dominantly inherited Stargardt-like disease. This genetically heterogeneous disease affects the retinal pigment epithelium (RPE) and photoreceptor layer and typically has an onset in childhood or young adulthood, although some patients develop symptoms of visual acuity loss as late as the fourth or even fifth decade of life.1-3 Stargardt disease (STGD) is caused by mutations in the gene encoding the photoreceptor cell-specific ATP-binding cassette transporter (ABCA4). The sequence of the disease process is not completely understood, however it has been proposed that a defective RIM protein encoded by the ABCA4 gene results in abnormal degradation of normal visual cycle by-products, leading to lipofuscin accumulation in the RPE.4 The accumulation of lipofuscin in RPE cells is toxic and this causes RPE and secondary photoreceptor degeneration.5,6
Fundus autofluorescence (FAF) has been shown to be useful for evaluating the extent of Stargardt disease. This non-invasive imaging technique enables the visualization of A2E and other bisretinoid components of lipofuscin in the RPE.7,8
Another useful non-invasive technique that provides morphologic information is spectral domain optical coherence tomography (SD-OCT). This technique has greatly improved visualization of the architecture of the retina in vivo, allowing the clinician to evaluate changes in the different layers of the retina with much greater accuracy. Recently, there have been a few studies and case reports on the use of SD-OCT and ultrahigh resolution OCT in the evaluation of the photoreceptor and RPE layers in the foveal region of patients with STGD. 9-13 In patients with central atrophy, these studies have demonstrated a loss of photoreceptors in the foveal region and a reduction in central foveal thickness. One study by Ergun et al.9 compared central transverse photoreceptor loss to the extent of atrophy on FAF and reported a significant correlation.
The purpose of this study was to analyze and compare changes visible on FAF with changes in the outer retina as evaluated with SD-OCT. As patients with Stargardt disease often adopt an eccentric preferred retinal location (PRL) for fixation14, we evaluated both the fovea and PRL. The aim was to improve our understanding of Stargardt disease by comparing structural changes to those visible on FAF.
Methods
Subjects
Twenty-two eyes of 11 consecutive patients (7 women, 4 men, median age of 30 years, range 12 to 65 years) with Stargardt disease were studied. Written informed consent was obtained from all subjects prior to their participation. The protocol was approved by the Columbia University Medical Center Institutional Review Board for Human Research and the procedures adhered to the tenets of the Declaration of Helsinki. All patients had a complete ophthalmic examination, including best corrected Snellen visual acuity (BCVA), biomicroscopy, applanation tonometry, and funduscopy.
Patients were excluded from the study if they had significant cataracts or other media opacities, and/or if they had other ocular diseases that could affect the results. All patients were screened in Dr. Allikmets’ laboratory for mutations in the ABCA4 gene with the ABCR400 microarray followed by direct sequencing to confirm identified variants as previously described.15-17 The ABCA4 genotyping microarray allows for simultaneous detection of all known ABCA4 variants in one reaction.
Procedures
Fundus autofluorescence images were obtained using a confocal scanning laser ophthalmoscope (Heidelberg Retinal Angiograph 2 [HRA2]; Heidelberg Engineering, Heidelberg, Germany). After pupil dilation with topical tropicamide and phenylephrine, FAF images of a rectangular 30×30-degree field of view were obtained with an ametropic corrector. An optically pumped solid state laser (488 nm) was used for excitation and emission over 500 nm was detected with a barrier filter. Standard procedure was followed for the acquisition of FAF images, including focus of the retinal image in the infrared reflection mode at 820 nm, sensitivity adjustment at 488 nm, and acquisition of 18 images, 9 images for each eye encompassing the macular area with at least a portion of the optic disc. To improve the signal-to-noise ratio the 9 images were aligned and a mean image with 768×768 pixels was calculated using HRA2 software, version 1.5.9.1. Measurements of the diameter of changes visible on FAF were performed using software from the HRA2 machine. We measured the diameter using a horizontal measuring tool passing through the center of the fovea. Two regions were defined, the area of ‘absent FAF’ and the area of ‘abnormal FAF’ (see Fig. 1A). The area of absent FAF was defined in the following way. The FAF images were analyzed in Adobe Photoshop (Adobe Systems Incorporated USA). The optic disc was used as the standard for ‘absent FAF’ as the lowest amount of FAF is seen in the disc in terms of gray scale values. We compared the gray scale values in the disc to those in the area of interest. For an area to be defined as an area of absent FAF it had to have values that were within three gray scale values of those found in the disc. The area of ‘abnormal FAF’ included the transition zone between the area of central atrophy and the area of normal FAF surrounding the central changes visible on the FAF exam.
Figure 1.
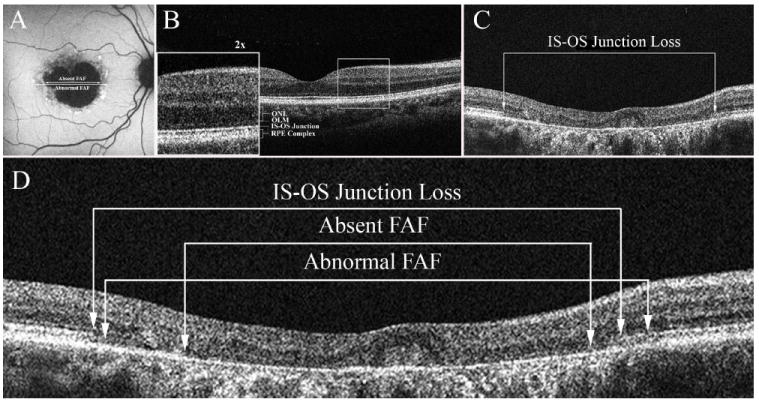
A-D: A: FAF image demonstrating the two measurements. The diameter of the central area of absent FAF corresponding to geographic atrophy and the diameter of abnormal FAF. B. SD-OCT image through the fovea of a normal control. C. SD-OCT image showing the extent of the transverse loss of the inner segment outer segment (IS-OS) junction of the photoreceptors in the foveal region (Patient 7) D. A comparison of the measurements obtained from FAF shown in A to those from SD-OCT for Patient 7.
Spectral domain optical coherence tomography (SD-OCT) images were obtained using the Cirrus Spectral Domain OCT from Zeiss (Carl Zeiss Meditec Inc., Dublin, CA, USA). The acquisition protocols included five-line raster scans, and macular cube 512 × 128. Three scans were performed on each eye, and the one with the best signal strength was selected for the final analysis. Horizontal scans were performed through the fovea and the patients’ PRL. An example of a SD-OCT horizontal scan through the fovea of a normal control eye is shown in Fig. 1B. The outermost hyper-reflective band seen on the SD-OCT image is believed to be due to Bruch′s membrane and the RPE.18,19 The next hyper-reflective band labeled the IS-OS junction in Fig. 1B is composed of the junction of the inner with the outer segments of the photoreceptors, the faint hyper-reflective band just above is the outer limiting membrane (OLM) and the next hypo-reflective band corresponds to the outer nuclear layer (ONL). The extent of the region over which the signal from the inner segment outer segment (IS-OS) junction was missing was determined using the measurement software from the Zeiss Cirrus SD-OCT machine (see Fig. 1C)
The PRL was evaluated with color fundus fixation photography and the MP-1 Microperimeter (Nidek Technologies Inc., Padova, Italy). A series of three 50° fundus photographs were obtained with a Zeiss 450 plus IR fundus camera. The PRL was then evaluated with the MP-1 following a period of adaptation (30 minutes) to dim room illumination.20 The patient was asked to fixate on a red cross (2° in diameter) and to maintain fixation on the center of this target for 30 seconds. The location of each subject’s PRL was referenced to the fovea and the distance and direction in millimeters was measured. The location of the foveal center was determined by using visible landmarks such as perifoveal capillaries or xanthophyll. In 12 eyes, it was difficult to localize the center of the fovea so it was approximated based on measurements relative to the optic disc in normal subjects using a method similar to that described by Rohrschneider 21 and Timberlake et al.22 The PRL measurements were converted into degrees.
To compare measurements obtained from FAF with those from SD-OCT, the images were scaled appropriately and the correspondence between the two types of images analyzed. This is illustrated in Fig 1D which shows the diameters of absent and abnormal FAF measured in Fig. 1A scaled and superimposed on the image of the horizontal line scan through the foveal region.
Statistical Analysis
Pearson’s correlation test (r) was used to analyze the relationship between the diameter of the IS-OS junction loss in the foveal area identified on SD-OCT and the diameter of the central area of absent FAF. The relationship between the diameter of IS-OS junction loss in the foveal area on SD-OCT and the diameter of the abnormal FAF area in the posterior pole was also analyzed. Because of the problem of correlation between eyes of an individual and the potential waste of information if only one eye of each patient was included in the statistical analysis, we separately analyzed the data from the right and left eye.23
Results
The clinical and genetic findings of the patients are summarized in Table 1. There were 7 women and 4 men ranging in age from 12 to 65 years. Snellen best corrected visual acuity ranged from 20/20 to 20/400 (LogMar equivalent 0 to 1.3), with 16 of the 22 eyes having an acuity of 20/50 or less (LogMar ≥ 0.4). Seventeen of the 22 eyes had an eccentric PRL, with the PRL located in the superior retina in 16 out of the 17 eyes and in the temporal retina in one eye. The remaining 5 eyes had foveal fixation. The eccentricity of the PRL from the fovea ranged from 1.8 degrees to 8.6 degrees. (See Table 1 for details.) Mutations were detected in 10 of the 11 patients. A disease causing mutation was identified in one allele of 4 patients and in both alleles of 6 patients.
Table 1.
Summary of Genetic and Selected Clinical Findings
| Visual Acuity (LogMar) | PRL degrees | PRL location | ||||||||
|---|---|---|---|---|---|---|---|---|---|---|
| Patient | Age | Sex | Allele 1 | Allele 2 | OD | OS | OD | OS | OD | OS |
| 1 | 12 | M | K346T | ND | 0.7 | 0.7 | 5.8 | 5.9 | S | S |
| 2 | 42 | M | ND | ND | 1.0 | 1.0 | 1.9 | 2.0 | S | S |
| 3 | 31 | M | G1961E | G1961E | 0.5 | 0.5 | 2.8 | 1.9 | S | S |
| 4 | 56 | M | P1380L | S1696N | 0.7 | 0.7 | 8.4 | 8.0 | S | S |
| 5 | 23 | F | L541P/A1038V | G1961E | 1.0 | 1.0 | 0.0 | 0.0 | F | F |
| 6 | 62 | F | D1532N, | G1961E | 1.3 | 0.4 | 3.0 | 0.0 | T | F |
| 7 | 65 | F | G1961E | ND | 0.3 | 1.3 | 4.0 | 2.0 | S | S |
| 8 | 30 | F | G1961E | ND | 0.4 | 0.4 | 2.9 | 3.0 | S | S |
| 9 | 24 | F | P1380L | P1380L | 0.3 | 0.3 | 8.6 | 8.5 | S | S |
| 10 | 15 | F | L541P/A1038V | G1961E | 0.0 | 0.0 | 0.0 | 0.0 | F | F |
| 11 | 20 | F | L541P/A1038V | ND | 0.3 | 0.4 | 1.8 | 2.0 | S | S |
Abbreviations: M, male; F, female; ND, not determined; S, superior; F, foveal; T, temporal.
Fundus autofluorescence
Twenty-one of the 22 eyes showed changes on FAF. In 17 of these eyes, FAF was absent over the foveal region, corresponding to areas of RPE atrophy visible on fundus examination (e.g. Fig. 2A). Areas of focally increased FAF (focal FAF) limited to the perifovea and areas of focally decreased FAF limited to the fovea were observed in 10 eyes (e.g. Fig. 2B). The more widespread changes with focal FAF extending up to the vascular arcades seen in Fig. 2C were observed in 2 eyes, and 5 eyes showed areas of focal FAF that extended past the arcades (see Fig. 2D). Four eyes showed only mottling on the foveal center without any other visible areas of hypo or hyperautofluorescence (e.g Fig. 2E). One eye was classified as having normal FAF and is shown in Fig. 2F.
Figure 2.
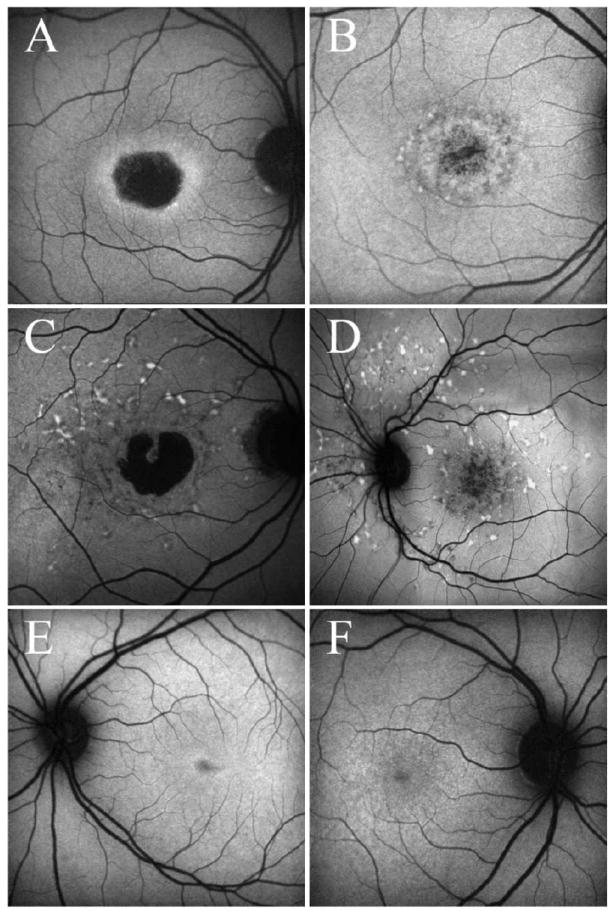
A-F: Examples of FAF images A. Absence of FAF in the fovea, corresponding to areas of RPE atrophy visible on fundus examination (Patient 3). B. Areas of hypo- and hyper-autofluorescence limited to the perifoveal area (Patient 8). C. Areas of focally increased autofluorescence (focal FAF) extending up to the vascular arcades (Patient 4). D. Areas of focal FAF extending past the arcades (Patient 2). E. Mottling on the foveal center without any other visible areas of hypo or hyperautofluorescence in the posterior pole (Patient 11) F. An apparently normal FAF examination (Patient 10).
Measurements of the diameters of the area of absent and abnormal FAF were performed on 21 eyes. The mean diameter of the central area of absent FAF was 1413 ± 1013 μm (median 1627 μm, range 0 to 3514 μm). The mean diameter of the central area of abnormal FAF was 2867 ± 1389 μm (median 3456 μm, range 0 to 4608 μm).
The retinal region underlying the eccentric PRL was also examined. The FAF images of the 17 eyes with an eccentric PRL showed that the PRLs were associated with retinal areas that either appeared to have normal FAF or were on the border of retinal areas showing increased FAF.
Spectral domain optical coherence tomography
On the SD-OCT images, disorganization or loss of the IS-OS junction was visible on all 22 eyes. Measurements of the IS-OS junction loss were obtained in 18 eyes. Four eyes were excluded, for 3 eyes the extent of the IS-OS junction loss was larger than the image obtained from SD-OCT and therefore could not be quantified and for one eye only disorganization was visible. The mean transverse extent of IS-OS junction loss in the fovea was 2853 ± 1294 μm (median 3024 μm, range 579 to 4251 μm).
The SD-OCT images obtained in the retinal region of the eccentric PRL of 17 eyes were also analyzed. One eye was discarded from the analysis due to marked unstable fixation. For 9 of these eyes there were no visible changes in the photoreceptor layer, the IS-OS junction showed no localized defects. Seven eyes showed loss of the IS-OS junction, which ranged in size from 1581 μm to 2479 μm. The extent of the IS-OS loss was smaller in the region of the PRL in all cases compared to the loss identified in the fovea; an example is shown in Fig. 3 where panel A shows the scan through the fovea and panel B a scan through the PRL. The hypo-reflective band corresponding to the ONL appears to be thinner in the region of the junction loss in Fig. 3B whereas it appears to be absent in Fig. 3A.
Figure 3.

A: FAF image and SD-OCT image through the fovea for patient 3. The white line shows the location of the SD-OCT scan. B. FAF image and SD-OCT image through the eccentric PRL for the same patient. The white line shows the location of the SD-OCT scan.
Comparison of SD-OCT and FAF images
Figure 4 shows examples of FAF and SD-OCT images obtained on one normal subject (panel A) and 3 patients (panels B-D). Figure 4B shows images obtained from a patient with a central area of RPE atrophy. This is visible on the FAF image as a region of absent (hypo-) FAF and on SD-OCT as a loss of the outer retinal layers. Only a thin hyper-reflective band remains in the fovea; it has been suggested that this corresponds to Bruch’s membrane.18,19 Figure 4C shows a focal decrease in FAF in the center of the fovea, but a clear absence of the photoreceptors in this area on SD-OCT. A rather unusual optical gap can be seen in this region of the outer segments. In addition, the ONL close to the area of photoreceptor loss is thinner, a sign of photoreceptor damage. The underlying band of the RPE complex is relatively preserved compared to the photoreceptor layer. Figure 4D shows a normal FAF image, but disorganization of the outer retinal layers is visible on SD-OCT. It should be noted that even though this patient had a visual acuity of 20/20, the amplitudes of the multifocal electroretinogram (mfERG) responses were markedly decreased throughout the central 10°. The mfERG measures local retinal activity and decreased response amplitudes are consistent with outer retinal deficits,24 suggesting that we are probably observing the initial stage of the disease.
Figure 4.
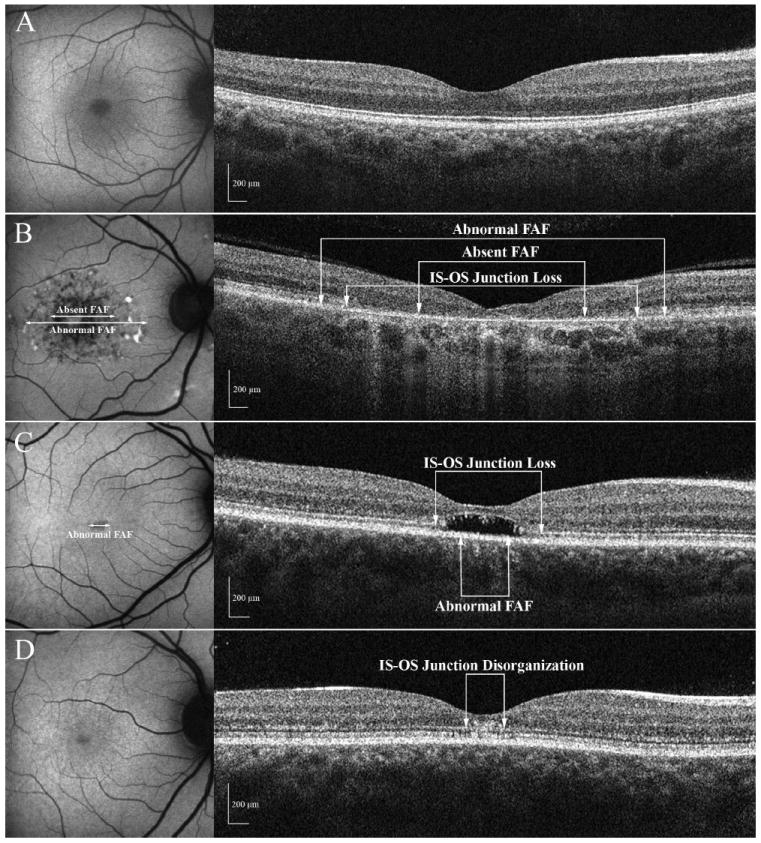
A-D: FAF and SD-OCT images for 3 patients and a normal control A. Images obtained from a control subject. B. The FAF shows an area of central atrophy and the SD-OCT image shows the loss of the IS-OS junction (Patient 6). C. The FAF shows only minimal changes and the SD-OCT image shows an area of localized loss of the photoreceptors (Patient 11) D. The FAF examination appears to be normal but disorganization of the outer retinal layers is visible on SD-OCT (Patient 10).
Comparison of SD-OCT and FAF measurements
A quantitative comparison of the extent of the IS-OS junction loss in the foveal area to the diameter of absent FAF is shown in Fig. 5A. While these measurements show a good correlation (rOD=0.88, rOS=0.87; p<.002), the diameter of the area of central atrophy identified by the absence of FAF underestimates the extent of the transverse loss of the IS-OS junction. On the other hand, the diameter of the area of abnormal FAF is closer to the transverse extent of IS-OS loss as shown by the proximity of the points to the line of slope 1.0 in Fig. 5B. In addition, the correlation between the measurements is slightly higher (rOD=0.94, rOS=0.97; p<.0001).
Figure 5.
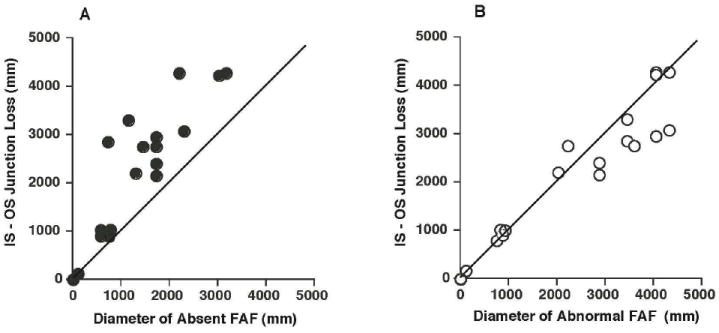
A: A comparison between the extent of the IS-OS junction loss on SD-OCT and the diameter of the hypoautofluorescent/absent FAF area. B. A comparison between the transverse IS-OS junction loss on SD-OCT and the diameter of the area of abnormal FAF.
Discussion
Our purpose was to compare changes visible on FAF with structural changes in the RPE and photoreceptor layers evaluated with SD-OCT. Twenty-one of the 22 eyes we studied showed changes on FAF in the foveal region, and all eyes showed disorganization or loss of the IS-OS junction on SD-OCT. When we compared the diameter of absent FAF to the extent of the IS-OS junction loss in the macula, we found that it was smaller for all but 3 eyes. That is, the measurement of the diameter of absent FAF underestimated the extent of the IS-OS junction loss. However when the transition zone of abnormal FAF surrounding the central area of absent FAF (i.e. the region between absent FAF and normal FAF) was included, we found that this measurement, the diameter of abnormal FAF, more closely approximated the IS-OS junction loss measurement.
How do we reconcile these findings with the current views about Stargardt disease and FAF? Concerning Stargardt disease, although the sequence of the disease process is not completely understood, it is commonly assumed that the primary event in Stargardt disease is a degeneration of the RPE with the photoreceptors being involved when the RPE fails.4 There is an accumulation of lipofuscin in the RPE; this is believed to be toxic for the RPE cells and results in RPE cell loss. 5,6 Defects of the photoreceptors are a result of the pathologic RPE.10 Concerning FAF, we assume that decreased or absent FAF in Stargardt disease represents RPE loss or atrophy, while increased FAF indicates that RPE is present, but is functioning abnormally. The interpretation of our findings, in light of these assumptions, depends upon the nature of IS-OS junction loss.
If we assume that IS-OS junction loss means that the photoreceptors are not functioning, then our finding that the region of IS-OS loss is larger than the region of absent FAF (Fig. 5A) suggests that photoreceptor OS loss can precede RPE loss in Stargardt disease. Additional support for this view comes from our observation of 4 eyes that showed an absence of photoreceptor outer segments on SD-OCT, but showed little or no hypo-FAF. Figure 4C illustrates this finding. There is photoreceptor loss in the center of the fovea with an unusual optical gap in the place of the outer segments. In addition, the ONL in the center of the fovea is markedly thinner than normal (see Fig. 4A); further evidence of photoreceptor loss. Differences in ONL thickness accompanying the disruption of the photoreceptor IS-OS segment junction have previously been described using ultrahigh-resolution OCT,11 as has the absence of photoreceptors and disruption of the photoreceptor layer in the central foveal region that we observed on SD-OCT.10 The major retinal structures pictured with ultrahigh-resolution technology are reported to correspond with lower resolution devices such as the Stratus OCT25, therefore we suspect that our observations of the optical gap and thinning seen on SD-OCT represent early ONL damage. Lastly we identified one eye of a patient, presumably at the initial stage of the disease, who had a normal FAF examination, but showed disorganization of the outer retinal layers, including the photoreceptor layer, on SD-OCT (see Fig. 4D). On mfERG testing markedly decreased response amplitudes were recorded in the central 10°. The mfERG measures local retinal activity and decreased response amplitudes are consistent with outer retinal deficits. 24 These findings suggest that degeneration of the photoreceptors might occur earlier than changes in RPE in Stargardt disease at least as identified by FAF. This would mean that photoreceptor function is directly affected by mutations in the ABCA4 gene and that RPE damage contributes to the degenerative process, but is not necessarily the only causative factor.
Alternatively, suppose we assume that the receptors are functioning, although perhaps abnormally, in regions of the IS-OS junction loss. Under this assumption, we need not reject the commonly made assumption regarding Stargardt disease that RPE loss precedes the OS loss. For example, the photoreceptors could be functioning, but the ability to image them could be reduced for some optical reason; the signal from the IS-OS junction could be reduced or missing. This may occur if the photoreceptors were disarrayed or if the lengths of the OSs varied in the region being imaged. Although we are using the generally accepted boundaries in images of the normal eye, we are aware that the interpretation of the IS-OS junction loss in the diseased eye requires additional assumptions (see Chang, Koizumi, Spade26). Our findings with SD-OCT of IS-OS junction loss, photoreceptor loss in the central foveal area and ONL thinning are in agreement with previous studies of Stargardt patients using high-resolution OCT. 9,10
Our findings, although based on a small number of patients, also have implications for the clinician, because they demonstrate that FAF might appear to be normal or show only minor changes in the initial phase of the disease, even when structural changes are already present and visible on SD-OCT.
In addition to our examination of the foveal area, we also compared FAF and SD-OCT images in retinal areas underlying the eccentric PRL. We observed that eccentric PRLs were associated with regions that either did not show evidence of localized defects on FAF or as shown in Fig 3B were on the border of a region showing increased FAF. SD-OCT analysis revealed that photoreceptor disorganization or loss in this region was less than that observed in the patients’ fovea. This suggests that the patients adopt an eccentric PRL associated with an underlying retinal region that more closely resembles normal retina.
In conclusion, for the majority of eyes changes in the photoreceptor layer seem to correlate well with the changes identified on FAF. However 3 patients showed changes in the fovea on SD-OCT without an equivalent abnormality on FAF; this has implications for the clinical use of SD-OCT as compared with FAF in the early diagnosis of the disease. In addition this finding suggests that for these 3 patients, the structural integrity of the photoreceptors may be affected earlier than changes in the RPE at least as detected by FAF.
Acknowledgments
The authors thank Dr. Allikmets and the members of his laboratory for providing the information regarding the genetic mutations.
Supported in part by grants from the National Eye Institute EY09076, EY02115, EY018213, Burroughs-Wellcome Program in Biomedical Sciences, Charles Culpeper Scholarship, Irma T. Hirschl CharitableTrust, Schneeweiss Stem Cell Fund, Joel Hoffmann Foundation, Crowley Research Fund, Eye Surgery Fund, Bernard Becker-Association of University Professors in Ophthalmology, Starr Foundation, Research to Prevent Blindness (RPB), New York, NY and the Foundation Fighting Blindness.
Footnotes
Presented in part at the Annual Meeting of the Association for Research in Vision and Ophthalmology, Fort Lauderdale, Fl, May 2008
References
- 1.Rotenstreich Y, Fishman GA, Anderson RJ. Visual acuity loss and clinical observations in a large series of patients with Stargardt’s disease. Ophthalmology. 2003;110:1151–1158. doi: 10.1016/S0161-6420(03)00333-6. [DOI] [PubMed] [Google Scholar]
- 2.Armstrong JD, Meyer D, Xu S, et al. Long-term follow-up of Stargardt’s disease and fundus flavimaculatus. Ophthalmology. 1998;105:448–458. doi: 10.1016/S0161-6420(98)93026-3. [DOI] [PubMed] [Google Scholar]
- 3.Fishman GA, Farber M, Patel BS, et al. Visual acuity loss in patients with Stargardt’s macular dystrophy. Ophthalmology. 1987;94:809–814. doi: 10.1016/s0161-6420(87)33533-x. [DOI] [PubMed] [Google Scholar]
- 4.Glazer LC, Dryja TP. Understanding the etiology of Stargardt’s disease. Ophthalmol Clin North Am. 2002;15(1):93–100. doi: 10.1016/s0896-1549(01)00011-6. [DOI] [PubMed] [Google Scholar]
- 5.Cideciyan AV, Aleman TS, Swider M, et al. Mutations in ABCA4 result in accumulation of lipofuscin before slowing of the retinoid cycle: a reappraisal of the human disease sequence. Hum Mol Genet. 2004 Jan;13(5):525–34. doi: 10.1093/hmg/ddh048. [DOI] [PubMed] [Google Scholar]
- 6.Molday RS. ATP-binding cassette transporter ABCA4: molecular properties and role in vision and macular degeneration. J Bioenerg Biomembr. 2007;39(56):507–17. doi: 10.1007/s10863-007-9118-6. [DOI] [PubMed] [Google Scholar]
- 7.Von Ruckmann A, Fitzke FW, Bird AC. In vivo autofluorescence in macular dystrophies. Arch Ophthalmol. 1997;115:609–615. doi: 10.1001/archopht.1997.01100150611006. [DOI] [PubMed] [Google Scholar]
- 8.Lois N, Halfyard AS, Bird AC, Holder GE, et al. Fundus autofluorescence in Stargardt macular dystrophy-fundus flavimaculatus. Am J Ophthalmol. 2004;138(1):55–63. doi: 10.1016/j.ajo.2004.02.056. [DOI] [PubMed] [Google Scholar]
- 9.Ergun E, Hermann B, Wirtitsch M, Unterhuber A, Ko TH, Sattmann H, Scholda C, Fujimoto JG, Stur M, Drexler W. Assessment of central visual finction in Stargardt’s disease/fundus flavimaulatus with ultralhigh-resolution optical coherence tomography. Invest Ophthalmol Vis Sci. 2005;46:310–6. doi: 10.1167/iovs.04-0212. [DOI] [PubMed] [Google Scholar]
- 10.Wirtitsch MG, Ergun E, Hermann B, Unterhuber A, Stur M, Scholda C, Sattmann H, Ko TH, Fujimoto JG, Drexler W. Ultrahigh resolution optical coherence tomography in macular dystrophy. Am J Ophthalmol. 2005;140:976–983. doi: 10.1016/j.ajo.2005.06.029. [DOI] [PubMed] [Google Scholar]
- 11.Srinivasan VJ, Wojtkowski M, Witkin AJ, Duker JS, Ko TH, Carvalho M, Schuman JS, Kowalczyk A, Fujimoto JG. High-definition and 3-dimensional imaging of macular pathologies with high-speed ultrahigh-resolution optical coherence tomography. Ophthalmology. 2006;113:2054–65. doi: 10.1016/j.ophtha.2006.05.046. [DOI] [PMC free article] [PubMed] [Google Scholar]
- 12.Gerth C, Zawadzki RJ, Choi SS, Keltner JL, Park SS, Werner JS. Visualization of lipofuscin accumulation in Stargardt macular dystrophy by high-resolution Fourier-domain optical coherence tomography. Arch Ophthalmol. 2007;125:575. doi: 10.1001/archopht.125.4.575. [DOI] [PubMed] [Google Scholar]
- 13.Lim JI, Tan O, Fawzi AA, Hopkins JJ, Gil-Flamer JH, Huang D. A pilot study of Fourier-domain optical coherence tomography of retinal dystrophy patients. Am J Ophthalmol. 2008;146:417–426. doi: 10.1016/j.ajo.2008.05.018. [DOI] [PMC free article] [PubMed] [Google Scholar]
- 14.Messias A, Reinhard J, Velasco e Cruz AA, et al. Eccentric fixation in Stargardt’s disease assessed by Tübingen perimetry. Invest Ophthalmol Vis Sci. 2007;48(12):5815–22. doi: 10.1167/iovs.06-0367. [DOI] [PubMed] [Google Scholar]
- 15.Jaakson K, Zernant J, Kulm, et al. Genotyping microarray (gene chip) for the ABCR (ABCA4) gene. Hum Mutat. 2003;22:395–403. doi: 10.1002/humu.10263. [DOI] [PubMed] [Google Scholar]
- 16.Zernant J, Külm M, Dharmaraj S, et al. Genotyping microarray (disease chip) for Leber congenital amaurosis: detection of modifier alleles. Invest Ophthalmol Vis Sci. 2005;46:3052–9. doi: 10.1167/iovs.05-0111. [DOI] [PubMed] [Google Scholar]
- 17.Kurg A, Tonisson N, Georgiou I, et al. Arrayed primer extension: solid-phase four color DNA resequencing and mutation detection technology. Genet Test. 2000;4:1–7. doi: 10.1089/109065700316408. [DOI] [PubMed] [Google Scholar]
- 18.Michels S, Pircher M, Geitzenauer W, et al. Value of polarisation-sensitive optical coherence tomography in diseases affecting the retinal pigment epithelium. Br J Ophthalmol. 2008;92:204–209. doi: 10.1136/bjo.2007.130047. [DOI] [PubMed] [Google Scholar]
- 19.Fleckenstein M, Charbel Issa P, Helb HM, et al. High resolution spectral domain-OCT imaging in geographic atrophy associated with age related macular degeneration. Invest Ophthalmol Vis Sci. 2008 May 16; doi: 10.1167/iovs.08-1967. Epub ahead of print. [DOI] [PubMed] [Google Scholar]
- 20.Midena E, Radin PP, Pilotto E, et al. Fixation patterns and macular sensitivity in eyes with subfoveal choroidal neovascularization secondary to age-related macular degneration. A microperimetry study. Semin Ophthalmol. 2004;19:55–61. doi: 10.1080/08820530490882896. [DOI] [PubMed] [Google Scholar]
- 21.Rohrschneider K. Determination of the location of the fovea on the fundus. Invest Ophthalmol Vis Sci. 2004;45(9):3257–8. doi: 10.1167/iovs.03-1157. [DOI] [PubMed] [Google Scholar]
- 22.Timberlake GT, Sharma MK, Grose SA, et al. Retinal location of the preferred retinal locus relative to the fovea in scanning laser ophthalmoscope images. Optom Vis Sci. 2005;82(3):177–85. doi: 10.1097/01.opx.0000156311.49058.c8. [DOI] [PubMed] [Google Scholar]
- 23.Murdoch IE, Morris SS, Cousens SN. People and eyes: statistical approaches in ophthalmology. Br J Ophthalmol. 1998;82(8):971–3. doi: 10.1136/bjo.82.8.971. [DOI] [PMC free article] [PubMed] [Google Scholar]
- 24.Hood DC, Frishman LJ, Saszik S, Viswanathan S. Retinal origins of the primate multifocal ERG: implications for the human response. Invest Ophthalmol Vis Sci. 2002;43:1673–85. [PubMed] [Google Scholar]
- 25.Ko TH, Fujimoto JG, Schuman JS, Paunescu LA, Kowalevicz AM, Hartl I, Drexler W, Wollstein G, Ishikawa H, Duker JS. Comparison of ultrahigh- and standard-resolution optical coherence tomography for imaging macular pathology. Ophthalmology. 2005;112:1922.e1–15. doi: 10.1016/j.ophtha.2005.05.027. [DOI] [PMC free article] [PubMed] [Google Scholar]
- 26.Chang LK, Koizumi H, Spaide RF. Disruption of the photoreceptor inner segment-outer segment junction in eyes with macular holes. Retina. 2008;28:969–75. doi: 10.1097/IAE.0b013e3181744165. [DOI] [PubMed] [Google Scholar]