Abstract
Rationale and Objectives
The purpose of this study was to evaluate prospectively a gadolinium-based perfusion technique for intrarenal blood flow in transplanted kidneys and to determine if magnetic resonance (MR) measurements of intrarenal perfusion could be used to differentiate between normal-functioning kidney allografts and allografts with acute tubular necrosis (ATN) or acute rejection.
Materials and Methods
Twenty-one subjects were enrolled within four months of receiving a kidney transplant. A biopsy was performed on subjects to diagnose each allograft as having either ATN or acute rejection. A group of subjects with normal functioning transplants were also enrolled in our study. MR perfusion images were acquired on a 1.5T MRI system within 48 hours after biopsy using an echo planar, T2*-weighted sequence and an injection of gadodiamide contrast agent administered at a dose of 0.1mmol/kg. Scan parameters were: TR/TE/flip=1000msec/30msec/60°, FOV=340×340mm, matrix=128×64, slice thickness=10mm, and temporal resolution=1.0sec. Cortical and medullary blood flow values were calculated.
Results
Medullary blood flow values were significantly (p=0.02) lower in allografts undergoing acute rejection (121±41 mL/100g/min) compared to normal-functioning allografts (221±96 mL/100g/min) and those with ATN (247±124 mL/100g/min). Cortical blood flow values were also significantly (p=0.03) reduced in allografts with acute rejection (243±116 mL/100g/min) compared to those with normal function (413±116 mL/100g/min).
Conclusion
Preliminary results indicate that MR perfusion techniques may provide a means of determining noninvasively the viability of renal allografts, potentially alleviating the need for biopsy in some patients.
Keywords: rejection, perfusion, functional MRI, transplant, allograft
Introduction
Kidney transplantation has become the preferred method of kidney replacement therapy since the first successful transplant more than 50 years ago [1]. Although advances in surgical techniques and immunosuppressive therapy have resulted in 1-year graft survival rates exceeding 90 percent, graft dysfunction in the early post-transplant period remains a serious clinical problem and an important factor in determining the ultimate fate of the allograft [1-3]. Graft dysfunction in the early post-transplant period results from a variety of causes, including cyclosporine toxicity, infection, vascular compromise, ureteral obstruction, acute tubular necrosis (ATN), and acute rejection [4, 5]. The compounding effects of acute rejection plus delayed graft function (DGF – defined as the need for dialysis during the first week post-transplantation) in the transplant course are devastating. Ojo et al. noted that individuals with acute rejection and DGF had a 5-year graft survival of only 35 percent [3]. Thus, early dysfunction can dramatically influence long-term graft outcomes.
Clinically, a distinction can be made between many of the causes of allograft dysfunction, e.g. cyclosporine toxicity can be distinguished from infectious causes on the basis of clinical assessment and laboratory testing. Also, magnetic resonance (MR) imaging or ultrasound can be used to determine if vascular compromise and ureteral obstruction are present. However, it is difficult to differentiate ATN from acute rejection, as both have similar radiographic and laboratory findings. Currently, biopsy is the only means of differentiating between these two types of dysfunction, yet it has the disadvantages of potential complications and sampling error.
MR imaging is a powerful tool for examining the kidney. MR images depict kidney structure, which allows for the visualization of the integrity of the cortex and medulla, the size of the kidney, and any potential extra-renal abnormalities. MR imaging also may be used to map the renal vasculature and diagnose vascular anomalies, such as renal artery stenosis [6]. Newer MR imaging techniques can be used to assess the filtration capacity of glomeruli, blood flow within the kidneys, and oxygen bioavailability [7-9].
Despite the potential of MR imaging as a non-invasive, comprehensive method of assessing the kidneys, it currently is not used in the routine evaluation of transplanted kidneys. Sadowski et al. demonstrated that blood oxygen level-dependent (BOLD) MR imaging can effectively be used to assess the function of transplanted kidneys [10]. Numerous studies have assessed total renal blood flow in the renal artery with phase contrast exams [11-14], but such information does not provide regional blood flow measurements. To date, gadolinium-based MR studies of cortical and medullary blood flow have been performed in humans and animals – both in normal-functioning native kidneys and in those with vascular pathology [15, 16]. However, descriptions of gadolinium-based MR perfusion studies performed on transplanted kidneys are scarce in the literature. Most studies have been conducted on animals or have focused on qualitative or semi-quantitative calculations using the peak intensity measurement and slope of the enhancement curves [17-22]. Techniques using peak intensities as a surrogate for perfusion may not be comparable from scanner to scanner and site to site. To our knowledge, this is the first study to measure regional values of cortical and medullary tissue perfusion in transplanted kidneys using gadolinium-based MR techniques. The method used in this study employs time-concentration curves (derived from dynamic susceptibility contrast produced by the passage of a gadolinium-based contrast material) and the central volume principle to calculate blood flow in milliliters per 100 grams of tissue per minute (mL/100g/min). This gadolinium-based MR technique provides regional values of perfusion within the kidney.
In this study, a gadolinium-based MR perfusion method is applied to a population of patients prospectively with normal and dysfunctional kidney allografts. The purpose of this study was to evaluate the feasibility of a gadolinium-based MR perfusion technique for noninvasive evaluation of intrarenal blood flow in normal-functioning transplanted kidneys and allografts with acute tubular necrosis (ATN) or acute rejection.
Materials and Methods
Subjects
This study was approved by our institutional human subjects review committee and written informed consent was obtained from all subjects. This study was also HIPAA-compliant. Between June, 2003 and September, 2004, gadolinium-based MR perfusion measurements were performed on 21 subjects with recently transplanted kidneys. All subjects were less than four months post-transplantation at the time of study. All subjects refrained from water or intravenous fluid intake for four hours prior to the MR perfusion exam. In sixteen subjects who underwent clinically-indicated biopsy (21 total subjects minus 5 subjects with normal-functioning kidneys in whom biopsy was not indicated as determined by the transplant nephrologist), the MR perfusion exam was performed within 48 hours after the biopsy. No treatment that would affect renal blood flow was administered between the time of biopsy and the time of the MR exam. Biopsy results were not provided beforehand to the individuals analyzing the MR perfusion data.
The demographics of the patient studies are summarized in Table 1. The patient population consisted of thirteen males and eight females ranging in age from 21 to 70 years. Four of the subjects who were biopsied were excluded from the study. One subject could not complete the MR exam due to the inability to lie in the supine position for the entire exam. One subject was excluded due to an underlying polyomavirus infection, discovered after the MRI had been performed. Two subjects were excluded for technical reasons (improper placement of the slice transecting the artery to be used for the arterial input function). The total exam time was between 45 – 60 minutes, which included setup, scout, and perfusion-weighted image acquisitions.
Table 1.
Subject demographics, serum markers and blood flow values measured by MRI for subjects with normal-functioning transplanted kidneys and transplanted kidneys undergoing ATN or acute rejection.
| Kidney Transplants | Normal-functioning | ATN | Rejection |
|---|---|---|---|
| n | 5 | 4 | 8 |
| Deceased Donor | 4 | 4 | 7 |
| Living Related Donor | 1 | 0 | 2 |
| Age (years) | 43 ± 10 | 49 ± 11 | 49 ± 12 |
| Creatinine (mg/dL) | 1.6 ± 0.4 | 3.5 ± 2.0 | 4.1 ± 2.0 |
| Hematocrit (%) | 36 ± 6 | 32 ± 3 | 31 ± 6 |
| Mean Medullary Blood Flow (mL/100g/min) | 221 ± 96 | 247 ± 124 | 121 ± 41 |
| Mean Cortical Blood Flow (mL/100g/min) | 413 ± 116 | 377 ± 152 | 243 ± 116 |
ATN = acute tubular necrosis
All subjects had induction therapy with alemtuzumab, basiliximab, thymoglobulin, or anti-thymocyte globulin prior to transplantation. Subjects were maintained on either two agents (prednisone plus mycophenolate mofetil) or triple immunosuppression (prednisone plus mycophenolate mofetil or azathioprine plus cyclosporine or tacrolimus or sirolimus) after transplantation.
Normal function and graft dysfunction were determined by the transplant nephrologist according to patient presentation and changes in serum creatinine from baseline. Cases of graft dysfunction caused by cyclosporine toxicity, infection, vascular compromise, and ureteral obstruction were excluded by clinical, laboratory, and imaging tests. Ultrasound was performed prior to biopsy to exclude hydronephrosis, perirenal fluid collections, and vascular occlusion. The indications for biopsy early after transplantation included an increasing serum creatinine or β2-microglobulin level in the absence of other causes of transplant dysfunction. Two 18-gauge biopsy cores were taken under ultrasound guidance at the time of biopsy by the transplant nephrologist. One 18-gauge core was used entirely for histological assessment. Half of the second core was paraffin-embedded for immunohistochemistry. The other half of the second core was stored at -70° C for additional mRNA studies. C4d immunostaining was performed on each sample as per the standard of care at our institution.
The final analysis included five subjects with normal function, eight with acute rejection, and four with ATN. The clinically normal-functioning transplants were identified by laboratory evaluation and by the consulting transplant nephrologist but were not biopsied. The subjects with transplants undergoing acute rejection and those undergoing ATN were determined by clinically-indicated percutaneous renal transplant biopsy. Four out of five subjects in the normal-functioning group, seven out of eight subjects in the acute rejection group, and all four subjects in the ATN group had deceased donor kidney transplants. The remaining subjects had living related donor transplants. Mean creatinine and hematocrit were also measured in all patients and compared to MRI-based perfusion measures.
MR Perfusion Technique
Perfusion imaging was performed on a 1.5 T MRI system (Signa HD Excite, GE Healthcare, Waukesha, WI) using a T2*-weighted, echo planar imaging (EPI) sequence applied during an injection of 0.1 mmol/kg gadodiamide contrast agent at 3 cc/sec (Omniscan, GE Healthcare, Princeton, NJ). Subjects were asked to hold their breath for the first 30 seconds of the acquisition and then were allowed to breathe freely for another 140 seconds while the acquisition continued. The extended acquisition was performed to allow evaluation of the contrast kinetics in the medulla. The scanning parameters were as follows: TR/TE = 1000/30 msec, flip angle = 60°, FOV = 340 × 340 mm, matrix = 128 × 64, slice thickness = 10 mm, and temporal resolution = 1.0 sec. Three slices were imaged per transplanted kidney. A T1-weighted gradient echo sequence was used to evaluate anatomy and to localize the perfusion EPI images with parameters: TR/TE/flip 87ms/8ms/40°, 256×256 acquisition matrix, and 34×34 cm acquisition FOV. The slices were oriented to demonstrate the long axis of the kidney and were prescribed such that one of the three slices transected the renal artery or the aorta.
MR Perfusion Calculations
All MR perfusion exams were analyzed using custom scripts written in MATLAB (MATLAB version 7.0, The MathWorks Inc., Cambridge, MA, USA) that performed the perfusion calculations described in the Theory section. Regions of interest (ROIs) were defined in a proximal major artery (either in the renal artery or in the aorta superior to the branching of the renal arteries). Regions of interest also were placed at various locations within both the renal cortex and the renal medulla as shown in Figure 1a and were manually registered for those frames acquired after the loss of breathhold. The sizes of the ROIs were on the order of 10 pixels. A total of four ROIs were placed in the medulla and in the cortex for each of the three slices imaged per exam. The number of ROIs defined per slice was limited in some patients due to susceptibility-induced artifacts from bowel gas. Placement of the ROIs in the medulla and cortex was aided by examining the T1-weighted anatomical images (Fig. 1b). Renal blood flow (RBF) values were converted to units of mL/min/100g by assuming that the hematocrit level was kappa = 0.73 (see Appendix: Theory) and that the tissue density was 1.04 g/mL. The mean and standard deviation of each ROI was recorded. The means over the cortical and medullary ROIs for a given allograft were used for calculating the group means and standard deviations (SD) and for comparisons between groups.
Figure 1.
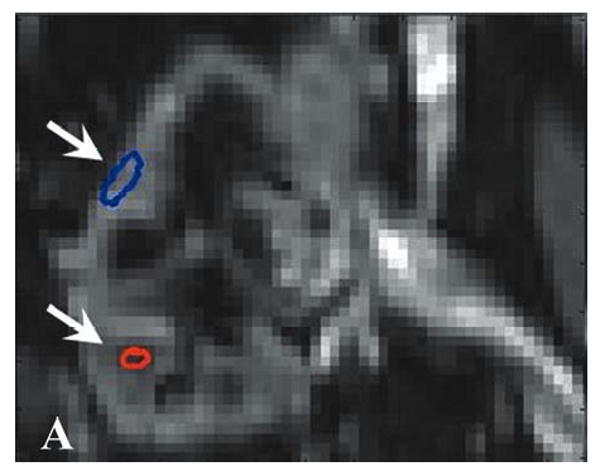
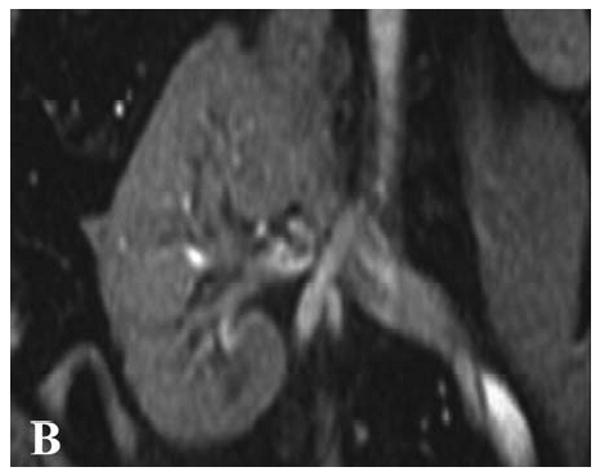
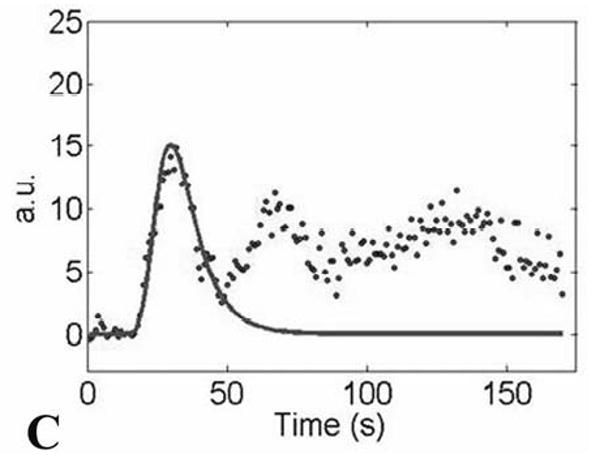
(A) Gradient-echo single shot echo-planar image (TR/TE/flip = 1000 ms/30 ms/60°, 128 × 64 acquisition matrix, 34 × 34 cm acquisition FOV) illustrating ROI placement over the medulla (lower signal regions; lower arrow) and cortex (higher signal regions; upper arrow) of a normal-functioning allograft. (B) T1-weighted gradient-echo image of the same region for reference (TR/TE/flip = 87ms/8ms/40°, 256×256 acquisition matrix, 34×34 cm acquisition FOV). The left iliac vein and portion of the abdominal aorta are also seen. Measured concentration versus time data, Cm(t) (C; dotted distribution), and fit curves, Ctiss(t) (C; solid line), associated with the cortical ROI.
Statistical Analysis
Creatinine and mean cortical and medullary blood flow values were compared using a two-sample equal variance Student's t-test with a significance level set at p = 0.05 for the following groups: normal versus acute rejection, normal versus ATN, and acute rejection versus ATN. Bar graphs were prepared from the mean cortical and medullary blood flow values and a scatter plot was created for medullary perfusion measurements for each of the seventeen patients. To better understand the feasibility of MR-measured perfusion to discriminate between allograft pathologies, we identified thresholds graphically. The sensitivity and specificity of these thresholds were computed.
Correlation between cortical and medullary blood flow derived from MR imaging, creatinine, and hemoglobin were determined by calculating the Pearson correlation coefficient and statistical significance was set at p = 0.05. Correlations with significant p-values were plotted and fitted with a linear line.
Results
Transplant recipient demographics, serum biomarkers, and results of the blood flow measurements from the cortex and medulla of transplanted kidneys are summarized in Table 1, reported as mean ± SD. Mean creatinine was 1.6 ± 0.4 mg/dL in the normal-functioning group, 3.5 ± 2.0 mg/dL in the ATN group, and 4.1 ± 2.0 mg/dL in the acute rejection group. Hematocrit was 36 ± 6 % for the normal-functioning group, 32 ± 3 % for the ATN group, and 31 ± 6 % in the acute rejection group. The mean medullary blood flow measurements were 221 ± 96 for the normal-functioning, 247 ± 124 for the ATN, and 121 ± 41 mL/100g/min for the acute rejection groups. The mean cortical blood flow measurements were 413 ± 116 for the normal-functioning, 377 ± 152 for the ATN, and 243 ± 116 mL/100g/min for the acute rejection groups.
The blood flow measurements in the cortex and medulla were significantly decreased in allografts with acute rejection compared with normal-functioning allografts (p = 0.03 for the cortex and p = 0.02 for the medulla; Figs. 2 and 3). The medullary blood flow measurements were also significantly decreased in the acute rejection group compared to the group with ATN (p = 0.02; Fig. 3). Cortical blood flow measurements were not statistically different between the ATN and acute rejection groups (Fig. 2). Creatinine levels in individuals with acute rejection were significantly higher than individuals with normal-functioning kidneys (p = 0.01). Creatinine levels were not significantly different between normal-functioning kidneys and allografts with ATN (p = 0.14) and between allografts with ATN and acute rejection (p = 0.61).
Figure 2.
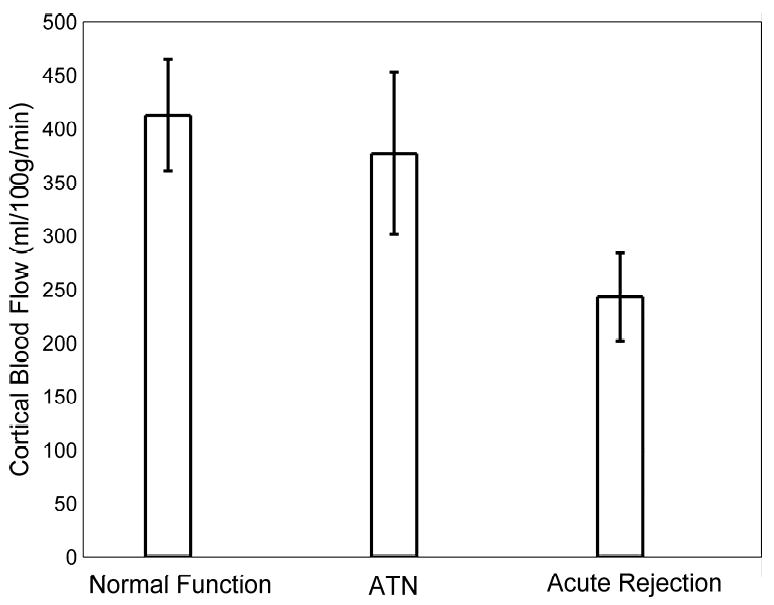
Bar graph of mean measured cortical blood flow values in transplanted kidneys with normal function, ATN, and acute rejection as measured by MRI. Note the decrease in cortical blood flow in allografts undergoing acute rejection. Differences in cortical blood flow were statistically significant between normal-functioning allografts and those with acute rejection (p = 0.03). Error bars depict the standard error of the mean for each group.
Figure 3.
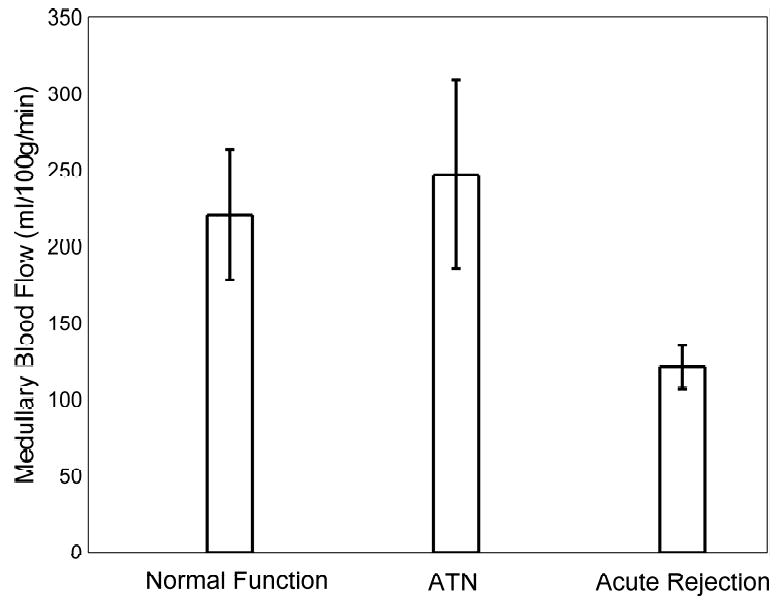
Bar graph of the mean measured medullary blood flow values in transplanted kidneys with normal function, ATN, and acute rejection as measured by MRI. Note the decrease in medullary blood flow in allografts undergoing acute rejection. The difference in the mean medullary blood flow values of acute rejecting transplanted kidneys and those with both normal function (p = 0.02) and ATN (p = 0.02) are statistically significant. Error bars depict the standard error of the mean for each group.
To better assess the feasibility of MR perfusion to differentiate between transplanted kidneys with normal function, ATN, and acute rejection, thresholds were identified for discriminating between these groups. For blood flow measurements in the medulla, 8/8 (100%) of allografts with acute rejection had values below 200 mL/100g/min, while only 1/4 (25%) of allografts with ATN and only 1/5 (20%) of the normal-functioning allografts had values below this threshold (Fig. 4a). A threshold of 200 mL/100g/min yielded a sensitivity of 0.78 and a specificity of 1.00 for distinguishing acute rejection from ATN and normal allografts. Perfusion thresholds on cortical blood flow measurements did not diagnose individual allografts as accurately as medullary perfusion measurements (Fig. 4b). A threshold of 325 mL/100g/min yielded a sensitivity of 0.78 and a specificity of 0.75 for distinguishing acute rejection from ATN and normal allografts.
Figure 4.
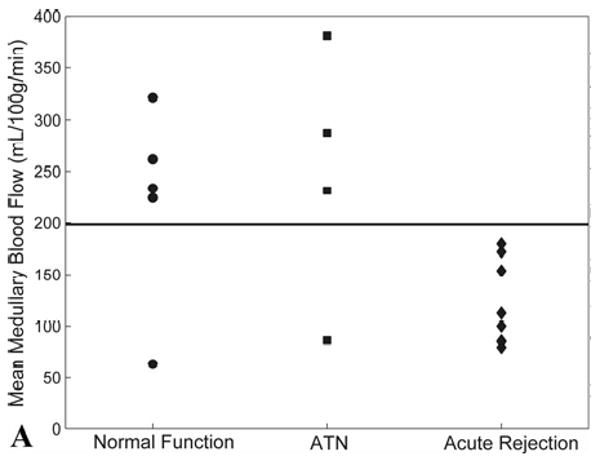
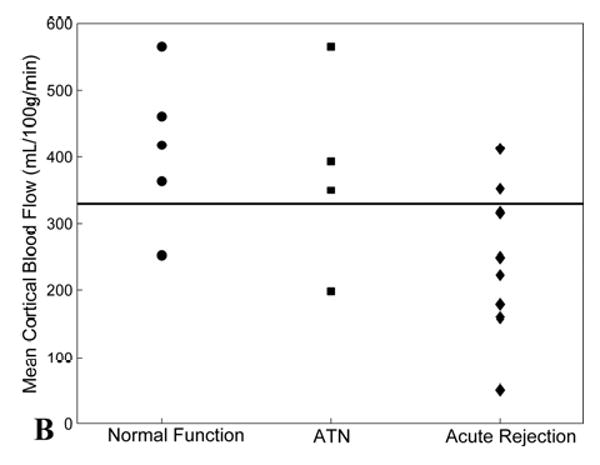
(A) Scatter plot of mean medullary blood flow values measured by MRI from individual transplanted kidneys with normal function, ATN, and acute rejection. Note the blood flow in the medulla of all transplanted kidneys with acute rejection is below the threshold value of 200 mL/100g/min (solid line). Two allografts, one with normal function and one with ATN, fell below the 200 mL/100g/min threshold – these subjects were both imaged fewer than 12 days post-transplantation. (B) Scatter plot of mean cortical blood flow values as measured by MRI from individual transplanted kidneys with normal function, ATN, and acute rejection. A threshold of 325 mL/100g/min (solid line) provides the best separation of the groups although there is greater overlap compared to medullary perfusion measures.
However, there was good correlation between MR perfusion measurements of mean cortical blood flow and mean medullary blood flow (r = 0.7; p = 0.003; Fig. 5a). There was a weaker, negative correlation between both mean cortical blood flow and creatinine (r = -0.5; p = 0.04; Fig. 5b), and medullary blood flow and creatinine (r = -0.6; p = 0.007; Fig. 5c). No significant correlations between intrarenal blood flow and hematocrit were found (Table 2).
Figure 5.
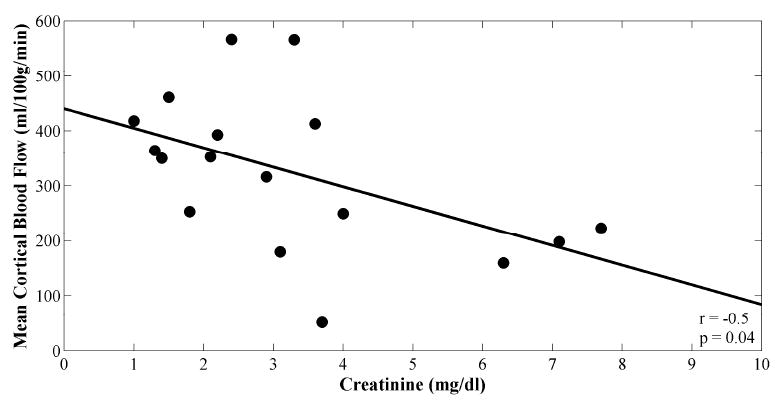
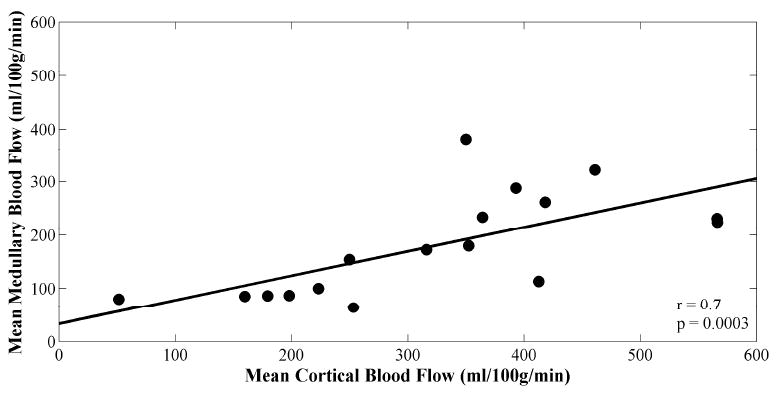
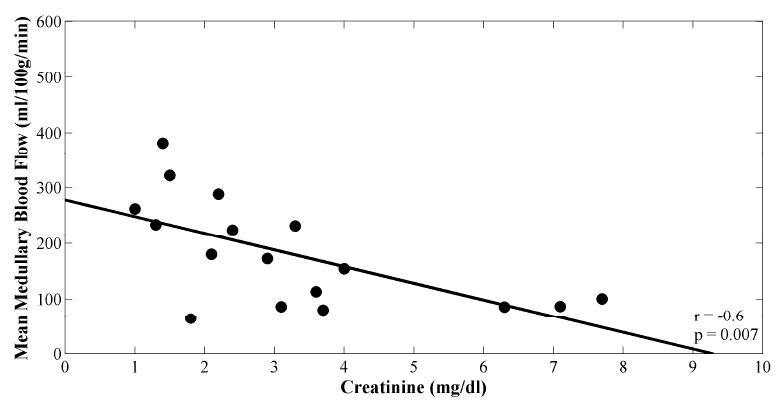
Scatter plots of (A) mean cortical versus medullary blood flow values, (B) mean cortical blood flow versus creatinine, and (C) mean medullary blood flow versus creatinine. Plots are fitted linearly. Pearson correlation coefficients and p-values are shown.
Table 2.
Pearson correlation coefficients, and p-values if significant, for serum markers and MR-measured blood flow for seventeen renal transplant subjects.
| Creatinine (mg/dL) | Hematocrit (%) | Mean Medullary Blood Flow (mL/100g/min) | Mean Cortical Blood Flow (mL/100g/min) | |
|---|---|---|---|---|
| Creatinine (mg/dL) | r = 1.0 | r = -0.1 | r = -0.6; p = 0.007 | r = -0.5; p = 0.04 |
| Hematocrit (%) | r = 1.0 | r = 0.1 | r = 0.2 | |
| Mean Medullary Blood Flow (mL/100g/min) | r = 1.0 | r = 0.7; p = 0.003 | ||
| Mean Cortical Blood Flow (mL/100g/min) | r = 1.0 |
Discussion
Several MRI methods have been used to measure blood flow to evaluate normal native kidneys and changes in intrarenal blood flow due to arterial occlusion [15, 23-25]. These methods include arterial spin labeling (ASL) methods, gadolinium-based contrast susceptibility methods, and most recently molecular methods using tissue-specific agents [7-9, 24-26]. These and other studies have shown indicator-dilution techniques to be precise and reproducible. However, the gadolinium-based MR technique developed here allowed cortical and medullary perfusion values to be calculated in milliliters per 100 grams of tissue per minute in transplanted kidneys. This technique is potentially useful for differentiating normal-functioning allografts and those with ATN from allografts with acute rejection using a threshold value for medullary blood flow of 200 mL/100g/min. Medullary flow values in all allografts with acute rejection fell below this threshold, while a single allograft with ATN and a single allograft with normal function demonstrated medullary blood flow values below this threshold. It should be noted that both of these subjects were imaged fewer than 12 days post transplant surgery. In fact there were five patients total who were imaged less than 12 days after the transplantation procedure, and three out of five had medullary blood flow measurements less than 200 mL/100g/min: one allograft with ATN, one allograft with normal function and one with acute rejection. These findings may indicate that blood flow changes similar to acute rejection occur in the early post-operative period. A threshold of 325 mL/100g/min was chosen for mean cortical blood flow measurements. However, no definitive threshold could be chosen due to excessive overlap between groups. A larger study population may elucidate a more definitive threshold for both medullary and cortical blood flow values.
This work also demonstrates the feasibility of using a gadolinium-based MR perfusion technique to noninvasively evaluate cortical and medullary blood flow at the capillary level. The technique presented allows measurement of blood flow in the renal tissue after it has passed the glomerular unit and is distinguished from existing Doppler and nuclear medicine techniques that measure “whole” organ flow or flow in the pre-glomerular vessels. Blood flow in large vessels does not correlate directly with tissue perfusion, as the kidney stringently regulates blood flow on a capillary level to maintain cortical and medullary perfusion and oxygenation [23-25, 27-29]. Local hormonal and sympathetic control regulates small vessel perfusion over a wide range of systemic blood pressures and main renal artery blood flows. In fact, flow in the main renal artery must decrease by 80% or more before medullary tissue perfusion is affected [23, 28, 29]. Therefore, techniques that provide more direct measures of cortical and medullary tissue perfusion will likely offer a more accurate assessment of disease-related changes in cortical and medullary blood flow.
Interestingly, MR-measured blood flow to the medulla of acutely rejecting allografts is significantly decreased compared to allografts with ATN. ATN is an entity known to be associated with low blood flow states during the acute insult. After the acute insult, blood flow is re-established as healing occurs and there may not be the same level of vasoactive injury, nor the inflammatory changes observed in ATN as compared to acutely rejecting allografts [30-32]. In other words, the combination of vasoactive substances in acutely rejecting transplanted kidneys plus inflammation at the level of the capillaries may alter flow to a greater degree than the pathologic changes seen in ATN. It is also interesting to note in this study that creatinine levels could only be used to distinguish between normal-functioning kidneys and kidneys with acute rejection and not to distinguish normal-functioning kidneys from ATN or allografts with ATN from acute rejection.
This pilot study has the limitation of being a point-in-time analysis. Blood flow is a dynamic characteristic of the kidney and capturing a single moment in the physiologic spectrum has discrete limitations in assessing an ever-changing biological process. Further studies are needed to determine if a single point in time or a series of time points can accurately identify allografts with acute rejection with acceptable sensitivity and specificity. While the proposed method has not been independently validated, absolute quantification of perfusion may not be required to evaluate disease processes such as transplant rejection. Currently we are performing a reproducibility study using MR perfusion techniques in normal subjects and transplant patients to evaluate the consistency of these measurements for consecutive scans and for different days. Additionally, there are inherent errors in the gadolinium-based MR perfusion technique due to the fact that some of the gadolinium exchanges with the extravascular space in the kidney parenchyma. As an area of future work, modeling of contrast agent kinetics at time points well after the first pass can depict clearance of gadolinium through the kidney. This analysis may be a means to assess GFR [33] in addition to perfusion for improved separation of ATN from normal-functioning allografts. Finally, patients were asked to perform a breathhold during the first 30 seconds of the perfusion acquisition; however, the first pass is approximately 50 seconds. Although small errors are introduced by respiratory motion, the ROIs placed in frames acquired during the last 20 seconds of first pass were manually registered to mitigate the effects of in-plane motion.
With regard to recent concerns, our group performed these experiments prior to the time when an association was established between gadolinium-containing contrast agents and nephrogenic systemic fibrosis (NSF) [34]. Contrast-enhanced MR perfusion imaging should be performed cautiously in anyone with compromised renal function, especially in those patients with elevated serum creatinine values or diminished glomerular filtration rates [35]. Although it is unclear if the association between gadolinium-based contrast agents and NSF is due to a particular agent or dose, future data may reveal a means of using contrast-enhanced MR imaging in patients with renal insufficiency [36, 37]. Alternatively, ASL perfusion techniques [26] may provide a means of assessing renal function in whom gadolinium should be avoided. ASL perfusion techniques may be advantageous in tracking a transplant patient's renal function over time, particularly if it is determined that a lifetime accumulation of low-dose gadolinium injections is a cause of NSF.
In conclusion, there were statistically different blood flow values in both the cortex and medulla of the acutely rejecting allografts compared to the normal allografts despite our small study population. Furthermore, allografts with acute rejection could be identified using a threshold of 200 mL/100g/min for blood flow in the medulla. Ongoing acquisition and evaluation of MR perfusion techniques in concert with other regional measures of function, such as BOLD MR imaging, in a larger group of renal transplant subjects is necessary to determine the ultimate clinical utility of these techniques.
Acknowledgments
Grant Support: None
Appendix: Theory
Calculating perfusion using indicator dilution theory and the central volume principle has been previously described [38, 39] and has recently been applied to MR images obtained using gadolinium as a contrast material [40-45]. When using MR to obtain perfusion values, the changing concentration of the contrast material as it passes through the organs of interest produces a concomitant change in signal intensity on T2*-weighted echo planar images (Fig. 1a) as compared to the T1-weighted sequence used for anatomic assessment (Fig. 1b) and localization. Processing of the images permits the signal-time curves measured in the cortical and medullary tissues (Fig. 1a) to be converted to concentration-time curves. In this study, quantitative cortical and medullary blood flow values were calculated by applying tracer kinetics principles to the first time segment of the dynamic concentration-time curve corresponding to the first pass of the contrast material through the renal cortex and medulla (Fig. 1c). A gamma-variate function was used to model the arterial input function (AIF), as measured in the aorta or the renal artery. A lag normal function was used to model the tissue response function [39]. Use of a model-dependent approach provided improved robustness to noise compared to direct Fourier or singular value decomposition (SVD) deconvolution techniques.
As for other susceptibility techniques, the measured signal, S(t), can be related to the measured contrast concentration, Cm(t), by:
| (1) |
where S0 is the signal intensity prior to the arrival of contrast material, TE is the echo time of the MR imaging sequence, and k is dependent on the R2* relaxivity of the contrast agent. Cm(t) was calculated according to Eq. [1]. Cm(t) was defined for both a major artery (renal or aorta), Ca(t), as well as the tissue of the transplanted kidney, Ctiss(t). Ca(t) is also referred to as the AIF.
A time window encompassing the first pass of gadolinium was set within which Ca(t) was fit to a gamma-variate curve using a least-squares approach; elsewhere Ca(t) was set to zero. Because the dispersion of the contrast bolus in the arterial input contributes to the dispersion observed in the organ [17, 39], Ctiss(t) can be described as a convolution of Ca(t) and the tissue impulse response, H(t) as:
| (2) |
For this study, Ctiss(t) was fit by the iterative method described below. An initial guess, H0(t), for H(t) was made using the lag-normal model [46]:
| (3) |
where C, tc, σ, γ, and tlag are free variables. Ca(t) was then convolved with H0(t) to yield C′tiss(t), where the prime indicates that this is an intermediate approximation. A chi-squared quality of fit value was calculated for C′tiss (t) with respect to the measured tissue data, Cm(t) (Fig. 1c). The five parameters defining H0(t) were then systematically modified, to produce H′(t), where again the prime indicates an intermediate approximation. The process was iterated until a minimum for the chi-squared value was found using a Nelder-Mead simplex search algorithm. The H′(t), and C′tiss(t) associated with the minimum chi-squared value were defined as the final H(t) and Ctiss(t) (Fig. 1c).
From H(t), the mean transit time (MTT) was calculated according to:
| (4) |
where Hmax denotes the maximum value of H(t). The regional renal blood volume (rRBV) was calculated from Ctiss(t) and Ca(t) by:
| (5) |
where κ is a function of the measured hematocrit (taken to equal 0.73 in the present work) and ρ is the density of the kidney (taken to equal 1.04 g/mL in the present work). Finally, in accordance with the central volume principle, the quantitative renal blood flow (RBF) was calculated by:
| (6) |
Footnotes
Publisher's Disclaimer: This is a PDF file of an unedited manuscript that has been accepted for publication. As a service to our customers we are providing this early version of the manuscript. The manuscript will undergo copyediting, typesetting, and review of the resulting proof before it is published in its final citable form. Please note that during the production process errors may be discovered which could affect the content, and all legal disclaimers that apply to the journal pertain.
References
- 1.Sayegh MH, Carpenter CB. Transplantation 50 years later--progress, challenges, and promises. N Engl J Med. 2004;351:2761–2766. doi: 10.1056/NEJMon043418. [DOI] [PubMed] [Google Scholar]
- 2.Pascual M, Theruvath T, Kawai T, et al. Strategies to improve long-term outcomes after renal transplantation. N Engl J Med. 2002;346:580–590. doi: 10.1056/NEJMra011295. [DOI] [PubMed] [Google Scholar]
- 3.Ojo AO, Wolfe RA, Held PJ, et al. Delayed graft function: Risk factors and implications for renal allograft survival. Transplantation. 1997;63:968–974. doi: 10.1097/00007890-199704150-00011. [DOI] [PubMed] [Google Scholar]
- 4.Annual reports from the scientific registry of transplant recipients. [June 30, 2008];2007 Available at: http://www.ustransplant.org/annual_reports/current/
- 5.Breza J, Navratil P. Renal transplantation in adults. BJU Int. 1999;84:216–223. doi: 10.1046/j.1464-410x.1999.00203.x. [DOI] [PubMed] [Google Scholar]
- 6.Wentland AL, Korosec FR, Vigen KK, et al. Cine flow measurements using phase contrast with undersampled projections: In vitro validation and preliminary results in vivo. J Magn Reson Imaging. 2006;24:945–951. doi: 10.1002/jmri.20715. [DOI] [PubMed] [Google Scholar]
- 7.Rusinek H, Kaur M, Lee VS. Renal magnetic resonance imaging. Curr Opin Nephrol Hypertens. 2004;13:667–673. doi: 10.1097/00041552-200411000-00014. [DOI] [PubMed] [Google Scholar]
- 8.Huang AJ, Lee VS, Rusinek H. Functional renal mr imaging. Magn Reson Imaging Clin N Am. 2004;12:469–486. vi. doi: 10.1016/j.mric.2004.04.001. [DOI] [PubMed] [Google Scholar]
- 9.Prasad PV. Functional mri of the kidney: Tools for translational studies of pathophysiology of renal disease. Am J Physiol Renal Physiol. 2006;290:F958–974. doi: 10.1152/ajprenal.00114.2005. [DOI] [PMC free article] [PubMed] [Google Scholar]
- 10.Sadowski EA, Fain SB, Alford SK, et al. Assessment of acute renal transplant rejection with blood oxygen level-dependent mr imaging: Initial experience. Radiology. 2005;236:911–919. doi: 10.1148/radiol.2363041080. [DOI] [PubMed] [Google Scholar]
- 11.Sommer G, Noorbehesht B, Pelc N, et al. Normal renal blood flow measurement using phase-contrast cine magnetic resonance imaging. Invest Radiol. 1992;27:465–470. doi: 10.1097/00004424-199206000-00012. [DOI] [PubMed] [Google Scholar]
- 12.Wolf RL, King BF, Torres VE, et al. Measurement of normal renal artery blood flow: Cine phase-contrast mr imaging vs clearance of p-aminohippurate. AJR Am J Roentgenol. 1993;161:995–1002. doi: 10.2214/ajr.161.5.8273644. [DOI] [PubMed] [Google Scholar]
- 13.Debatin JF, Ting RH, Wegmuller H, et al. Renal artery blood flow: Quantitation with phase-contrast mr imaging with and without breath holding. Radiology. 1994;190:371–378. doi: 10.1148/radiology.190.2.8284383. [DOI] [PubMed] [Google Scholar]
- 14.Schoenberg SO, Just A, Bock M, et al. Noninvasive analysis of renal artery blood flow dynamics with mr cine phase-contrast flow measurements. Am J Physiol. 1997;272:H2477–2484. doi: 10.1152/ajpheart.1997.272.5.H2477. [DOI] [PubMed] [Google Scholar]
- 15.Dujardin M, Sourbron S, Luypaert R, et al. Quantification of renal perfusion and function on a voxel-by-voxel basis: A feasibility study. Magn Reson Med. 2005;54:841–849. doi: 10.1002/mrm.20608. [DOI] [PubMed] [Google Scholar]
- 16.Michaely HJ, Kramer H, Oesingmann N, et al. Semiquantitative assessment of first-pass renal perfusion at 1.5 t: Comparison of 2d saturation recovery sequences with and without parallel imaging. AJR Am J Roentgenol. 2007;188:919–926. doi: 10.2214/AJR.06.0567. [DOI] [PubMed] [Google Scholar]
- 17.Wang JJ, Hendrich KS, Jackson EK, et al. Perfusion quantitation in transplanted rat kidney by mri with arterial spin labeling. Kidney Int. 1998;53:1783–1791. doi: 10.1046/j.1523-1755.1998.00945.x. [DOI] [PubMed] [Google Scholar]
- 18.Dupas B, Bach-Gansmo T, Blancho G, et al. Gadolinium-enhanced mr imaging of normal renal transplants. An evaluation of a t1-weighted dynamic echo-planar sequence. Acta Radiol. 1999;40:250–254. doi: 10.3109/02841859909175550. [DOI] [PubMed] [Google Scholar]
- 19.Beckmann N, Joergensen J, Bruttel K, et al. Magnetic resonance imaging for the evaluation of rejection of a kidney allograft in the rat. Transpl Int. 1996;9:175–183. doi: 10.1007/BF00335383. [DOI] [PubMed] [Google Scholar]
- 20.Szolar DH, Preidler K, Ebner F, et al. Functional magnetic resonance imaging of human renal allografts during the post-transplant period: Preliminary observations. Magn Reson Imaging. 1997;15:727–735. doi: 10.1016/s0730-725x(97)00088-x. [DOI] [PubMed] [Google Scholar]
- 21.Agildere AM, Tarhan NC, Bozdagi G, et al. Correlation of quantitative dynamic magnetic resonance imaging findings with pathology results in renal transplants: A preliminary report. Transplant Proc. 1999;31:3312–3316. doi: 10.1016/s0041-1345(99)00808-8. [DOI] [PubMed] [Google Scholar]
- 22.Sharma RK, Gupta RK, Poptani H, et al. The magnetic resonance renogram in renal transplant evaluation using dynamic contrast-enhanced mr imaging. Transplantation. 1995;59:1405–1409. doi: 10.1097/00007890-199505270-00008. [DOI] [PubMed] [Google Scholar]
- 23.Pallone TL, Zhang Z, Rhinehart K. Physiology of the renal medullary microcirculation. Am J Physiol Renal Physiol. 2003;284:F253–266. doi: 10.1152/ajprenal.00304.2002. [DOI] [PubMed] [Google Scholar]
- 24.Norman JT, Stidwill R, Singer M, et al. Angiotensin ii blockade augments renal cortical microvascular po2 indicating a novel, potentially renoprotective action. Nephron Physiol. 2003;94:p39–46. doi: 10.1159/000071289. [DOI] [PubMed] [Google Scholar]
- 25.Just A, Arendshorst WJ. Dynamics and contribution of mechanisms mediating renal blood flow autoregulation. Am J Physiol Regul Integr Comp Physiol. 2003;285:R619–631. doi: 10.1152/ajpregu.00766.2002. [DOI] [PubMed] [Google Scholar]
- 26.Martirosian P, Klose U, Mader I, et al. Fair true-fisp perfusion imaging of the kidneys. Magn Reson Med. 2004;51:353–361. doi: 10.1002/mrm.10709. [DOI] [PubMed] [Google Scholar]
- 27.Schurek HJ, Johns O. Is tubuloglomerular feedback a tool to prevent nephron oxygen deficiency? Kidney Int. 1997;51:386–392. doi: 10.1038/ki.1997.51. [DOI] [PubMed] [Google Scholar]
- 28.Brezis M, Agmon Y, Epstein FH. Determinants of intrarenal oxygenation. I. Effects of diuretics. Am J Physiol. 1994;267:F1059–1062. doi: 10.1152/ajprenal.1994.267.6.F1059. [DOI] [PubMed] [Google Scholar]
- 29.Brezis M, Heyman SN, Epstein FH. Determinants of intrarenal oxygenation. Ii. Hemodynamic effects. Am J Physiol. 1994;267:F1063–1068. doi: 10.1152/ajprenal.1994.267.6.F1063. [DOI] [PubMed] [Google Scholar]
- 30.Bonventre JV, Weinberg JM. Recent advances in the pathophysiology of ischemic acute renal failure. J Am Soc Nephrol. 2003;14:2199–2210. doi: 10.1097/01.asn.0000079785.13922.f6. [DOI] [PubMed] [Google Scholar]
- 31.Racusen LC, Halloran PF, Solez K. Banff 2003 meeting report: New diagnostic insights and standards. Am J Transplant. 2004;4:1562–1566. doi: 10.1111/j.1600-6143.2004.00585.x. [DOI] [PubMed] [Google Scholar]
- 32.Jani A, Polhemus C, Corrigan G, et al. Determinants of hypofiltration during acute renal allograft rejection. J Am Soc Nephrol. 2002;13:773–778. doi: 10.1681/ASN.V133773. [DOI] [PubMed] [Google Scholar]
- 33.Zhang JL, Rusinek H, Bokacheva L, et al. Functional assessment of the kidney from magnetic resonance and computed tomography renography: Impulse retention approach to a multicompartment model. Magn Reson Med. 2008;59:278–288. doi: 10.1002/mrm.21489. [DOI] [PMC free article] [PubMed] [Google Scholar]
- 34.Marckmann P, Skov L, Rossen K, et al. Nephrogenic systemic fibrosis: Suspected causative role of gadodiamide used for contrast-enhanced magnetic resonance imaging. J Am Soc Nephrol. 2006;17:2359–2362. doi: 10.1681/ASN.2006060601. [DOI] [PubMed] [Google Scholar]
- 35.Sadowski EA, Bennett LK, Chan MR, et al. Nephrogenic systemic fibrosis: Risk factors and incidence estimation. Radiology. 2007;243:148–157. doi: 10.1148/radiol.2431062144. [DOI] [PubMed] [Google Scholar]
- 36.Thomsen HS, Marckmann P, Logager VB. Enhanced computed tomography or magnetic resonance imaging: A choice between contrast medium-induced nephropathy and nephrogenic systemic fibrosis? Acta Radiol. 2007;48:593–596. doi: 10.1080/02841850701370717. [DOI] [PubMed] [Google Scholar]
- 37.Sieber MA, Lengsfeld P, Frenzel T, et al. Preclinical investigation to compare different gadolinium-based contrast agents regarding their propensity to release gadolinium in vivo and to trigger nephrogenic systemic fibrosis-like lesions. Eur Radiol. 2008 doi: 10.1007/s00330-008-0977-y. [DOI] [PubMed] [Google Scholar]
- 38.Zeirler K. Theoretical basis of indicator-dilution methods for measuring flow and volume. Circ Res. 1962;10:393–407. [Google Scholar]
- 39.Bassingthwaighte JB. Physiology and theory of tracer washout techniques for the estimation of myocardial blood flow: Flow estimation from tracer washout. Prog Cardiovasc Dis. 1977;20:165–189. doi: 10.1016/0033-0620(77)90019-6. [DOI] [PMC free article] [PubMed] [Google Scholar]
- 40.Montet X, Ivancevic MK, Belenger J, et al. Noninvasive measurement of absolute renal perfusion by contrast medium-enhanced magnetic resonance imaging. Invest Radiol. 2003;38:584–592. doi: 10.1097/01.RLI.0000077127.11949.8c. [DOI] [PubMed] [Google Scholar]
- 41.Smith AM, Grandin CB, Duprez T, et al. Whole brain quantitative cbf and cbv measurements using mri bolus tracking: Comparison of methodologies. Magn Reson Med. 2000;43:559–564. doi: 10.1002/(sici)1522-2594(200004)43:4<559::aid-mrm10>3.0.co;2-n. [DOI] [PubMed] [Google Scholar]
- 42.Rempp KA, Brix G, Wenz F, et al. Quantification of regional cerebral blood flow and volume with dynamic susceptibility contrast-enhanced mr imaging. Radiology. 1994;193:637–641. doi: 10.1148/radiology.193.3.7972800. [DOI] [PubMed] [Google Scholar]
- 43.Hermoye L, Annet L, Lemmerling P, et al. Calculation of the renal perfusion and glomerular filtration rate from the renal impulse response obtained with mri. Magn Reson Med. 2004;51:1017–1025. doi: 10.1002/mrm.20026. [DOI] [PubMed] [Google Scholar]
- 44.Johnson G, Wetzel SG, Cha S, et al. Measuring blood volume and vascular transfer constant from dynamic, t(2)*-weighted contrast-enhanced mri. Magn Reson Med. 2004;51:961–968. doi: 10.1002/mrm.20049. [DOI] [PubMed] [Google Scholar]
- 45.Ostergaard L, Weisskoff RM, Chesler DA, et al. High resolution measurement of cerebral blood flow using intravascular tracer bolus passages. Part i: Mathematical approach and statistical analysis. Magn Reson Med. 1996;36:715–725. doi: 10.1002/mrm.1910360510. [DOI] [PubMed] [Google Scholar]


