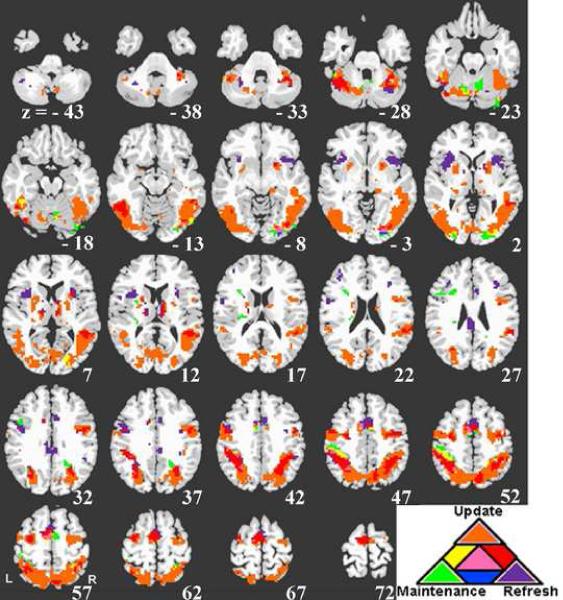
Figure 2.
Overlap analysis of Update, Refresh, and Maintenance (see text). Regions significantly responsive to update are shown in orange, refresh in purple and maintenance in green. Regions responsive both to update and refresh are shown in red. Regions responsive both to update and maintenance are shown in yellow. Regions responsive to refresh and maintenance are shown in blue. Regions responsive to update, refresh and maintenance are shown in pink. The left side of the image represents the left side of the brain.

