Abstract
Many eukaryotic cell types are capable of specific recognition and phagocytosis of apoptotic cells, and there is increasing interest in the mechanisms involved in this process. To facilitate analysis of these mechanisms, we designed a novel fluorescence-based method to quantify phagocytosis in vitro using endothelial cell engulfment of apoptotic cells as a model. The B-cell line WEHI-231 was labeled with the fluorophore 5-(&-6)-carboxytetramethylrhodamine-succinimidyl-ester (TAMRA) and then induced to undergo apoptosis by crosslinking cell surface immunoglobulin. An endothelial cell line was subsequently allowed to ingest these TAMRA-labeled apoptotic lymphocytes. After 24 h, non-bound lymphocytes were removed and the monolayers were dissociated. Any nonphagocytosed lymphocytes that remained tightly bound to the endothelial cells were then indirectly immunofluorescein labeled for the pan leukocyte-specific marker CD45. Flow cytometric analysis of the cells distinguished three endothelial cell populations: 1) endothelial cells with surface bound lymphocytes (TAMRA+CD45+); 2) endothelial cells containing phagocytosed apoptotic lymphocytes (TAMRA+ CD45−); and 3) endothelial cells that were not associated with lymphocytes. The identification of these populations was verified by confocal microscopy of sorted cells. The method described herein will facilitate detailed studies on phagocytic recognition of apoptotic cells and should have broad applications to other phagocytic cell systems.
Keywords: apoptosis, endothelial cells, flow cytometry, lymphocyte, phagocytosis
Apoptosis is a form of cell death induced by various external and internal cellular signals during development, cell differentiation, and normal tissue homeostasis (14). Induction of the cell death program intiates diverse cellular changes, including membrane blebbing, condensation of chromatin along the nuclear membrane, activation of calcium sensitive endonucleases resulting in DNA fragmentation, and the generation of membrane-enclosed apoptotic bodies (6). Apoptotic cells are specifically recognized and efficiently removed by various phagocytes before their continued degeneration results in a loss of apoptotic cell membrane integrity. Thus phagocytosis of apoptotic cells plays an important role in the clearance of nonfunctional dying cells, thereby preventing the release of toxic cellular enzymes and other by-products which would stimulate a potent inflammatory response and consequently contribute to tissue damage.
Multiple types of somatic cells are capable of recognizing apoptotic cells. Examples include macrophage engulfment of apoptotic lymphocytes (1, 11), fibroblast phagocytosis of apoptotic neurotrophils (12), Langerhans’ cell engulfment of apoptotic vaginal epithelial cells during the murine estrous cycle (16), and liver endothelial cell phagocytosis of apoptotic liver cells (8). A number of methods have been used to quantify this process in vitro. Most current procedures quantify the number of apoptotic cells (internalized and surface bound) by light microscopy. These assays are based on the assumption that bound targets are destined for internalization (23), which is often an invalid assumption in cell-cell recognition systems where the target cell tightly adheres to the phagocytic cell regardless of the apoptotic state. An example of this is the specific interaction between endothelial cells and lymphocytes where endothelial cells regulate the transendothelial migration of lymphocytes as well as phagocytose apoptotic lymphocytes (4, 8, Cook-Mills, unpublished observation). Since endothelial cells bind leukocytes during both processes, binding of leukocytes must be distinguished from leukocyte internalization to specifically quantify phagocytosis.
Other phagocytosis assays distinguish internalized targets from bound targets, but these assays require manual counting, which is cumbersome and time consuming. For example, Fadok et al. (10) described an assay whereby macrophages are treated with trypsin to dissociate bound cells and then the internalized cells are counted by light microscopy. In another assay, where the apoptotic target cell is a red blood cell, the bound but not internalized red blood cells are removed by hypotonic lysis and the remaining red blood cells are counted (19). This is not universally applicable, since apoptotic lymphocytes are not differentially susceptible to hypotonic lysis. Another current quantitative assay for phagocytosis utilizes the quenching of external but not phagocytosed FITC labels with trypan blue (18, 22). However, the FITC label itself is partially quenched by the acidic environment of the phagolysosome, thereby reducing assay sensitivity (18).
This report describes a novel rapid method to quantify the percentage of endothelial cells which have phagocytosed apoptotic lymphocytes by distinguishing the following 3 populations: 1) endothelial cells that have phagocytosed apoptotic leukocytes, 2) endothelial cells that have surface-bound leukocytes, and 3) endothelial cells not associated with leukocytes. This method has broad applications as a technique to study phagocytic recognition of multiple apoptotic cell types.
METHODS
Animals
BALB/c mice (4–6 weeks old) were bred under pathogenfree conditions at Harlan Industries, Indianapolis, Indiana.
Antibodies
Affinity purified goat-anti-mouse Ig, F(ab’)2 (IgA, IgG, and IgM, H + L) was obtained from Organon Teknika Corporation, West Chester, Pennsylvania. Affinity purified rat-anti-mouse CD45 (Ly5/T200), affinity purified rat-anti-mouse VCAM-1 (CD106), and the isotype control rat-anti-mouse IgG2a, κ were obtained from PharMingen, San Diego, California. Purified FITC-conjugated goat-anti-rat Ig (IgM + IgG, H+L) (preadsorbed against pooled mouse serum) was obtained from Southern Biotechnology Associates, Inc., Birmingham, Alabama. Purified Cy-5-conjugated goat-anti-rat IgG (H+L) was obtained from Jackson ImmunoResearch Laboratories, Inc., West Grove, Pennsylvania.
Cell Lines
WEHI-231 cells (BALB/c mouse B-cell lymphoma) were purchased from the American Tissue Culture Collection, Rockville, Maryland. The generation of the mHEVa endothelial cell line by this laboratory has been previously described (7).
Culture Medium
The mHEVa cell line was maintained in HEV culture medium consisting of RPMI-1640 medium supplemented with 20% heat-inactivated fetal calf serum, 1 mM HEPES buffer (pH 7.2), 10 mM sodium bicarbonate, 2 mM glutamine, 100 U/ml penicillin, 100 μg/ml streptomycin, and 50 μg/ml gentamycin. The WEHI-231 cells were maintained in DMEM culture medium consisting of DMEM medium supplemented with 10% heat-inactivated fetal calf serum, 2 mM glutamine, 100 U/ml penicillin, 100 μg/ml streptomycin, and 50 μg/ml gentamycin. In addition, the WEHI-231 cells required 50 μM 2-mercaptoethanol (2-ME) for viability. All cells were incubated in a humidified atmosphere at 37°C in 5% CO2-air.
Induction of Apoptosis
WEHI-231 cells (12 × 106/ml) were induced to undergo apoptosis by crosslinking cell-surface immunoglobulins by the addition of 25 μg goat-anti-mouse Ig, F(ab’)2 in 6 ml of DMEM culture medium (3, 13). After 24 h at 37°C, the WEHI-231 cells were washed and placed in DMEM culture medium.
DNA Fragmentation Assay (21)
WEHI-231 cells (6 × 10⁶ anti-Ig-treated or control cells) were centrifuged at 200 g for 10 min. The cells were lysed at room temperature for 20 min with 400 μl lysing solution comprised of 0.2% Triton X-100, 1 mM EDTA, and 10 mM Tris-HCl, pH 7.5. To pellet the intact DNA, the lysates were centrifuged at 13,000 g. The supernatant containing the fragmented DNA was transferred to a separate tube. 400 μl of additional lysing solution was added to the pellet of intact DNA. To precipitate the DNA, 200 μl of 25% trichloroacetic acid (TCA) was added and the samples were incubated at 4°C overnight. The TCA was removed and 80 μl of 5% TCA was added to the DNA to facilitate hydrolysis at 90°C for 10 min. 160 μl of diphenylamine (DPA) reagent comprised of 1.5% sulfuric acid, 0.2% acetaldehyde, and 98% glacial acetic acid was added to both supernatant and pellet samples and they were then incubated at room temperature overnight for color development by an unknown mechanism. The OD600 was determined using a microtiter plate reader. The % fragmented DNA = ODsupernatant/(ODpellet + ODsupernatant).
Phagocytosis Assay
mHEVa cells were plated in 12 well microtiter plates and were incubated for 2 days at 37°C to allow growth to confluent monolayers. Nonapoptotic WEHI-231 cells (30 × 106) were incubated with 50 μg of the viable dye, TAMRA (5-(&6)-carboxytetramethylrhodamine, succinimidyl ester; the excitation spectrum is 460–565 nm, with a peak at 550, and the emission spectrum is 540–640 nm, with a peak at 568; Molecular Probes, Eugene, OR), in 2 ml DMEM plus 2 ml 0.01 M phosphate buffered saline, pH 7.4 (PBS) for 15 min at 37°C (5). The WEHI-231 cells were washed and apoptosis was induced by crosslinking cell surface immunoglobulins for 24 h as described above. TAMRA-labeled apoptotic and nonapoptotic lymphocytes (2 × 10⁶ cells) were added to the mHEVa monolayers for 16 h at 37°C for phagocytosis. Culture medium was aspirated and the mHEVa cell/lymphocyte co-cultures were treated with 0.03% EDTA for 5 min to dissociate the monolayers. The cells were washed with PBS-0.3% immunoglobulin-free bovine serum albumin (BSA)-0.15% NaN3 at 4°C to prevent any additional phagocytosis of cells and internalization of surface-bound antibodies in the remainder of the procedure. To label surface-bound nonphagocytosed lymphocytes, 2 × 10⁶ cells from the mHEVa cell/lymphocyte co-culture were incubated in 200 μl of PBS-0.3% BSA-0.15% NaN3 with 2 μg of rat-anti-mouse CD45 (Ly5/T200) or with an isotype control at 4°C for 30 min. Controls consisted of nonapoptotic or apoptotic WEHI-231 cells incubated with anti-CD45 or an isotype control. The cells were washed and 2 μg of FITC-conjugated goat-anti-rat Ig was added to the cells in 200 μl of PBS-0.3% BSA-0.15% NaN3 at 4°C for 30 minutes. The cells were washed and analyzed by flow cytometry.
Flow Cytometry and Cell Sorting
Flow cytometry was performed using either a FACScan/Lysys II system (Becton Dickinson, San Jose, CA) or a Coulter EPICS 753 (Coulter Corp., Miami, FL)/Cicero system with Cyclops software (Cytomation Inc., Fort Collins, CO). Excitation was performed using a 488 nm argon ion laser line with emission collected using a 530 nm band pass (BP) filter for FITC, and for TAMRA, a 585 nm BP filter on the FACScan or a 620 nm BP filter on the Coulter EPICS 753. Cell sorting was performed on the Coulter EPICS 753.
Confocal Microscopy
After fluorescence-activated cell sorting on selected mHEVa populations, the mHEVa cells (4 × 10⁴) were labeled with 2 μg of rat-anti-mouse VCAM-1 in 200 μl of PBS-0.3% BSA-0.15% NaN3 at 4°C for 30 min. Cy5-conjugated goat-anti-rat IgG (2 μg) was added in 200 μl of PBS-0.3% BSA-0.15% NaN3 at 4°C for 30 min. The cells were washed and examined by light and confocal microscopy using a Leica TCS 4D microscope/SCANware system (Heidelberg, Germany) equipped with an Omnichrome krypton-argon laser (Chino, CA). Excitation was performed using the 488 nm, 568 nm, and 647 nm argon/krypton laser lines simultaneously. Emission was collected using a RSP580 beam splitter and a BP530 filter at detector #1, a RSP660 beam splitter and a BP600 filter at detector #2, and a LP665 filter at detector #3, for FITC, TAMRA, and Cy5, respectively.
RESULTS
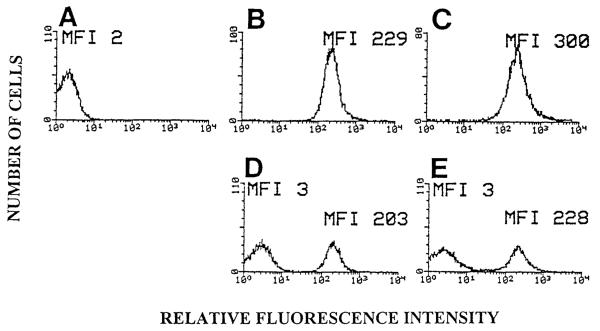
To examine apoptotic cells by flow cytometry after several days of co-culture with endothelial cells, we identified a fluorophore that maintains an intense signal after 4 days in culture and which is neither quenched by the low pH of phagolysosomes (15) nor nonspecifically acquired by neighboring cells. The WEHI-231 B cell line was labeled with the succinimidyl ester of the rhodamine-derivative TAMRA (5). These TAMRA-labeled B-cells were induced to undergo apoptosis by crosslinking cell surface immunoglobulins (3, 13). The induction of apoptosis was verified by the analysis of DNA fragmentation using the colorimetric DNA fragmentation assay (21). At 24 and 48 h post anti-Ig treatment, there was 28% and 40% DNA fragmentation, respectively. The controls had 5% fragmentation. To determine whether nonlabeled cells could acquire the TAMRA label from leakage from labeled cells, we labeled nonapoptotic or apoptotic WEHI-231 cells with TAMRA (Fig. 1B and C) and co-cultured them with nonlabeled nonapoptotic WEHI-231 cells for 3 days and examined the cultures by flow cytometry (Fig. 1). There was no shift in the mean fluorescence intensity (MFI) of nonlabeled cells in the cocultures in Figure 1D and 1E when compared to the nonlabeled cells in Figure 1A, indicating that there was no acquisition of TAMRA label by the nonlabeled cells. These results established that nonlabeled cells did not nonspecifically acquire TAMRA label by co-cultivation with labeled cells.
FIG. 1.
Flow cytometric histograms of cocultures of TAMRA-labeled and nonlabeled WEHI-231 cells. WEHI-231 cells were labeled with TAMRA and then induced to undergo apoptosis by anti-Ig treatment for 24 h. The control subset was not anti-Ig treated. Nonlabeled WEHI-231 cells were cultured for 3 days with an equal number of either TAMRA-labeled apoptotic or TAMRA-labeled control WEHI-231 cells in DMEM culture medium with 2-ME. Cellular fluorescence was examined by flow cytometry. A: non-labeled nonapoptotic WEHI-231 cells. B: TAMRA-labeled nonapoptotic WEHI-231 cells. C: TAMRA-labeled apoptotic WEHI-231 cells. D: TAMRA-labeled nonapoptotic WEHI-231 cells and nonlabeled nonapoptotic WEHI-231 cells. E: TAMRA-labeled apoptotic WEHI-231 cells and nonlabeled nonapoptotic WEHI-231 cells. MFI = mean fluorescence intensity.
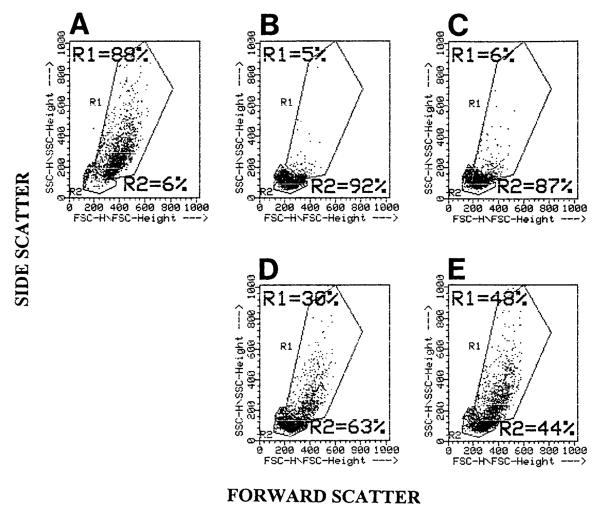
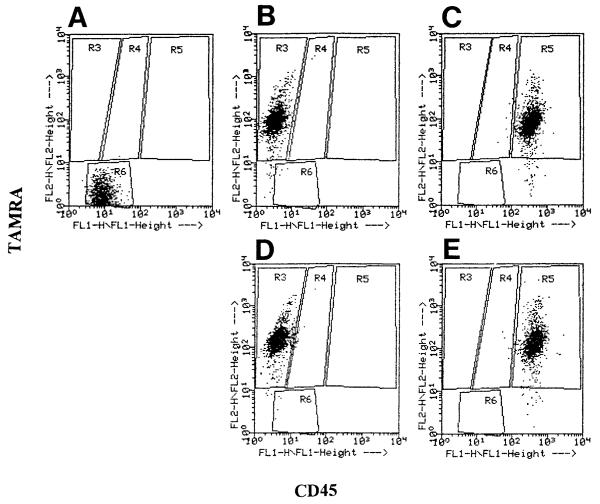
To examine phagocytosis of apoptotic cells using flow cytometry, the endothelial cell line mHEVa was chosen for its ability to phagocytose apoptotic WEHI-231 cells (Cook-Mills, unpublished observation). For co-cultures of mHEVa cells and WEHI-231 cells, flow cytometry analysis utilizing dot plots of forward scatter (FSC) vs. side scatter (SSC) clearly distinguished the mHEVa cells from either the TAMRA-labeled apoptotic or nonapoptotic WEHI-231 cells (Fig. 2A—C). In addition, the mHEVa cells cocultured with control or apoptotic WEHI-231 cells remained in the same position within the R1 gate (Fig. 2D,E), indicating that there was not a significant change in FSC or SSC when the mHEVa cells phagocytosed the WEHI-231 cells. Thus, this enabled specific gating on the mHEVa cells within a co-culture. Before examination of cell co-cultures, the fluorescence profiles for each cell type was determined. The mHEVa cells had a higher autofluorescence due to their larger size than the WEHI-231 cells at 530 nm (FL-1), as shown in the dot plots of CD45 (Ly5/T200) versus TAMRA (Fig. 3A,B,D). In samples containing only TAMRA-labeled apoptotic or control WEHI-231 cells, the WEHI-231 cells exhibited a relatively high mean fluorescent intensity on the FL-2 (TAMRA) axis (Fig. 3B,D). In samples containing TAMRA- and CD45-labeled apoptotic or control WEHI-231 cells, the WEHI-231 cells exhibited a relatively high mean fluorescence intensity on both the FL-1 (CD45) and FL-2 (TAMRA) axis (Fig. 3C,E). Thus, the CD45-labeled WEHI-231 cells were bright enough to display them above the mHEVa cells’ autofluorescence. The isotype control for anti-CD45 was negative in all experiments (data not shown). Therefore, the TAMRA and CD45 labels of both nonapoptotic and apoptotic WEHI-231 cells were distinct from nonlabeled cells.
FIG. 2.
Flow cytometric dot plot (FSC vs. SSC) of mHEVa cells and TAMRA-labeled WEHI-231 cells. WEHI-231 cells were labeled with TAMRA, treated with anti-Ig for 24 h to induce apoptosis, washed, cultured for 2 days, and examined by flow cytometry. A: mHEVa cells only. B: TAMRA-labeled control WEHI-231 cells only. C: TAMRA-labeled apoptotic WEHI-231 cells only. D: mHEVa cells in coculture with control WEHI-231 cells. E: mHEVa cells in coculture with apoptotic WEHI-231 cells. R1 = Region 1. R2 = Region 2.
FIG. 3.
Flow cytometric dot plot of FL1 versus FL2 (CD45 vs. TAMRA) of mHEVa cells and WEHI-231 cells. WEHI-231 cells were labeled with TAMRA, treated with anti-Ig for 24 h, washed, cultured for 2 days, indirectly immunofluorescent-labeled for CD45, and examined by flow cytometry. mHEVa cells were “gated on” in the FSC vs. SSC profile of mHEVa cells from Region 1 of Figure 2A and WEHI-231 cells were “gated on” in the FSC vs. SSC profiles from Region 2 of Figure 2B & C. A: mHEVa cells. B: TAMRA-labeled nonapoptotic WEHI-231 cells. C: TAMRA- and anti-CD45-labeled nonapoptotic WEHI-231 cells. D: TAMRA-labeled apoptotic WEHI-231 cells. E: TAMRA- and anti-CD45-labeled apoptotic WEHI-231 cells. FACScan FL1-FL2 compensation = 0.3%. FACScan FL2-FL1 compensation = 39%, as required for the TAMRA label. R3 = Region 3. R4 = Region 4. R5 = Region 5. R6 = Region 6.
To quantify the extent of phagocytosis of apoptotic cells by endothelial cells, the TAMRA-labeled apoptotic or control WEHI-231 cells were added to monolayers of the mHEVa cells. After 16 h, the cells were dissociated with 0.03% EDTA and the nonphagocytosed WEHI-231 cells were indirectly immunofluorescent labeled with rat-anti-mouse CD45 (Ly5/T200) or an isotype control and FITC-conjugated goat anti-rat Ig. The percent of mHEVa cells that phagocytosed WEHI-231 cells was determined by flow cytometry. The mHEVa cells were “gated” using FSC versus SSC and then analyzed for CD45 versus TAMRA (FL1 vs. FL2) expression. A dot plot (Fig. 4) of this analysis exhibited the following three distinguishable endothelial cell populations: 1) mHEVa cells located in Region 4 possessing TAMRA label due to internalization of TAMRA-labeled WEHI-231 cells, 2) mHEVa cells located in Region 5 possessing both a TAMRA and CD45 fluorescent label which was due to surface association with dual-labeled WEHI-231 cells and not the result of internalization of TAMRA-labeled cells (Fig. 5), and 3) mHEVa cells located in Region 6 with no detectable association with labeled WEHI-231 cells. When mHEVa cells were cocultured with anti-Ig-treated WEHI-231 cells, 31% of the cells were associated with the TAMRA-only-labeled WEHI-231 cells (Fig. 4A, region 4). In contrast, mHEVa cells cocultured with control WEHI-231 cells (not induced to undergo apoptosis with anti-Ig) exhibited only 13% of the mHEVa cells in Region 4 (Fig. 4B). This 13% most likely reflects a background level of apoptosis that occurs when WEHI-231 cells are cultured in medium that lacks 2-mercaptoethanol (2-ME). WEHI-231 cell viability depends on 2-ME, but it cannot be included in the co-cultures since it dissociates the mHEVa cell monolayers (Cook-Mills, unpublished observation).
FIG. 4.
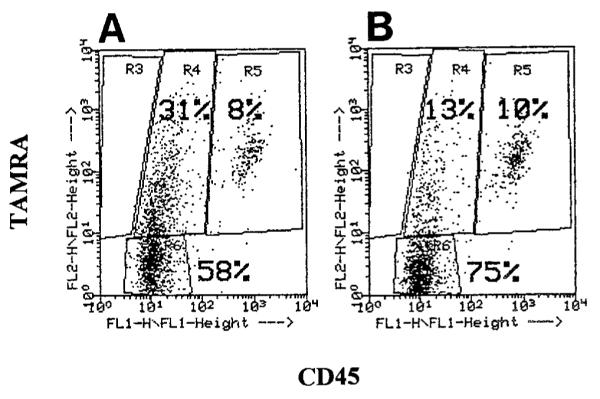
Flow cytometric dot plot (CD45 vs. TAMRA) of mHEVa cells with phagocytosed and surface-bound WEHI-231 cells. WEHI-231 cells were labeled with TAMRA, treated with anti-Ig for 24 h to induce apoptosis, washed, placed in co-culture with mHEVa cell monolayers for 24 h, indirectly immunofluorescent-labeled for CD45, and examined by flow cytometry. mHEVa cells were “gated on” in a FSC vs. SSC dot plot (Region 1) and then analyzed for the TAMRA and CD45 labels. A: mHEVa cells in co-culture with apoptotic WEHI-231 cells. B: mHEVa cells in co-culture with control WEHI-231 cells. R3 = Region 3. R4 = Region 4. R5 = Region 5. R6 = Region 6.
FIG. 5.
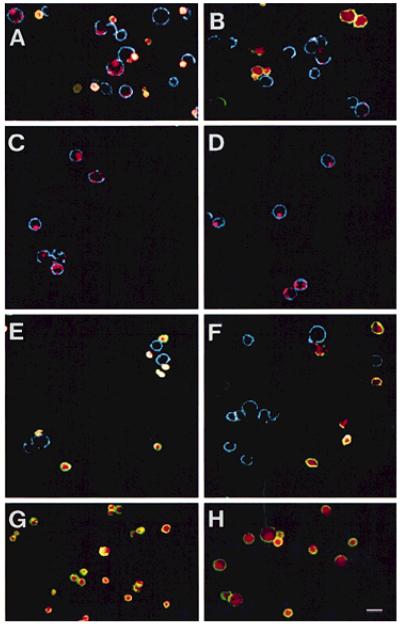
Confocal photomicrographs of mHEVa cells and WEHI-231 cells from FACS sorted mHEVa cells from Regions4 & 5 from Fig. 4. mHEVa cells were sorted, labeled with rat-anti-mouse VCAM-1 or an isotype control antibody and Cy5-conjugated goat-anti-rat IgG, and analyzed by confocal microscopy. A: representative field of cocultures of mHEVa cells and apoptotic WEHI-231 cells prior to cell sorting. B: representative field of cocultures of mHEVa cells and control WEHI-231 cells prior to cell sorting. C: representative field of mHEVa cells sorted from Region 4 from Figure 4A containing phagocytosed TAMRA-labeled apoptotic WEHI-231 cells. D: representative field of mHEVa cells sorted from Region 4 from Figure 4B containing phagocytosed TAMRA-labeled control WEHI-231 cells which were most likely apoptotic due to the absence of 2-ME while in co-culture with the mHEVa cells. E: representative field of mHEVa cells sorted from Region 5 from Figure 4A containing dual-labeled (TAMRA+CD45+) WEHI-231 cells; some WEHI-231 cells were separated from the surface of mHEVa cells during cell sorting and/or immunolabeling with anti-VCAM. F: representative field of mHEVa cells sorted from Region 5 of Figure 4B containing dual-labeled WEHI-231 cells; some WEHI-231 cells were separated from the surface of mHEVa cells during cell sorting and/or immunolabeling with anti-VCAM. G: dual-labeled apoptotic WEHI-231 cells were incubated with Cy5-conjugated goat-anti-rat IgG to demonstrate that Cy5 did not label CD45. H: dual-labeled control WEHI-231 cells were incubated with Cy5-conjugated goat-anti-rat IgG to demonstrate that Cy5 did not label CD45. Green represents FITC. Red represents TAMRA. Blue represents Cy5. Yellow to white represents the co-localization of FITC and TAMRA. Bar, 20 μm.
To prove that the mHEVa cells in Region 4 or 5 of Figure 4A and B contained WEHI-231 cells or had surface-associated WEHI-231 cells, cells from Region 4 or 5 were sorted and the cells were then analyzed by confocal microscopy. Following cell sorting, the mHEVa cells were labeled using rat-anti-mouse VCAM-1/Cy5-conjugated goat-anti-rat IgG so that the VCAM-1+ endothelial cell surface (7) could be detected by confocal microscopy. The Cy5-conjugated antibody did not significantly label the rat-anti-mouse CD45 on the WEHI-231 cells (Fig. 5G,H) suggesting that the rat-anti-mouse CD45 was saturated with the FITC-conjugated goat-anti-rat Ig. The cells sorted from Region 4 of Figure 4A consisted of mHEVa cells with phagocytosed TAMRA-labeled WEHI-231 cells (Fig. 5C). In contrast, cells sorted from Region 5 of Figure 4A consisted of mHEVa cells and TAMRA+CD45+ lymphocytes; some of the WEHI-231 cells that were once surface associated were dissociated during either the harshness of the FACS sort and/or anti-VCAM labeling (Fig. 5E). Although it is conceivable that Region 5 might also contain mHEVa cells with both surface-associated and internalized WEHI-231 cells, confocal microscopic analysis of this population revealed no mHEVa cells with phagocytosed WEHI-231 cells, suggesting that labeling of these mHEVa cells was due to surface-associated WEHI-231 cells. The results in Figures 5D and F were similar to Figures 5C and E, indicating that mHEVa cells from Region 4 of Figure 4B had phagocytosed control WEHI-231 cells that had begun to undergo apoptosis due to the absence of 2-ME in the cocultures. Thus, Region 4 (CD45 versus TAMRA) consisted of mHEVa cells that phagocytosed WEHI-231 cells and Region 5 consisted of mHEVa cells that did not contain phagocytosed WEHI-231 cells. In summary, 31% of mHEVa cells phagocytosed apoptotic WEHI-231 cells, whereas only 13% of the mHEVa cells phagocytosed control WEHI-231 cells.
DISCUSSION
The ability to specifically recognize and phagocytose apoptotic cells has evolved as a protective mechanism to prevent dying cells from disrupting tissue homeostatis in multicellular eukaryotes. Several phagocytic cells are known to be involved in this process including macrophages, fibroblasts, and endothelial cells (1, 8, 11, 12, 16). Current assays to measure this process in vitro suffer from their inability to distinguish specific apoptotic cell recognition from adherence mechanisms involved in other cell-cell interactions. This is particularly true for endothelial cells where the role of endothelium in promoting leukocyte diapedesis requires the binding of leukocytes via adhesion molecules (4, 9). Therefore, lymphocyte attachment to endothelial cell surfaces occurs during both migration and phagocytosis.
The new method for quantification of phagocytosis described in this report distinguished between lymphocyte adhesion and phagocytosis of apoptotic lymphocytes using a combination of fluorescence labeling and flow cytometric analysis. The target cells were fluorescent labeled with TAMRA. We have shown that TAMRA labeling is stable, even when the cells are induced to undergo apoptosis, and that the label is not acquired by nonlabeled cells. In this assay, TAMRA-labeled cells were induced to apoptose and then added to an endothelial cell monolayer as a source of phagocytic cells. After phagocytosis, the cells were dissociated with EDTA and the nonphagocytosed cells were indirectly immunofluorescent labeled for the pan leukocyte marker CD45 (Ly5/T200). The phagocytic cells were “gated on” forward vs. side light scattering and the percent of phagocytic cells with phagocytosed TAMRA-labeled leukocytes was determined. Confocal analysis of sorted phagocytic cells verified that phagocytic cells associated with the TAMRA-label had only internalized leukocytes whereas phagocytic cells associated with the TAMRA and CD45-labels had only surface bound leukocytes. This method also worked for examination of endothelial cell phagocytosis of apoptotic spleen lymphocytes or apoptotic myeloid cell lines (data not shown).
Previous phagocytosis assays using adherent cells demand timely and cumbersome microscopic counting to determine the actual number of phagocytes with internalized targets (2, 10, 17, 20). Our method, utilizing a simple labeling procedure and the power of flow cytometric analysis, quantifies the percent of phagocytic cells while easily distinguishing between phagocytosed cells and surface-bound cells. This provides a novel method to facilitate studies on the mechanisms of eukaryotic cell recognition of apoptotic cells. We anticipate that the assay will have broad applications to multiple other cell systems where one cell type is capable of phagocytosing another cell type.
ACKNOWLEDGMENTS
We thank Jim Cornelius, for help with cell sorting, Richard Montione, for help with confocal analysis, and Jay Card, for photographic preparation.
Contract grant sponsor: NIH; Contract grant number: NIAID AI34585 (to J.M.C.-M.); Contract grant sponsor: NCI; Contract grant number: CA61901 (to D.S.A.).
LITERATURE CITED
- 1.Akbar AN, Savill J, Gombert W, Bofill M, Borthwick NJ, Whitelaw F, Grundy J, Janossy G, Salmon M. The specific recognition by macrophages of CD8+, CD45RO+ T cells undergoing apoptosis: A mechanism for T cell clearance during resolution of viral infections. J Exp Med. 1994;180:1943–1947. doi: 10.1084/jem.180.5.1943. [DOI] [PMC free article] [PubMed] [Google Scholar]
- 2.Athamna A, Ofek I, Keisari Y, Markowitz S, Dutton GG, Sharon N. Lectinophagocytosis of encapsulated Klebsiella pneumoniae mediated by surface lectins of guinea pig alveolar macrophages and human monocyte-derived macrophages. Infect Immunity. 1991;59:1673–1682. doi: 10.1128/iai.59.5.1673-1682.1991. [DOI] [PMC free article] [PubMed] [Google Scholar]
- 3.Benhamou LE, Cazenave Peirre-A, Sarthou P. Anti-immunoglobulins induce death by apoptosis in WEHI-231 B lymphoma cells. Eur J Immunol. 1990;20:1405–1407. doi: 10.1002/eji.1830200630. [DOI] [PubMed] [Google Scholar]
- 4.Butcher EC. The regulation of lymphocyte traffic [review] Cur Topics Micro Immunol. 1986;128:85–122. doi: 10.1007/978-3-642-71272-2_3. [DOI] [PubMed] [Google Scholar]
- 5.Butcher EC, Weissman IL. Direct fluorescent labeling of cells with fluorescein or rhodamine isothiocyanate. I. Technical aspects. J Immunol Methods. 1980;37:97–108. doi: 10.1016/0022-1759(80)90195-7. [DOI] [PubMed] [Google Scholar]
- 6.Cohen JJ. Overview: Mechanisms of apoptosis. Immunol Today. 1993;14:126–130. doi: 10.1016/0167-5699(93)90214-6. [DOI] [PubMed] [Google Scholar]
- 7.Cook-Mills JM, Gallagher JS, Feldbush TL. Isolation and characterization of high endothelial cell lines derived from mouse lymph nodes. In Vitro Cell Dev Biol. 1996;32:167–177. doi: 10.1007/BF02723682. [DOI] [PubMed] [Google Scholar]
- 8.Dini L, Lentini A, Diez GD, Rocha M, Falasca L, Serafino L, Vidal-Vanaclocha F. Phagocytosis of apoptotic bodies by liver endothelial cells. J Cell Sci. 1995;108:967–973. doi: 10.1242/jcs.108.3.967. [DOI] [PubMed] [Google Scholar]
- 9.Duijvestijn A, Hamann A. Mechanisms and regulation of lymphocyte migration. Immunol Today. 1989;10:23–28. doi: 10.1016/0167-5699(89)90061-3. [DOI] [PubMed] [Google Scholar]
- 10.Fadok VA, Laszlo DJ, Noble PW, Weinstein L, Riches DW, Henson PM. Particle digestibility is required for induction of the phosphatidylserine recognition mechanism used by murine macrophages to phagocytose apoptotic cells. J Immunol. 1993;151:4274–4285. [PubMed] [Google Scholar]
- 11.Fadok VA, Savill JS, Haslett C, Braton DL, Doherty DE, Campbell PA, Henson PM. Different populations of macrophages use either the vitronectin receptor or the phosphatidylserine receptor to recognize and remove apoptotic cells. J Immunol. 1992;149:4029–4035. [PubMed] [Google Scholar]
- 12.Hall SE, Savill JS, Henson PM, Haslett C. Apoptotic neutrophils are phagocytosed by fibroblasts with participation of the fibroblast vitronectin receptor and involvement of a mannose/fucose-specific lectin. J Immunol. 1994;153:3218–3227. [PubMed] [Google Scholar]
- 13.Hibner U, Benhamou LE, Haury M, Cazenave Pierre-A, Sarthou P. Signaling of programmed cell death induction in WEHI-231 B lymphoma cells. Eur J Immunol. 1993;23:2821–2825. doi: 10.1002/eji.1830231115. [DOI] [PubMed] [Google Scholar]
- 14.Krammer PH, Behrmann I, Daniel P, Dhein J, Debatin Klaus-M. Regulation of apoptosis in the immune system. Curr Opin Immunol. 1994;6:279–289. doi: 10.1016/0952-7915(94)90102-3. [DOI] [PubMed] [Google Scholar]
- 15.Oh YK, Straubinger RM. Intracellular fate of Mycobacterium avium: Use of dual-label spectrofluorometry to investigate the influence of bacterial viability and opsonization on phagosomal pH and phagosomelysosome interaction. Infect Immunity. 1996;64:319–325. doi: 10.1128/iai.64.1.319-325.1996. [DOI] [PMC free article] [PubMed] [Google Scholar]
- 16.Parr MB, Kepple L, Parr EL. Langerhans cells phagocytose vaginal epithelial cells undergoing apoptosis during the murine estrous cycle. Biol Reprod. 1991;45:252–260. doi: 10.1095/biolreprod45.2.252. [DOI] [PubMed] [Google Scholar]
- 17.Ren Y, Savill J. Proinflammatory cytokines potentiate thrombospondinmediated phagocytosis of neutrophils undergoing apoptosis. J Immunol. 1995;154:2366–2374. [PubMed] [Google Scholar]
- 18.Sahlin S, Hed J, Rundquist I. Differentiation between attached and ingested immune complexes by a fluorescence quenching cytofluorometric assay. J Immunol Methods. 1983;60:115–124. doi: 10.1016/0022-1759(83)90340-x. [DOI] [PubMed] [Google Scholar]
- 19.Sambrano GR, Steinberg D. Recognition of oxidatively damaged and apoptotic cells by an oxidized low density lipoprotein receptor on mouse peritoneal macrophages: Role of membrane phosphatidylserine. Proc Natl Acad Sci USA. 1995;92:1396–1400. doi: 10.1073/pnas.92.5.1396. [DOI] [PMC free article] [PubMed] [Google Scholar]
- 20.Schlesinger LS. Macrophage phagocytosis of virulent but not attenuated strains of Myocbacterium tuberculosis is mediated by mannose receptors in addition to complement receptors. J Immunol. 1993;150:2920–2930. [PubMed] [Google Scholar]
- 21.Sellins KS, Cohen JJ. Gene induction by gamma-irradiation leads to DNA fragmentation in lymphocytes. J Immunol. 1987;139:3199–3206. [PubMed] [Google Scholar]
- 22.Wan CP, Park CS, Lau BH. A rapid and simple microfluorometric phagocytosis assay. J Immunol Methods. 1993;162:1–7. doi: 10.1016/0022-1759(93)90400-2. [DOI] [PubMed] [Google Scholar]
- 23.Wirth JJ, Fraker PJ, Kierszenbaum F. Zinc requirement for macrophage function: Effect of zinc deficiency on uptake and killing of a protozoan parasite. Immunology. 1989;68:114–119. [PMC free article] [PubMed] [Google Scholar]


