

Abstract
Background and Aims
After the initial boom in the application of flow cytometry in plant sciences in the late 1980s and early 1990s, which was accompanied by development of many nuclear isolation buffers, only a few efforts were made to develop new buffer formulas. In this work, recent data on the performance of nuclear isolation buffers are utilized in order to develop new buffers, general purpose buffer (GPB) and woody plant buffer (WPB), for plant DNA flow cytometry.
Methods
GPB and WPB were used to prepare samples for flow cytometric analysis of nuclear DNA content in a set of 37 plant species that included herbaceous and woody taxa with leaf tissues differing in structure and chemical composition. The following parameters of isolated nuclei were assessed: forward and side light scatter, propidium iodide fluorescence, coefficient of variation of DNA peaks, quantity of debris background, and the number of particles released from sample tissue. The nuclear genome size of 30 selected species was also estimated using the buffer that performed better for a given species.
Key Results
In unproblematic species, the use of both buffers resulted in high quality samples. The analysis of samples obtained with GPB usually resulted in histograms of DNA content with higher or similar resolution than those prepared with the WPB. In more recalcitrant tissues, such as those from woody plants, WPB performed better and GPB failed to provide acceptable results in some cases. Improved resolution of DNA content histograms in comparison with previously published buffers was achieved in most of the species analysed.
Conclusions
WPB is a reliable buffer which is also suitable for the analysis of problematic tissues/species. Although GPB failed with some plant species, it provided high-quality DNA histograms in species from which nuclear suspensions are easy to prepare. The results indicate that even with a broad range of species, either GPB or WPB is suitable for preparation of high-quality suspensions of intact nuclei suitable for DNA flow cytometry.
Key words: Cytosolic compounds, flow cytometry, general purpose buffer, genome size, lysis buffers, nuclear DNA content, nuclear DNA staining, propidium iodide, woody plant buffer
INTRODUCTION
Since the introduction of flow cytometry to plant sciences in the 1980s, estimation of nuclear DNA content has been the major application of flow cytometry in research, breeding and production (Doležel and Bartoš, 2005). The spread of the method was encouraged by the relative simplicity of sample preparation, which typically involves mechanical homogenization of plant tissues in a nuclear isolation buffer (Galbraith et al., 1983). The buffer should facilitate isolation of intact nuclei free of adhering cytoplasmic debris, maintain nuclei stability in liquid suspension and prevent their aggregation. It ought to protect nuclear DNA from degradation and provide an appropriate environment for specific and stoichiometric staining of nuclear DNA, including the minimization of negative effects of some cytosolic compounds on DNA staining.
With the aim to fulfil these needs and to analyse nuclear DNA content with the highest resolution, many laboratories developed their own nuclear isolation buffer formulas. The current release of the FLOWer database (http://flower.web.ua.pt/) lists 27 lysis buffers with different chemical compositions (Loureiro et al., 2007a). The usefulness of some of the buffers is difficult to judge as their performance has not been analysed thoroughly, nor have they been compared with other buffers. However, there are some exceptions and these are mainly the most popular buffers. Thus, de Laat et al. (1987) compared their buffer with a commercial solution, analysing the coefficient of variation (CV) of DNA peaks and the amount of debris background. Doležel et al. (1989) introduced the LB01 buffer by analysing the nuclear DNA content of leaves and in vitro cultured calli of several plant species. Arumuganathan and Earle (1991a) proposed a buffer containing MgSO4 and used it to estimate genome size in over 100 plant species (Arumuganathan and Earle, 1991b). Marie and Brown (1993) tested their new buffer in approx. 70 plant species. Ulrich and Ulrich (1991) and Doležel and Göhde (1995) showed the usefulness of so-called Otto solutions (Otto, 1990) for high resolution analyses of DNA content. Finally, Pfosser et al. (1995) tested Tris.MgCl2 buffer by evaluating the sensitivity of DNA flow cytometry to detect aneuploidy in wheat.
A systematic comparison of nuclear isolation buffers was done only recently by Loureiro et al. (2006a) who compared four of the most common buffers differing in chemical composition: Galbraith (Galbraith et al., 1983), LB01 (Doležel et al., 1989), Otto (Ulrich and Ulrich, 1991; Doležel and Göhde, 1995) and Tris.MgCl2 (Pfosser et al., 1995) buffers. Among others, the results confirmed the until then empirically known fact that due to the diversity of plant tissues in structure and chemical composition, no single buffer works well with every species (Doležel and Bartoš, 2005). Nonetheless, Loureiro et al. (2006a) showed that some lysis buffers consistently yielded better results than others, at least in unproblematic species in which high quality suspensions of isolated nuclei suitable for DNA flow cytometry could be prepared. The same set of buffers was evaluated while studying the effect of tannic acid, a common phenolic compound, on isolated plant nuclei and estimation of DNA content (Loureiro et al., 2006b). The study revealed that tannic acid affected fluorescence and light scatter properties of nuclei in suspension regardless of the isolation buffer. However, the extent of the negative effect of tannic acid was different for each buffer.
Stimulated by the results of Loureiro et al. (2006a, b), we decided to develop nuclear isolation buffers suitable for a broader range of plants. This paper reports on two new nuclear isolation buffers: general purpose buffer (GPB) and woody plant buffer (WPB). The performance of these buffers was evaluated by analysing a wide set of plant species representing 37 taxa belonging to 24 different families, including herbaceous and woody plant species, with tissues differing in structure and chemical composition. Also the genome size of 30 out of the 37 taxa was estimated using the buffer that performed better in a given species of which ten are new estimations.
MATERIALS AND METHODS
Plant material
Plants of Coriandrum sativum (commercial lot), Solanum lycopersicum ‘Stupické’, Pisum sativum ‘Ctirad’ and Vicia faba ‘Inovec’ were grown from seeds (seeds from the latter three taxa were provided by the Institute of Experimental Botany, Olomouc, Czech Republic). Plants of Festuca rothmaleri, Oxalis pes-caprae and Pterospartum tridentatum were kindly provided by Prof. Paulo Silveira, Dr Sílvia Castro and Eng. Armando Costa (Department of Biology, University of Aveiro, Portugal), respectively. Plants of Olea europaea, Quercus robur, Saintpaulia ionantha and Vitis vinifera were available from previous studies in the Laboratory of Biotechnology and Cytomics at University of Aveiro. Plants of Sedum burrito were obtained from Flôr do Centro Horticultural Centre (Mira, Portugal). All plants were maintained in a greenhouse at 22 ± 2 ºC, with a photoperiod of 16 h and a light intensity of 530 ± 2 µmol m−2 s−1. Leaves from the remaining taxa were collected directly from field-grown individuals in Aveiro and Oporto districts, Portugal, and either analysed immediately or maintained in a refrigerator on moistened paper for a maximum of 2 d until use.
Sample preparation
In each species, 40–50 mg of young leaf tissue was used for sample preparation. However, in Sedum burrito the quantity of leaf material required to release a sufficient number of nuclei had to be increased to approx. 500 mg (Loureiro et al., 2006a). Nuclear suspensions were prepared according to Galbraith et al. (1983) using our isolation buffers, GPB and WPB (Table 1). In each case, 1 mL of buffer solution was added to a Petri dish containing the plant tissue, which was chopped using a sharp razor blade for approx. 60 s. For genome size estimations, the buffer that performed better in a particular species was chosen and leaf tissue from both the sample and DNA reference standard (Table 2) were chopped simultaneously. The resulting homogenate was filtered through an 80-µm nylon filter to remove large debris. Nuclei were stained with 50 µg mL−1 propidium iodide (PI; Fluka, Buchs, Switzerland), and 50 µg mL−1 RNase (Sigma, St Louis, MO, USA) was added to nuclear suspension to prevent staining of double-stranded RNA. Samples were incubated on ice and analysed within 10 min.
Table 1.
Chemical composition of our nuclei isolation buffers, GPB and WPB
| Buffer | Composition* |
|---|---|
| GPB | 0·5 mm spermine.4HCl, 30 mm sodium citrate, 20 mm MOPS, 80 mm KCl, 20 mm NaCl, 0·5 % (v/v) Triton X-100, pH 7·0 |
| WPB | 0·2 m Tris.HCl, 4 mm MgCl2.6H2O, 2 mm EDTA Na2·2H2O, 86 mm NaCl, 10 mm sodium metabisulfite, 1 % PVP-10, 1 % (v/v) Triton X-100, pH 7·5 |
* Final concentrations are given. Both buffers should be stored in aliquots at 4 °C and remain stable for up to 3 months.
MOPS, 4-Morpholinepropane sulfonate; Tris, tris-(hydroxymethyl)-aminomethane; EDTA, ethylenediaminetetraacetic acid.
Table 2.
Estimation of genome size in selected plant species
| Genome size | ||||||||||||||
|---|---|---|---|---|---|---|---|---|---|---|---|---|---|---|
| This work | Previous reports | |||||||||||||
| Species | Family | 2C (pg) | 1C (Mbp)1 | Peak CV (%) | Stand. | 2C (pg) | Method | Reference | ||||||
| Acer negundo | Aceraceae | 1·07 ± 0·03 | 525 | 3·14 | S.l. | N.D. | ||||||||
| Actinidia deliciosa | Actinidaceae | 4·80 ± 0·06 | 2349 | 2·77 | P.s. | 4·45 | FCM:PI | Hopping, 1994 | ||||||
| 3·97 | FCM:PI | Ollitrault et al., 1994b | ||||||||||||
| Allium triquetrum | Alliaceae | 38·15 ± 0·38 | 18655 | 2·02 | V.f. | 36·30 | Fe | Jones and Rees, 1968 | ||||||
| 39·30 | Fe | Labani and Elkington, 1987 | ||||||||||||
| Aloysia triphylla | Verbenaceae | 1·47 ± 0·01 | 720 | 2·79 | S.l. | N.D. | ||||||||
| Chamaecyparis lawsoniana | Cupressaceae | 21·01 ± 0·15 | 10274 | 2·95 | V.f. | 23·05 | FCM:PI | Hizume et al., 2001 | ||||||
| 30·10 | Fe | Ohri and Khoshoo, 1986 | ||||||||||||
| Citrus limon | Rutaceae | 0·84 ± 0·005 | 409 | 3·74 | S.l. | 0·80 | FCM:PI | Ollitrault et al., 1994a | ||||||
| 0·77, 0·80 | FCM:PI | Kayim et al., 1998 | ||||||||||||
| 0·77–1·15 | FCM:PI | Iannelli et al., 1998 | ||||||||||||
| 1·24, 1·30 | FCM:PI | Capparelli et al., 2004 | ||||||||||||
| Citrus sinensis | Rutaceae | 0·87 ± 0·003 | 425 | 4·02 | S.l. | 0·75 | FCM:PI | Ollitrault et al., 1994a | ||||||
| 0·76, 0·85 | FCM:PI | Kayim et al., 1998 | ||||||||||||
| 0·76, 0·82 | FCM:PI | Arumuganathan and Earle, 1991b | ||||||||||||
| 1·20 | Fe | Nagl et al., 1983 | ||||||||||||
| 1·24 | Fe | Guerra, 1984 | ||||||||||||
| Coriandrum sativum | Apiaceae | 5·08 ± 0·10 | 2483 | 2·60 | P.s. | 4·10 | Fe | Olszewska and Osiecka, 1983 | ||||||
| 7·65, 9·55 | Fe | Das and Mallick, 1989 | ||||||||||||
| 8·85, 9·45 | Fe | Chattopadhyay and Sharma, 1990 | ||||||||||||
| Diospyros kaki | Ebenaceae | 5·08 ± 0·002 | 2482 | 2·27 | P.s. | N.D. | ||||||||
| Euphorbia peplus | Euphorbiaceae | 0·69 ± 0·004 | 335 | 4·50 | S.l. | N.D. | ||||||||
| Ficus carica | Moraceae | 0·73 ± 0·03 | 356 | 4·20 | S.l. | 1·41 | Fe | Ohri and Khoshoo, 1987 | ||||||
| Forsythia × intermedia | Oleaceae | 2·01 ± 0·01 | 985 | 3·22 | G.m. | N.D. | ||||||||
| Ginkgo biloba | Ginkgoaceae | 22·85 ± 0·15 | 11172 | 2·48 | V.f. | 19·50 | FCM:EB | Marie and Brown, 1993 | ||||||
| 21·60 | FCM:PI | Barow and Meister, 2002 | ||||||||||||
| 19·86 | Fe | Ohri and Khoshoo, 1986 | ||||||||||||
| 19·76 | Fe | Greilhuber, 1988 | ||||||||||||
| Ilex aquifolium | Aquifoliaceae | 1·93 ± 0·04 | 944 | 2·89 | G.m. | N.D. | ||||||||
| Laurus nobilis | Lauraceae | 6·50 ± 0·09 | 3215 | 2·26 | Z.m. | 6·10 | FCM:PI | Zonneveld et al., 2005 | ||||||
| Magnolia × soulangiana | Magnoliaceae | 9·83 ± 0·002 | 4806 | 2·43 | Z.m. | 11·95 | Fe | Nagl et al., 1977 | ||||||
| 14·20 | Fe | Olszewska and Osiecka, 1983 | ||||||||||||
| Malus × domestica | Rosaceae | 1·56 ± 0·02 | 765 | 3·39 | S.l. | 1·50–2·862 | FCM:PI | Dickson et al., 1992 | ||||||
| 1·52–2·482 | FCM:PI | Tatum et al., 2005 | ||||||||||||
| Olea europaea ssp. europaea | Oleaceae | 3·24 ± 0·02 | 1583 | 3·80 | P.s. | 4·40, 4·52 | Fe | Rugini et al., 1996 | ||||||
| 3·90–4·66 | Fe | Bitonti et al., 1999 | ||||||||||||
| 2·97–3·07 | FCM:PI | Loureiro et al., 2007b | ||||||||||||
| Papaver rhoeas | Papaveraceae | 11·00 ± 0·08 | 5378 | 1·95 | Z.m. | 5·202 | Fe | Nagl et al., 1983 | ||||||
| 5·252 | Fe | Bennett and Smith, 1976 | ||||||||||||
| 7·142 | Fe | Srivastava and Lavania, 1991 | ||||||||||||
| Pinus pinea | Pinaceae | 56·09 ± 1·83 | 27429 | 3·34 | V.f. | 60·80 | FCM:PI | Grotkopp et al., 2004 | ||||||
| Prunus domestica | Rosaceae | 0·66 ± 0·01 | 323 | 4·10 | S.l. | 0·61 | FCM:PI | Arumuganathan and Earle, 1991b | ||||||
| Prunus persica | Rosaceae | 0·62 ± 0·01 | 303 | 4·30 | S.l. | 0·54, 0·55 | FCM:PI | Arumuganathan and Earle, 1991b | ||||||
| 0·54, 0·55 | FCM:PI | Dickson et al., 1992 | ||||||||||||
| 0·57–0·64 | FCM:PI | Baird et al., 1994 | ||||||||||||
| Pterospartum tridentatum | Fabaceae | 4·64 ± 0·05 | 2269 | 2·92 | Z.m. | N.D. | ||||||||
| Pyrus communis | Rosaceae | 1·24 ± 0·03 | 605 | 3·00 | S.l. | 1·03, 1·11 | FCM:PI | Arumuganathan and Earle, 1991b | ||||||
| 1·11 | FCM:PI | Dickson et al., 1992 | ||||||||||||
| Quercus robur | Fagaceae | 1·98 ± 0·06 | 968 | 2·88 | G.m. | 1·85 | FCM:EB | Favre and Brown, 1996 | ||||||
| 1·90 | FCM:EB | Zoldoš et al., 1998 | ||||||||||||
| Rosa sp. | Rosaceae | 2·46 ± 0·10 | 1204 | 2·89 | Z.m. | 0·78–3·042 | FCM:PI | Yokoya et al., 2000 | ||||||
| 0·20–1·652 | FCM:PI | Dickson et al., 1992 | ||||||||||||
| 0·25–1·302 | Fe | Bennett and Smith, 1976 | ||||||||||||
| 2·852 | Fe | Greilhuber, 1988 | ||||||||||||
| Saintpaulia ionantha | Gesneriaceae | 1·50 ± 0·02 | 732 | 3·41 | S.l. | N.D. | ||||||||
| Salix babylonica | Salicaceae | 1·61 ± 0·01 | 786 | 2·65 | S.l. | N.D. | ||||||||
| Tamarix africana | Tamaricaceae | 3·30 ± 0·03 | 1612 | 2·66 | Z.m. | N.D. | ||||||||
| Vitis vinifera | Vitaceae | 1·19 ± 0·02 | 583 | 2·86 | S.l. | 1·00 | FCM:PI | Arumuganathan and Earle, 1991b | ||||||
| 1·60 | FCM:HO | Faure and Nougarède, 1993 | ||||||||||||
| 0·86–1·00 | FCM:PI | Lodhi and Reisch, 1995 | ||||||||||||
| 1·17–1·26 | FCM:PI | Leal et al., 2006 | ||||||||||||
Values are given as mean and standard deviation of the mean genome size in mass values (2C, pg) and base pairs (1C, Mbp).
The coefficient of variation (Peak CV,%) of sample G0/G1 peaks and the reference standard (Stand.) used to estimate the genome size in each species (S.l., Solanum lycopersicum ‘Stupické’, 2C = 1·96 pg DNA, Doležel et al., 1992; G.m., Glycine max ‘Polanka’, 2C = 2·50 pg DNA, Doležel et al., 1994; Z.m., Zea mays ‘CE-777’, 2C = 5·43 pg DNA, Lysák and Doležel, 1998; P.s., Pisum sativum ‘Ctirad’, 2C = 9·09 pg DNA, Doležel et al., 1998; V.f., Vicia faba ‘Inovec’, 2C = 26·90 pg DNA, Doležel et al., 1992) are also given. For each species, previous genome size estimations together with the used methodology (Fe, Feulgen microdensitometry; FCM, flow cytometry; PI, propidium iodide; EB, ethidium bromide; HO, Hoechst 33342) and original reference are also provided.
N.D., not determined.
1 1 pg = 978 Mbp (Doležel et al., 2003).
2 These values may reflect differences in the ploidy level.
Flow cytometric analyses
Samples were analysed with a Coulter EPICS XL (Beckman Coulter®, Hialeah, FL, USA) flow cytometer equipped with an air-cooled argon-ion laser tuned to 15 mW and operating at 488 nm. Fluorescence was collected through a 645-nm dichroic long-pass filter in reflecting mode and a 620-nm band-pass filter. The results were acquired using the SYSTEM II software (version 3·0, Beckman Coulter®). The instrument settings (amplification and sample rate) were kept constant throughout the experiment and, for the species which had been analysed in Loureiro et al. (2006a), they were the same as those used in that report.
The following parameters were analysed in each sample: forward scatter (FS) as a rough measure of particle's size, side scatter (SS) as a measure of particle's optical complexity, fluorescence intensity of PI-stained nuclei (FL), CV of G0/G1 peaks as a measure of nuclear integrity and variation in DNA staining, a debris background factor (DF) as a measure of sample quality, and a nuclear yield factor (YF) in order to compare the quantity of nuclei in suspension independently of the amount of sample tissue used. DF and YF were determined as follows (Loureiro et al., 2006a):
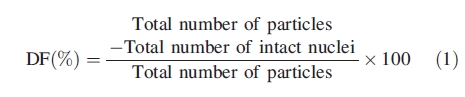 |
1 |
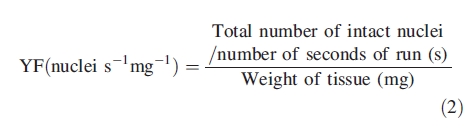 |
2 |
Histograms of FL obtained with each buffer were overlaid using WinMDI software (Trotter, 2000; Fig. 1). In each species, five replicates per buffer were performed on three different days. In each replicate at least 5000 nuclei were analysed.
Fig. 1.
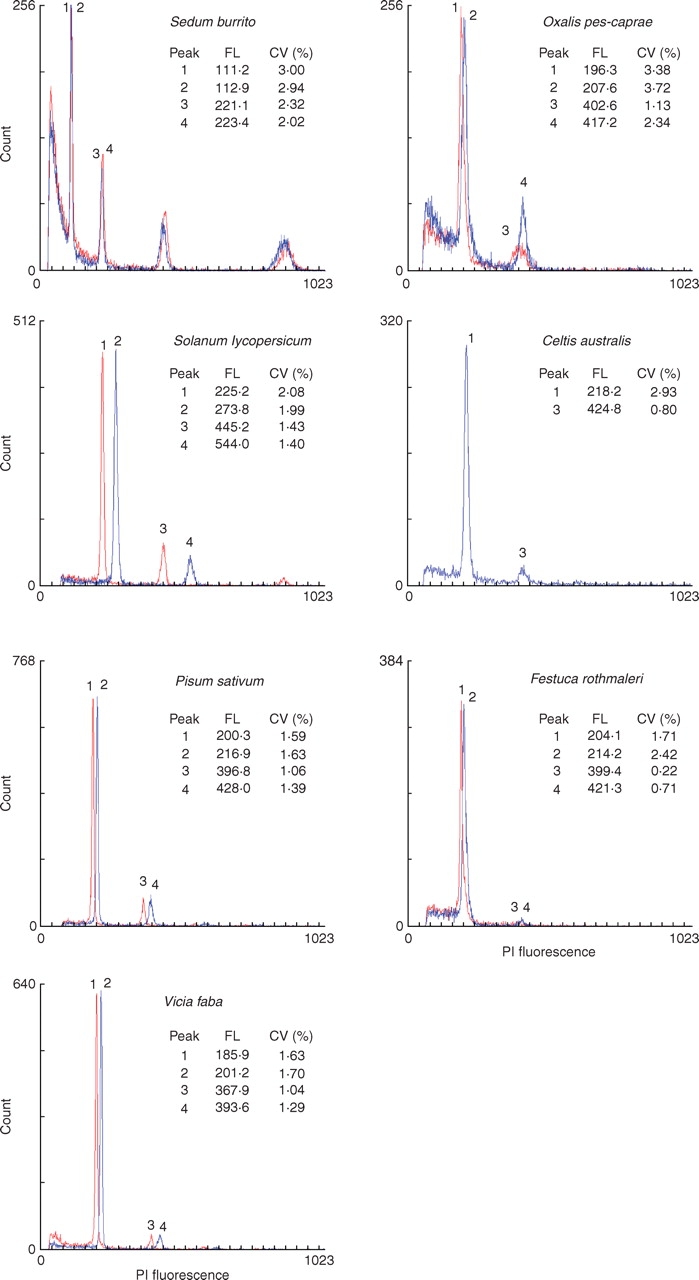
Histograms of relative fluorescence intensities (PI fluorescence, channel numbers) with overlays of distributions obtained with the general purpose buffer (GPB, red) and the woody plant buffer (WPB, blue). Mean channel numbers (FL) and coefficients of variation (CV,%) of G0/G1 (peaks 1 and 2) and G2 peaks (peaks 3 and 4) are given.
For genome size estimations, three replicates on three different days were made using the buffer that performed better in a given species. The best buffer was usually characterized by higher FL and YF and lower CV and DF, with the main evaluating parameters being the FL and the CV. The nuclear DNA content of each species was calculated according to the formula:
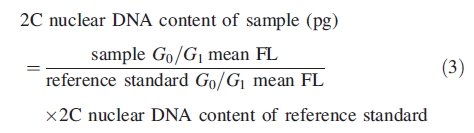 |
3 |
Conversion of mass values into numbers of base pairs was done according to the factor 1 pg = 978 Mbp (Doležel et al., 2003).
Statistical analyses
Differences between both buffers for each parameter were analysed using a t-test (SigmaStat for Windows Version 3·1, SPSS Inc., Richmond, CA, USA).
RESULTS
Performance of the nuclear isolation buffers
Testing the two new buffers with 37 plant species revealed pronounced differences (Table 3). Out of the seven species that were analysed by Loureiro et al. (2006a) (highlighted in Table 3), the use of either buffer resulted in good DNA content histograms in Festuca rothmaleri, Oxalis pes-caprae and Sedum burrito, and very good histograms in Solanum lycopersicum, Pisum sativum and Vicia faba (Fig. 1). The only exception was Celtis australis in which measurable samples were only obtained with WPB (Fig. 1). Out of the remaining 30 taxa, GPB yielded acceptable histograms with CVs below 5·0 % and no detectable ‘tannic acid effect’ (Loureiro et al., 2006b) in only 15 of them (i.e. 50 % success rate), while WPB worked well with all 30 species. In most of the species where GPB failed, an effect similar to the ‘the tannic acid effect’ was observed. This effect was first described by Loureiro et al. (2006b) and involved the occurrence of two new populations of particles on cytograms of forward scatter vs. side scatter, and side scatter vs. fluorescence (arrows in Fig. 2). The tannic acid effect resulted in fluorescence histograms with higher DF, higher CVs of G0/G1 peaks, and lower nuclear fluorescence (Fig. 2).
Table 3.
Flow cytometric parameters assessed in each species
| FS (channel units) | SS (channel units) | FL (channel units) | CV (%) | DF (%) | YF (nuclei s−1 mg−1) | |||||||||
|---|---|---|---|---|---|---|---|---|---|---|---|---|---|---|
| Taxa | G.t. | Buffer | Mean | SD | Mean | SD | Mean | SD | Mean | SD | Mean | SD | Mean | SD |
| Acer negundo L. | W | GPB | – | – | – | – | – | – | – | – | – | – | – | – |
| WPB | 29·16 | 3·05 | 26·14 | 10·24 | 234·3 | 17·2 | 3·24 | 0·35 | 16·45 | 1·62 | 0·79 | 0·27 | ||
| Actinidia deliciosa (A Chev.) C.F. Liang & A.R. Ferguson | H | GPB | 5·85a | 2·53 | 10·56a | 2·29 | 197·1a | 10·3 | 3·02a | 0·19 | 14·00a | 4·15 | 0·45a | 0·17 |
| WPB | 16·60b | 3·93 | 13·74a | 3·02 | 210·2a | 8·4 | 2·76a | 0·36 | 12·22a | 0·82 | 0·84b | 0·56 | ||
| Allium triquetrum L. | H | GPB | 9·02a | 1·49 | 5·12a | 1·75 | 194·9a | 2·6 | 1·79a | 0·38 | 12·47a | 2·39 | 0·22a | 0·08 |
| WPB | 12·88b | 1·53 | 4·77a | 1·19 | 194·2a | 3·2 | 2·14a | 0·29 | 10·51a | 2·08 | 0·35b | 0·07 | ||
| Aloysia triphylla (L'Hér.) Britton | W | GPB | – | – | – | – | – | – | – | – | – | – | – | – |
| WPB | 10·13 | 1·13 | 6·88 | 0·78 | 203·2 | 11·6 | 2·93 | 0·37 | 25·68 | 6·13 | 0·63 | 0·11 | ||
| Chamaecyparis lawsoniana (Murr.) Parl. | W | GPB | 24·72a | 7·40 | 33·82a | 20·37 | 193·1a | 4·8 | 2·56a | 0·25 | 36·18a | 5·53 | 0·10a | 0·04 |
| WPB | 14·88b | 1·47 | 16·82a | 0·64 | 192·8a | 3·1 | 2·48a | 0·17 | 35·26a | 1·37 | 0·13a | 0·05 | ||
| Celtis australis L. | W | GPB | – | – | – | – | – | – | – | – | – | – | – | – |
| WPB | 54·25 | 16·27 | 9·59 | 3·95 | 208·0 | 13·8 | 2·99 | 0·38 | 21·31 | 4·76 | 0·30 | 0·20 | ||
| Citrus limon (L.) Burm. f. | W | GPB | 2·29a | 1·86 | 3·34a | 0·56 | 171·3a | 5·4 | 3·62a | 0·26 | 16·50a | 3·86 | 1·00a | 0·39 |
| WPB | 4·15a | 1·89 | 3·45a | 0·690 | 170·6a | 8·1 | 3·75a | 0·30 | 12·09a | 2·66 | 1·13a | 0·30 | ||
| Citrus sinensis (L.) Osbeck | W | GPB | 1·44a | 2·05 | 6·00a | 3·90 | 174·9a | 7·0 | 3·75a | 0·34 | 18·00a | 6·44 | 0·89a | 0·26 |
| WPB | 4·36a | 2·14 | 10·83a | 3·13 | 192·1b | 14·6 | 4·29a | 1·25 | 17·28a | 6·57 | 1·30b | 0·24 | ||
| Coriandrum sativum L. | H | GPB | 19·52a | 2·58 | 18·90a | 4·26 | 206·1a | 4·3 | 2·69a | 0·70 | 26·56a | 9·43 | 0·89a | 0·40 |
| WPB | 18·92a | 6·04 | 29·58b | 7·99 | 199·8a | 7·0 | 2·13a | 0·12 | 12·84b | 1·48 | 2·16b | 0·72 | ||
| Diospyros kaki L. f. | W | GPB | – | – | – | – | – | – | – | – | – | – | – | – |
| WPB | 21·28 | 6·42 | 13·96 | 6·41 | 205·7 | 4·8 | 2·09 | 0·20 | 26·36 | 3·92 | 0·68 | 0·24 | ||
| Euphorbia peplus L. | H | GPB | 15·10a | 3·49 | 15·36a | 6·50 | 202·2a | 3·0 | 3·66a | 0·13 | 36·12a | 4·50 | 2·74a | 0·76 |
| WPB | 9·72b | 0·93 | 12·26a | 1·95 | 221·1b | 4·9 | 4·00a | 0·58 | 38·80a | 2·43 | 2·11b | 0·41 | ||
| Festuca rothmaleri (Litard.) Markgr.-Dann. | H | GPB | 12·76a | 2·20 | 7·91a | 1·02 | 205·4a | 14·7 | 2·59a | 0·60 | 9·67a | 1·97 | 0·21a | 0·15 |
| WPB | 15·52a | 6·12 | 15·03b | 3·50 | 209·5a | 8·7 | 3·25a | 0·75 | 10·33a | 5·46 | 0·59b | 0·35 | ||
| Ficus carica L. | W | GPB | – | – | – | – | – | – | – | – | – | – | – | – |
| WPB | 20·60 | 5·00 | 8·77 | 3·49 | 214·9 | 4·6 | 4·16 | 0·31 | 26·98 | 2·16 | 0·46 | 0·11 | ||
| Forsythia × intermedia Zabel | W | GPB | – | – | – | – | – | – | – | – | – | – | – | – |
| WPB | 44·42 | 2·31 | 26·62 | 8·78 | 198·2 | 10·7 | 2·70 | 0·36 | 10·00 | 1·01 | 1·07 | 0·34 | ||
| Ginkgo biloba L. | W | GPB | – | – | – | – | – | – | – | – | – | – | – | – |
| WPB | 10·84 | 2·14 | 20·42 | 4·35 | 196·6 | 8·8 | 2·35 | 0·39 | 19·98 | 5·06 | 0·32 | 0·22 | ||
| Ilex aquifolium L. | W | GPB | 15·03a | 1·56 | 20·70a | 6·29 | 194·0a | 19·9 | 4·10a | 0·91 | 18·48a | 4·64 | 1·01a | 0·72 |
| WPB | 9·50b | 1·65 | 22·32a | 15·58 | 271·4b | 13·6 | 2·57b | 0·34 | 19·16a | 2·62 | 1·20a | 0·63 | ||
| Laurus nobilis L. | W | GPB | – | – | – | – | – | – | – | – | – | – | – | – |
| WPB | 19·88 | 7·22 | 3·65 | 1·44 | 235·5 | 5·4 | 2·35 | 0·60 | 25·78 | 4·96 | 0·84 | 0·56 | ||
| Magnolia × soulangeana Soul.-Bod. | W | GPB | 28·60a | 2·33 | 22·13a | 3·92 | 141·3a | 9·5 | 2·90a | 0·81 | 4·13a | 1·25 | 0·90a | 0·18 |
| WPB | 28·58a | 2·35 | 24·60a | 2·13 | 199·5b | 4·0 | 1·80b | 0·12 | 9·26b | 2·38 | 0·80a | 0·22 | ||
| Malus × domestica (Borkh.) Borkh. | W | GPB | 8·83a | 2·45 | 26·94a | 13·23 | 202·8a | 2·3 | 3·70a | 0·66 | 17·98a | 0·34 | 1·10a | 0·38 |
| WPB | 9·84a | 2·07 | 15·14a | 2·30 | 214·2b | 5·1 | 3·24a | 0·46 | 16·82a | 3·80 | 1·89a | 0·82 | ||
| Olea europaea L. ssp. europaea | W | GPB | 16·56a | 4·37 | 11·26a | 4·03 | 178·1a | 10·5 | 2·97a | 0·56 | 23·72a | 3·02 | 0·16a | 0·06 |
| WPB | 12·38a | 0·97 | 12·22a | 1·66 | 210·3b | 5·0 | 2·18b | 0·26 | 17·28b | 1·30 | 0·33b | 0·10 | ||
| Oxalis pes-caprae L. | H | GPB | 54·50a | 19·49 | 9·00a | 5·10 | 198·7a | 11·7 | 3·29a | 0·29 | 8·94a | 2·48 | 0·68a | 0·16 |
| WPB | 66·19a | 34·88 | 11·34a | 5·47 | 206·3a | 5·0 | 3·80a | 1·06 | 11·94a | 3·99 | 0·64a | 0·15 | ||
| Papaver rhoeas L. | H | GPB | – | – | – | – | – | – | – | – | – | – | – | – |
| WPB | 19·98 | 3·33 | 20·28 | 6·26 | 199·2 | 10·1 | 2·65 | 0·53 | 23·00 | 14·39 | 0·24 | 0·10 | ||
| Pinus pinea L. | W | GPB | – | – | – | – | – | – | – | – | – | – | – | – |
| WPB | 57·58 | 10·57 | 98·14 | 28·47 | 185·6 | 12·4 | 3·09 | 0·30 | 22·88 | 5·23 | 0·03 | 0·02 | ||
| Pisum sativum L. | H | GPB | 12·59a | 2·43 | 4·50a | 2·43 | 185·1a | 4·2 | 1·79a | 0·23 | 11·98a | 2·62 | 0·62a | 0·23 |
| WPB | 32·34b | 2·95 | 6·49a | 2·95 | 195·5b | 5·7 | 1·92a | 0·18 | 7·39b | 1·21 | 1·15b | 0·28 | ||
| Prunus domestica L. | W | GPB | 4·25a | 0·98 | 3·76a | 0·52 | 189·9a | 1·7 | 4·35a | 0·46 | 21·98a | 3·13 | 1·64a | 0·38 |
| WPB | 10·45b | 2·27 | 6·04b | 1·38 | 204·6a | 5·0 | 4·24a | 0·53 | 22·98a | 4·76 | 1·82a | 0·42 | ||
| Prunus persica (L.) Batsch | W | GPB | – | – | – | – | – | – | – | – | – | – | – | – |
| WPB | 8·87 | 2·12 | 8·38 | 2·16 | 219·0 | 8·1 | 4·91 | 0·70 | 21·22 | 4·98 | 1·31 | 0·46 | ||
| Pterospartum tridentatum (L.) Willk. | H | GPB | 31·84a | 12·80 | 45·86a | 15·99 | 196·8a | 6·9 | 3·25a | 0·76 | 29·40a | 2·18 | 1·18a | 0·78 |
| WPB | 12·38b | 2·66 | 13·82b | 1·63 | 201·5a | 5·9 | 2·71a | 0·32 | 29·38a | 3·31 | 0·87a | 0·64 | ||
| Pyrus communis L. | W | GPB | – | – | – | – | – | – | – | – | – | – | – | – |
| WPB | 8·26 | 2·98 | 14·59 | 3·96 | 203·0 | 5·1 | 3·20 | 0·36 | 18·26 | 3·24 | 1·66 | 0·23 | ||
| Quercus robur L. | W | GPB | – | – | – | – | – | – | – | – | – | – | – | – |
| WPB | 13·96 | 1·75 | 19·86 | 0·90 | 212·7 | 8·3 | 2·76 | 0·75 | 26·64 | 5·19 | 0·56 | 0·41 | ||
| Rosa L. sp. | W | GPB | – | – | – | – | – | – | – | – | – | – | – | – |
| WPB | 20·44 | 3·99 | 12·17 | 4·41 | 200·1 | 5·5 | 2·46 | 0·35 | 18·98 | 2·49 | 1·52 | 0·58 | ||
| Saintpaulia ionantha Wendl. | H | GPB | – | – | – | – | – | – | – | – | – | – | – | – |
| WPB | 12·25 | 1·76 | 22·76 | 3·89 | 204·7 | 5·2 | 3·42 | 0·31 | 22·32 | 1·99 | 0·47 | 0·17 | ||
| Salix babylonica L. | W | GPB | 10·80a | 3·91 | 8·62a | 4·98 | 192·9a | 9·0 | 3·45a | 0·18 | 32·52a | 3·86 | 1·30a | 0·46 |
| WPB | 6·53b | 0·54 | 4·24a | 1·91 | 194·0a | 7·6 | 3·17a | 0·43 | 26·24a | 5·26 | 1·53a | 0·88 | ||
| Sedum burrito R. Moran | S | GPB | 8·34a | 1·90 | 0·55a | 0·34 | 114·0a | 3·2 | 3·00a | 0·50 | 54·64a | 6·94 | 0·10a | 0·03 |
| WPB | 12·81b | 0·92 | 0·58a | 0·16 | 113·1a | 4·2 | 3·24a | 0·32 | 49·96a | 11·97 | 0·09a | 0·04 | ||
| Solanum lycopersicum L. | H | GPB | 7·61a | 1·10 | 1·14a | 0·40 | 232·9a | 6·7 | 2·31a | 0·49 | 15·16a | 1·85 | 1·00a | 0·46 |
| WPB | 11·53b | 1·30 | 1·72a | 0·78 | 264·8b | 7·9 | 2·23a | 0·14 | 14·36a | 1·50 | 1·33a | 0·40 | ||
| Tamarix africana Poir. | W | GPB | – | – | – | – | – | – | – | – | – | – | – | – |
| WPB | 26·60 | 3·11 | 22·88 | 4·91 | 208·8 | 5·5 | 2·75 | 0·28 | 39·00 | 4·46 | 0·96 | 0·31 | ||
| Vicia faba L. | H | GPB | 36·84a | 7·26 | 4·46a | 1·04 | 202·3a | 4·7 | 1·60a | 0·23 | 7·25a | 2·44 | 0·21a | 0·12 |
| WPB | 74·35b | 11·33 | 6·49b | 1·33 | 212·3b | 5·2 | 1·72a | 0·18 | 6·45b | 1·25 | 1·03b | 0·35 | ||
| Vitis vinifera L. | W | GPB | 7·33a | 3·09 | 3·99a | 1·95 | 206·6a | 6·2 | 4·77a | 0·42 | 27·46a | 8·23 | 0·65a | 0·21 |
| WPB | 4·32a | 0·90 | 2·67a | 1·44 | 213·1a | 8·2 | 3·57b | 0·20 | 21·86a | 6·92 | 1·29b | 0·49 | ||
Values are given as mean and standard deviation of the mean (SD) of forward scatter (FS, channel units), side scatter (SS, channel units), fluorescence (FL, channel units), coefficient of variation of G0/G1 DNA peak (CV,%), debris background factor (DF,%) and yield factor (YF,%).
Means for the same species followed by the same letter (a or b) are not statistically different according to a t-test at P ≤ 0·05.
The buffer chosen for the genome size estimations in each species is shown in bold type.
G.t., Growth type; W, woody; H, herbaceous; S, succulent; GPB, general purpose buffer; WPB, woody plant buffer.
Fig. 2.

Cytograms of forward scatter (logarithmic scale, FS log) vs. side scatter (logarithmic scale, SS log) (A, D), histograms of PI fluorescence intensity (PI fluorescence, channel numbers) (B, E), and cytograms of SS log vs. PI fluorescence (C, F) of nuclear suspensions of Rosa sp. obtained with WPB (A–C) and GPB (D–F). An effect similar to the ‘tannic acid effect’ (Loureiro et al., 2006b) was observed in nuclear suspensions obtained with GPB. Arrows indicate two additional populations of particles. The first population comprises nuclei to which weakly fluorescent particles were attached (higher SS and FL values). The second population consists of clumps of weakly fluorescent particles (higher SS and lower FL values). Mean channel numbers (Mean channel) and coefficients of variation (CV,%) of G0/G1 peaks are given.
Whereas the GPB performed better than WPB in 57·1 % of the original set of seven species (Loureiro et al., 2006a), in the remaining 15 taxa where both buffers worked well, it was only better in Allium triquetrum and Euphorbia peplus. The better-performing buffer was usually characterized by higher FL and YF and lower CV and DF values (Table 3).
The yield factor was the parameter where more statistically significant differences were detected between both buffers (47·6 % of the species). With the exception of Euphorbia peplus, the differences observed were due to a higher yield observed with WPB. Also, when statistically significant differences were observed for FL (i.e. in 42·8 % of the cases), they were due to higher fluorescence of nuclei isolated with WPB than with GPB.
In 18 species, the CVs were lower than 3·0 %; in the remaining species, CVs ranged from 3·0 % to 5·0 %. The lowest CVs were observed after analysing Allium triquetrum nuclei isolated with WPB (mean CV = 1·79 %). Statistical analysis revealed that in contrast to YF and FL, CVs were more homogenous between buffers, with significant differences between both buffers being only detected in four species. Major differences in CVs were detected in Ilex aquifolium (2·57 % and 4·10 % for WPB and GPB, respectively), and Vitis vinifera (3·57 % and 4·77 % for WPB and GPB, respectively). Even if significant differences were detected between the two remaining species, Olea europaea and Magnolia × soulangeana, the CVs were low (<3 %) with any buffer.
When evaluating the DF, significant differences between the isolation buffers were only observed in five species, Coriandrum sativum, Magnolia × soulangeana, Olea europaea, Pisum sativum and Vicia faba. With the exception of Magnolia × soulangeana, samples isolated with GPB exhibited higher debris background. Although the DF differed in Magnolia × soulangeana, Pisum sativum and Vicia faba, they were among the lowest values obtained in this study. Contrarily, the species with the highest background debris were Tamarix africana, Euphorbia peplus, Chamaecyparis lawsoniana and Salix babylonica, with values usually higher than 30 %. In most of the other species, DF usually ranged between 10 % and 20 %.
Nuclei isolated with WPB and GPB differed more in FS than in SS. Out of the 21 species where both buffers worked well, FS values were significantly different in 11 species, while only in five species was this observed for SS. Pterospartum tridentatum, Prunus domestica and Vicia faba were the only species with statistically significantly differences between buffers, for both parameters.
Estimation of nuclear genome size
Table 2 lists C-values for 30 species as determined in this study, five of which are first estimates using flow cytometry and ten are new estimates. The buffer that performed better with each species was selected to estimate its genome size.
As expected, mean CVs of DNA peaks (Table 2 and Fig. 3) were generally within the range of values obtained in the first part of the study (Table 3). Also, the standard deviations were low, with values higher than 4 % in only one species (Rosa sp., 4·06 %), indicating that the three replicates per species on three different days yielded homogenous estimates of nuclear DNA amount.
Fig. 3.

Histograms of relative fluorescence intensities (PI fluorescence, channel numbers) obtained after simultaneous analysis of nuclei isolated from sample (peak 1) and internal reference standard (peak 2) using the buffer that performed better (see Table 3). The following reference standards were used: Solanum lycopersicum ‘Stupické’ (2C = 1·96 pg DNA) (A, C, D, F, I, K); Glycine max ‘Polanka’ (2C = 2·50 pg DNA) (G, L); Zea mays ‘CE-777’ (2C = 5·43 pg DNA) (H); Pisum sativum ‘Ctirad’ (2C = 9·09 pg DNA) (B, E); Vicia faba'Inovec' (2C = 26·90 pg DNA) (J). Mean channel number (Mean), DNA index (DI = mean channel number of sample/mean channel number of internal reference standard), and coefficients of variation (CV,%) of G0/G1 peaks are given.
Plant species used in this work have a wide range of genome size, ranging from 0·62 pg/2C DNA in Prunus persica to 56·09 pg/2C DNA in Pinus pinea. Following the genome size classes (in C-values) of Soltis et al. (2003), most of the species studied in this work (80·0 %) belong to the ‘very small’ (≤1·4 pg) or ‘small’ (>1·4 to ≤3·5 pg) genome size categories. In four species (13·3 %) ‘intermediate’ (>3·5 to ≤14·0 pg) genome sizes were found and only two species (6·7 %) are characterized by ‘large’ (>14·0 to ≤35·0 pg) or ‘very large’ (>35·0 pg) genomes. While in some species our assessments were in close agreement with previous reports, considerable differences were observed in other cases with most of the discrepancies concerning the results obtained with Feulgen microdensitometry (Table 2).
DISCUSSION
Our recent studies (Loureiro et al., 2006a,b) provided quantitative data on performance of the most popular nuclear isolation buffers and showed that none of them worked well with all species that represented different types of leaf tissues and different nuclear genome sizes. It was also clear that the chemical composition was important to cope with the negative effect of cytosolic compounds such as tannic acid. The results of these studies prompted us to develop improved buffers.
The popular nuclear isolation buffers are based on organic buffers such as MOPS (Galbraith et al., 1983), Tris (Doležel et al., 1989; Pfosser et al., 1995) and 4-(hydroxymethyl)piperazine-1-ethanesulfonic acid (HEPES) (de Laat et al., 1987; Arumuganathan and Earle, 1991a) that stabilize pH of the solution and keep nuclei in an intact or even sub-vital state (Greilhuber et al., 2007). Non-ionic detergents, such as Triton X-100 and Tween 20, are used to facilitate the release of nuclei from cells and prevent nuclei clumping and attachment of debris, while the nuclear chromatin is stabilized by Mg2+ (Galbraith et al., 1983; Arumuganathan and Earle, 1991a) or spermine (Doležel et al., 1989). In some buffers, chelating agents (e.g. EDTA, sodium citrate) are added to bind divalent cations, which serve as cofactors of DNases; inorganic salts (e.g. KCl, NaCl) are used to achieve proper ionic strength (Doležel and Bartoš, 2005). Some buffers are supplemented with reducing agents such as β-mercaptoethanol, metabisulfite and dithiothreitol to prevent the action of phenolic compounds, while PVP is added to bind the phenolics kept in a reduced state (Greilhuber et al., 2007).
GPB was developed considering the results of Loureiro et al. (2006a) and its chemical composition is based on that of LB01, the buffer that performed best in that study. As MOPS was shown to be a better buffer than Tris, this component was used in GPB instead of Tris at the same concentration as in the Galbraith's buffer. Moreover, the concentration of Triton X-100 in GPB was raised to 0·5 % which helped to keep isolated nuclei free from attached debris (Loureiro et al., 2006a, b). The composition of WPB is based on the Tris.MgCl2 buffer, which counteracts the negative effects of tannic acid better than other buffers (Loureiro et al., 2006b). The WPB formula includes a chelating agent and inorganic salt (both from LB01 buffer) and Triton X-100 at 1·0 % (the highest concentration reported in the literature). Although a simultaneous inclusion of MgCl2 and EDTA has been proposed to be counterproductive (Greilhuber et al., 2007), preliminary tests did not reveal any negative effect on nuclei quality and stability, possibly due to a higher affinity of EDTA to other metals and to a sufficient concentration of free Mg2+ in the solution necessary to stabilize the chromatin structure. Sodium metabisulfite (a reducing agent) and PVP-10 (a phenol competitor) were added to make WPB suitable for use in recalcitrant species such as woody plants with tissues rich in phenols and other secondary metabolites.
The main goal of this work was to develop new formulas for nuclei isolation buffers based on the experience with existing ones, generally using their components at the same concentrations. Systematic evaluation of the effects of different concentrations of each component was beyond the scope of this study. However, future efforts on the improvement of nuclei isolation buffers should consider this aspect.
Both buffers described in this work provided good results in many of the 37 species. However, while good samples of isolated nuclei could be prepared from any species using WPB, GPB failed in most woody plants. On the other hand, in unproblematic species GPB resulted in samples of similar or higher quality than those obtained with WPB.
Woody plants are considered recalcitrant for DNA flow cytometry as their tissues often contain cytosolic compounds that interfere with fluorescent staining of nuclear DNA (Noirot et al., 2000, 2005; Loureiro et al., 2006b). This was the case in most of the species where GPB failed and where the tannic acid effect was observed. The addition of sodium metabisulfite and PVP-10 to WPB seemed essential for its success in species where GPB failed and for the overall good performance of WPB. Sodium metabisulfite, PVP, and other compounds with similar properties (e.g. β-mercaptoethanol, ascorbic acid) had been used previously to counteract the negative effect of cytosolic compounds on nuclear fluorescence in oak (Zoldoš et al., 1998), rose (Yokoya et al., 2000) and olive (Loureiro et al., 2007b). Antioxidants keep phenolics in a reduced state, enabling the reversibility of the free hydrogen bonds and its resolution by an added competitor (usually PVP-10 or PVP-40) (Greilhuber et al., 2007).
Generally, GPB and WPB yielded better results than the four popular buffers evaluated by Loureiro et al. (2006a). This was evident for the CV of DNA peaks, as in most species an improvement in peak resolution was achieved. Improved nuclear fluorescence and less debris background were also observed with the new buffers. Unexpectedly, in Celtis australis measurable samples were only obtained with WPB. Although GPB has the same concentration of Triton X-100 as the Tris.MgCl2 buffer (the best buffer for this species in Loureiro et al., 2006a), it failed to surpass the negative effect of mucilaginous compounds. Interestingly, both GPB and WPB seem to exhibit good buffering capacity, as they were suitable for isolation of nuclei from leaf tissues of Oxalis pes-caprae with highly acidic cell sap (Loureiro et al., 2006a; Castro et al., 2007). The only apparent drawback of GPB and WPB was that for some species (especially in the unproblematic ones) rather low YF was observed. This was surprising as the concentration of Triton X-100 in both buffers was increased as compared with LB01 and Galbraith buffers. However, this drawback can be compensated by using a higher amount of sample tissue.
Despite their commonness and/or economical interest, until now DNA content has not been analysed by flow cytometry in 15 out of the 37 species used in this study. Moreover, in Chamaecyparis lawsoniana (Hizume et al., 2001), Ginkgo biloba (Marie and Brown, 1993; Barow and Meister, 2002), Laurus nobilis (Zonneveld et al., 2005) and Prunus domestica (Arumuganathan and Earle, 1991b), the published reports do not include DNA content histograms and data on CV, making any comparison of buffer performance impossible. For the remaining species only indirect comparisons can be made as the experimental conditions in each work are unlike the ones followed here. However, judging from published CVs and DNA content histograms, with the exception of Pinus pinea, the buffers described in the present work provided better (e.g. Quercus robur, Malus × domestica, Diospyros kaki) or similar (e.g. Olea europaea, Vitis vinifera) results. Particularly interesting are the high-resolution histograms obtained in Quercus robur using WPB. Leaves of this and other species from this genus contain phenolic compounds that interfere with fluorescent staining of nuclear DNA (Zoldoš et al., 1998; Loureiro et al., 2005). In order to estimate genome size in seven Quercus species, including Quercus robur, Zoldoš et al. (1998) modified Galbraith's buffer by adding metabisulfite. In their study, CVs ranged from 4·2 % to 6·9 % for Quercus robur, while in our work mean CVs below 3 % and low DF values (<20 %) were achieved. In Pinus pinea, GPB and WPB resulted in CVs around 3 %, i.e. higher than those obtained by Grotkopp et al. (2004) who used a modified Galbraith buffer to obtain CVs typically below 2 %. It should be noted, however, that we used fine needles to prepare nuclear suspensions, while Grotkopp et al. (2004) used a megagametophyte, from which it is easier to prepare nuclear suspensions.
In addition to the comparison of two new nuclear isolation buffers, this work provides data on nuclear DNA content in 30 plant species. It was noted that samples prepared from species with small genome sizes (<1·0 pg/2C DNA) exhibited higher CVs. Even in unproblematic species, a negative relationship between genome size and DF was observed (e.g. Sedum burrito and Euphorbia peplus). This was clearly due to the presence of particles other than intact nuclei in the samples (Galbraith et al., 2002). These include autofluorescent chlorophyll, nuclei fragments and non-specifically stained cellular debris, which contribute to the background distribution over which nuclear DNA content distribution is superimposed. Debris attached to isolated nuclei then increases the variation in nuclei fluorescence intensity (Loureiro et al., 2006b).
For the 20 species whose genome size had been estimated before, better agreement was observed for previous results that were obtained by flow cytometry as compared with those obtained by Feulgen microdensitometry. This was the case of Coriandum sativum, where our estimate of 5·08 pg DNA (2C) differs from earlier estimates using the Feulgen technique that ranged from 7·65 pg to 9·55 pg (Das and Mallick, 1989; Chattopadhyay and Sharma, 1990). Our estimates of C-values are also lower than Feulgen-based estimates for Magnolia × soulangeana and Chamaecyparis lawsoniana (Nagl et al., 1977; Olszewska and Osiecka 1983; Ohri and Khoshoo 1986). However, our estimate for the latter species is similar to that of Hizume et al. (2001) who used flow cytometry. Another noteworthy difference concerns Ficus carica (Moraceae), in which our estimate of 2C value is only half of that determined by Feulgen microspectrophotometry (Ohri and Khoshoo, 1987). On the other hand, we determined 2C = 11·00 pg DNA for Papaver rhoeas (Papaveraceae), which is double that obtained by Nagl et al. (1983), Bennett and Smith (1976) and Srivastava and Lavania (1991) using the Feulgen procedure. In this species the differences in genome size may be explained by the occurrence of minority cytotypes (Albers and Pröbsting, 1998), with our individuals being probably tetraploid.
The differences between flow cytometry and Feulgen densitometry are rather unexpected as Doležel et al. (1998) showed a close agreement between both methods. However, as noted by these authors, there are many critical points of the Feulgen procedure (e.g. fixation, slide preparation and storage, acid hydrolysis) which determine its precision. Moreover, stoichiometry of the Feulgen procedure can be negatively affected by various components of cytosol (Greilhuber, 1988). Some differences between flow cytometry estimates of genome sizes in different laboratories may be explained by the use of different reference standards, sample preparation and staining protocols, and flow cytometers (Doležel et al., 1998; Doležel and Bartoš, 2005).
This work reports the first estimates of genome size in ten plant species. Most of the families to which these species belong are poorly represented at the genus or species level in the plant DNA C-values database (Bennett and Leitch, 2005). The estimates for Acer negundo (Aceraceae, 0·75–4·05 pg/2C), Aloysia triphylla (Verbenaceae, 0·95–5·51 pg/2C), Forsythia × intermedia (Oleaceae, 1·95–4·66 pg/2C), Pterospartum tridentatum (Fabaceae, 1·03–26·50 pg/2C) and Saintpaulia ionantha (Gesneriaceae, 1·35–2·80 pg/2C) are at the lower limit of the known range of genome size for each family. Contrarily, our 2C-value for Salix babylonica is near the upper limit of the known range of 2C-values in Salix sp. (0·70–0·96 pg/2C for diploids and 1·62–1·72 pg/2C for tetraploids). Our estimates for Ilex aquifolium and Euphorbia peplus are the lowest so far in Aquifoliaceae (2·25–4·25 pg/2C) and in the Euphorbia genus (1·30–28·70 pg/2C), respectively. By contrast, our genome size estimation for Diospyros kaki is the highest among the three species of Diospyros already analysed (2·40–3·30 pg/2C). Finally, our 2C-value for Tamarix africana is close to that of Zonneveld et al. (2005) for Tamarix tetrandra (3·10 pg/2C), which was until now the only species analysed in Tamaricaceae.
In conclusion, the present results show that in species relatively free of cytosolic compounds, GPB provides similar and, in some cases, better results than WPB, and may be preferred. With problematic tissues, GPB usually performs less well than WPB, which is more suitable for the recalcitrant samples characterized, among other, by the presence of phenolics and mucilaginous compounds. When compared with other nuclear isolation buffers, the use of WPB results in improved histogram quality. Therefore it is recommended as the first choice when problematic tissues/species are to be analysed for DNA content using flow cytometry.
ACKNOWLEDGEMENTS
Thanks are due to Prof. Paulo Silveira, Dr Sílvia Castro and Eng. Armando Costa for providing some of the plant material used in this study and to three anonymous reviewers for their useful comments and suggestions. This work was supported by FCT project ref. POCTI/AGR/60672/2004. J.L. was supported by Fellowship FCT/BD/9003/2002 and E.R. by Fellowship FCT/BD/27467/2006.
LITERATURE CITED
- Albers F, Pröbsting W. Chromosomenatlas der Farn- und Blütenpflanzen Deutschlands. In: Wisskirchen R, Haeupler H, editors. Standardliste der Farn- und Blütenpflanzen Deutschlands. Stuttgart: Bundesamt für Naturschutz & Verlag; 1998. pp. 562–616. [Google Scholar]
- Arumuganathan K, Earle E. Estimation of nuclear DNA content of plants by flow cytometry. Plant Molecular Biology Reporter. (a) 1991;9:229–233. [Google Scholar]
- Arumuganathan K, Earle E. Nuclear DNA content of some important plant species. Plant Molecular Biology Reporter. (b) 1991;9:208–218. [Google Scholar]
- Baird WV, Estager AS, Wells JK. Estimating nuclear DNA content in peach and related diploid species using laser flow cytometry and DNA hybridization. Journal of the American Society for Horticultural Science. 1994;119:1312–1316. [Google Scholar]
- Barow M, Meister A. Lack of correlation between AT frequency and genome size in higher plants and the effect of nonrandomness of base sequences on dye binding. Cytometry. 2002;47:1–7. doi: 10.1002/cyto.10030. [DOI] [PubMed] [Google Scholar]
- Bennett MD, Leitch IJ. Angiosperm DNA C-values database (release 6·0, October 2005) 2005.
- Bennett MD, Smith JB. Nuclear DNA amounts in Angiosperms. Philosophical Transactions of the Royal Society of London Series B – Biological Sciences. 1976;274:227–274. doi: 10.1098/rstb.1976.0044. [DOI] [PubMed] [Google Scholar]
- Bitonti MB, Cozza R, Chiappetta A, Contento A, Minelli S, Ceccarelli M, et al. Amount and organization of the heterochromatin in Olea europaea and related species. Heredity. 1999;83:188–195. doi: 10.1046/j.1365-2540.1999.00564.x. [DOI] [PubMed] [Google Scholar]
- Capparelli R, Viscardi M, Amoroso MG, Blaiotta G, Bianco M. Inter-simple sequence repeat markers and flow cytometry for the characterization of closely related Citrus limon germplasms. Biotechnology Letters. 2004;26:1295–1299. doi: 10.1023/B:BILE.0000044920.36497.fc. [DOI] [PubMed] [Google Scholar]
- Castro S, Loureiro J, Santos C, Ater M, Ayensa G, Navarro L. Distribution of flower morphs, ploidy level and sexual reproduction of the invasive weed Oxalis pes-caprae in the western area of the Mediterranean region. Annals of Botany. 2007;99:507–517. doi: 10.1093/aob/mcl273. [DOI] [PMC free article] [PubMed] [Google Scholar]
- Chattopadhyay D, Sharma AK. Chromosome studies and microspectrophotometric estimation of nuclear DNA in different strains of Coriandrum sativum L. Cytobios. 1990;64:43–51. [Google Scholar]
- Das A, Mallick R. Variation in 4C DNA content and chromosome characteristics in different varieties of Coriandrum sativum L. Cytologia. 1989;54:609–616. [Google Scholar]
- Dickson E, Arumuganathan K, Kresovich S, Doyle J. Nuclear DNA content variation within the Rosaceae. American Journal of Botany. 1992;79:1081–1086. [Google Scholar]
- Doležel J, Bartoš J. Plant DNA flow cytometry and estimation of nuclear genome size. Annals of Botany. 2005;95:99–110. doi: 10.1093/aob/mci005. [DOI] [PMC free article] [PubMed] [Google Scholar]
- Doležel J, Göhde W. Sex determination in dioecious plants Melandrium album and M. rubrum using high resolution flow cytometry. Cytometry. 1995;19:103–106. doi: 10.1002/cyto.990190203. [DOI] [PubMed] [Google Scholar]
- Doležel J, Binarová P, Lucretti S. Analysis of nuclear DNA content in plant cells by flow cytometry. Biologia Plantarum. 1989;31:113–120. [Google Scholar]
- Doležel J, Sgorbati S, Lucretti S. Comparison of three DNA fluorochromes for flow cytometric estimation of nuclear DNA content in plants. Physiologia Plantarum. 1992;85:625–631. [Google Scholar]
- Doležel J, Doleželová M, Novák F. Flow cytometric estimation of nuclear DNA amount in diploid bananas (Musa acuminata and M. balbisiana) Biologia Plantarum. 1994;36:351–357. [Google Scholar]
- Doležel J, Greilhuber J, Lucretti S, Meister A, Lysák M, Nardi L, et al. Plant genome size estimation by flow cytometry: inter-laboratory comparison. Annals of Botany. 1998;82:17–26. [Google Scholar]
- Doležel J, Bartoš J, Voglmayr H, Greilhuber J. Nuclear DNA content and genome size of trout and human. Cytometry Part A. 2003;51A:127–128. doi: 10.1002/cyto.a.10013. [DOI] [PubMed] [Google Scholar]
- Faure O, Nougarède A. Nuclear DNA content of somatic and zygotic embryos of Vitis vinifera cv. Grenache Noir at the torpedo stage: flow cytometry and in situ DNA microspectrophotometry. Protoplasma. 1993;176:145–150. [Google Scholar]
- Favre J, Brown S. A flow cytometric evaluation of the nuclear DNA content and GC percent in genomes of European oak species. Annales des Sciences Forestières. 1996;53:915–917. [Google Scholar]
- Galbraith DW, Harkins KR, Maddox JM, Ayres NM, Sharma DP, Firoozabady E. Rapid flow cytometric analysis of the cell cycle in intact plant tissues. Science. 1983;220:1049–1051. doi: 10.1126/science.220.4601.1049. [DOI] [PubMed] [Google Scholar]
- Galbraith DW, Lambert G, Macas J, Doležel J. Analysis of nuclear DNA content and ploidy in higher plants. In: Robinson J, Darzynkiewicz Z, Dean P, Dressler L, Rabinovitch P, Stewart C, et al., editors. Current protocols in cytometry. New York, NY: John Wiley & Sons; 2002. [DOI] [PubMed] [Google Scholar]
- Greilhuber J. Self tanning – a new and important source of stoichiometric error in cytophotometric determination of nuclear DNA content in plants. Plant Systematics and Evolution. 1988;158:87–96. [Google Scholar]
- Greilhuber J, Temsch E, Loureiro J. Nuclear DNA content measurement. In: Doležel J, Greilhuber J, Suda J, editors. Flow cytometry with plant cells. Weinheim: Wiley-VCH; 2007. pp. 67–101. [Google Scholar]
- Grotkopp E, Rejmanek M, Sanderson MJ, Rost TL. Evolution of genome size in pines (Pinus) and its life-history correlates: supertree analyses. Evolution. 2004;58:1705–1729. doi: 10.1111/j.0014-3820.2004.tb00456.x. [DOI] [PubMed] [Google Scholar]
- Guerra MD. Cytogenetics of Rutaceae. 2. Nuclear DNA content. Caryologia. 1984;37:219–226. [Google Scholar]
- Hizume M, Kondo T, Shibata F, Ishizuka R. Flow cytometric determination of genome size in the Taxodiaceae, Cupressaceae sensu stricto and Sciadopityaceae. Cytologia. 2001;66:307–311. [Google Scholar]
- Hopping ME. Flow cytometric analysis of Actinidia species. New Zealand Journal of Botany. 1994;32:85–93. [Google Scholar]
- Iannelli D, Cottone C, Viscardi M, D'Apice L, Capparelli R, Boselli M. Identification of genotypes of lemon by flow cytometry and RAPD markers. International Journal of Plant Sciences. 1998;159:864–869. [Google Scholar]
- Jones RN, Rees H. Nuclear DNA variation in Allium. Heredity. 1968;23:591–605. [Google Scholar]
- Kayim M, Koc NK, Rokka VM. Variation of the nuclear DNA content of species of subtribe Citrinae (Rutaceae) Hortscience. 1998;33:1247–1250. [Google Scholar]
- de Laat AAM, Göhde W, Vogelzang M. Determination of ploidy of single plants and plant population by flow cytometry. Plant Breeding. 1987;99:303–307. [Google Scholar]
- Labani RM, Elkington TT. Nuclear DNA variation in the genus Allium L. (Liliaceae) Heredity. 1987;59:119–128. [Google Scholar]
- Leal F, Loureiro J, Rodriguez E, Pais MS, Santos C, Pinto-Carnide O. Nuclear DNA content of Vitis vinifera cultivars and ploidy level analyses of somatic embryo-derived plants obtained from anther culture. Plant Cell Reports. 2006;25:978–985. doi: 10.1007/s00299-006-0162-1. [DOI] [PubMed] [Google Scholar]
- Lodhi M, Reisch B. Nuclear DNA content of Vitis species, cultivars, and other genera of the Vitaceae. Theoretical and Applied Genetics. 1995;90:11–16. doi: 10.1007/BF00220990. [DOI] [PubMed] [Google Scholar]
- Loureiro J, Pinto G, Lopes T, Doležel J, Santos C. Assessment of ploidy stability of the somatic embryogenesis process in Quercus suber L. using flow cytometry. Planta. 2005;221:815–822. doi: 10.1007/s00425-005-1492-x. [DOI] [PubMed] [Google Scholar]
- Loureiro J, Rodriguez E, Doležel J, Santos C. Comparison of four nuclear isolation buffers for plant DNA flow cytometry. Annals of Botany. (a) 2006;98 doi: 10.1093/aob/mcl141. [DOI] [PMC free article] [PubMed] [Google Scholar]
- Loureiro J, Rodriguez E, Doležel J, Santos C. Flow cytometric and microscopic analysis of the effect of tannic acid on plant nuclei and estimation of DNA content. Annals of Botany. (b) 2006;98:515–527. doi: 10.1093/aob/mcl140. [DOI] [PMC free article] [PubMed] [Google Scholar]
- Loureiro J, Suda J, Doležel J, Santos C. FLOWer: a plant DNA flow cytometry database. In: Doležel J, Greilhuber J, Suda J, editors. Flow cytometry with plant cells. a. Weinheim: Wiley-VCH; 2007. pp. 423–438. [Google Scholar]
- Loureiro J, Rodriguez E, Costa A, Santos C. Nuclear DNA content estimations in wild olive (Olea europaea L. ssp. europaea var. sylvestris) and Portuguese cultivars of O. europaea using flow cytometry. Genetic Resources and Crop Evolution. (b) 2007;54:21–25. [Google Scholar]
- Lysák M, Doležel J. Estimation of nuclear DNA content in Sesleria (Poaceae) Caryologia. 1998;52:123–132. [Google Scholar]
- Marie D, Brown SC. A cytometric exercise in plant DNA histograms, with 2C values for 70 species. Biology of the Cell. 1993;78:41–51. doi: 10.1016/0248-4900(93)90113-s. [DOI] [PubMed] [Google Scholar]
- Nagl W, Habermann T, Fusenig HP. Nuclear DNA contents in four primitive angiosperms. Plant Systematics and Evolution. 1977;127:103–105. [Google Scholar]
- Nagl W, Jeanjour M, Kling H, Kuhner S, Michels I, Muller T, Stein B. Genome and chromatin organization in higher plants. Biologisches Zentralblatt. 1983;102:129–148. [Google Scholar]
- Noirot M, Barre P, Louarn J, Duperray C, Hamon S. Nucleus-cytosol interactions: a source of stoichiometric error in flow cytometric estimation of nuclear DNA content in plants. Annals of Botany. 2000;86:309–316. [Google Scholar]
- Noirot M, Barre P, Duperray C, Hamon S, De Kochko A. Investigation on the causes of stoichiometric error in genome size estimation using heat experiments: consequences on data interpretation. Annals of Botany. 2005;95:111–118. doi: 10.1093/aob/mci006. [DOI] [PMC free article] [PubMed] [Google Scholar]
- Ohri D, Khoshoo TN. Genome size in gymnosperms. Plant Systematics and Evolution. 1986;153:119–132. [Google Scholar]
- Ohri D, Khoshoo TN. Nuclear DNA contents in the genus Ficus (Moraceae) Plant Systematics and Evolution. 1987;156:1–4. [Google Scholar]
- Ollitrault F, Dambier D, Luro F, Duperray C. Nuclear genome size variations in Citrus. Fruits. (a) 1994;49:390–393. [Google Scholar]
- Ollitrault F, Legave JM, Michaux-Ferrière N, Hirsch AM. Use of flow cytometry for rapid determination of ploidy level in the genus. Actinidia. Scientia Horticulturae. (b) 1994;57 [Google Scholar]
- Olszewska MJ, Osiecka R. The relationship between 2C DNA content, life cycle type, systematic position and the dynamics of DNA endoreplication in parenchyma nuclei during growth and differentiation of roots in some dicotyledonous herbaceous species. Biochemie Und Physiologie Der Pflanzen. 1983;178:581–599. [Google Scholar]
- Otto F. DAPI staining of fixed cells for high-resolution flow cytometry of nuclear DNA. In: Crissman H, Darzynkiewicz Z, editors. Methods in cell biology. New York, NY: Academic Press; 1990. pp. 105–110. [DOI] [PubMed] [Google Scholar]
- Pfosser M, Amon A, Lelley T, Heberle-Bors E. Evaluation of sensitivity of flow cytometry in detecting aneuploidy in wheat using disomic and ditelosomic wheat-rye addition lines. Cytometry. 1995;21:387–393. doi: 10.1002/cyto.990210412. [DOI] [PubMed] [Google Scholar]
- Rugini E, Pannelli G, Ceccarelli M, Muganu M. Isolation of triploid and tetraploid olive (Olea europaea L.) plants from mixoploid cv. ‘Frantoio’ and ‘Leccino’ mutants by in vivo and in vitro selection. Plant Breeding. 1996;115:23–27. [Google Scholar]
- Soltis DE, Soltis PS, Bennett MD, Leitch IJ. Evolution of genome size in the angiosperms. American Journal of Botany. 2003;90:1596–1603. doi: 10.3732/ajb.90.11.1596. [DOI] [PubMed] [Google Scholar]
- Srivastava S, Lavania UC. Evolutionary DNA variation in Papaver. Genome. 1991;34:763–768. [Google Scholar]
- Tatum TC, Stepanovic S, Biradar DP, Rayburn AL, Korban SS. Variation in nuclear DNA content in Malus species and cultivated apples. Genome. 2005;48:924–930. doi: 10.1139/g05-033. [DOI] [PubMed] [Google Scholar]
- Trotter J. 2000. WinMDI version 2·8.
- Ulrich I, Ulrich W. High resolution flow cytometry of nuclear DNA in higher plants. Protoplasma. 1991;165:212–215. [Google Scholar]
- Yokoya K, Roberts AV, Mottley J, Lewis R, Brandham PE. Nuclear DNA amounts in roses. Annals of Botany. 2000;85:557–561. [Google Scholar]
- Zoldoš V, Papeš D, Brown SC, Panaud O, Siljak-Yakovlev S. Genome size and base composition of seven Quercus species: inter- and intra-population variation. Genome. 1998;41:162–168. [Google Scholar]
- Zonneveld BJM, Leitch IJ, Bennett MD. First nuclear DNA amounts in more than 300 angiosperms. Annals of Botany. 2005;96:229–244. doi: 10.1093/aob/mci170. [DOI] [PMC free article] [PubMed] [Google Scholar]