

Abstract
Cancer is a complex disease exhibiting a host of phenotypic diversities. Noninvasive multinuclear magnetic resonance imaging (MRI) and spectroscopic imaging (MRSI) provide an array of capabilities to characterize and understand several of the vascular, metabolic, and physiological characteristics unique to cancer. The availability of targeted contrast agents has widened the scope of MR techniques to include the detection of receptor and gene expression. In this paper, we have highlighted the application of several MR techniques in imaging and understanding cancer.
Keywords: Cancer, metabolism, molecular imaging, magnetic resonance imaging (MRI), magnetic resonance spectroscopic imaging (MRSI), receptor expression, vascular imaging
I. Introduction
Cancer is a complex disease and the apparent impenetrability of the disease is largely due to multiple, often redundant, pathways that appear to evolve through the genetic instability of cancer cells. Molecular imaging is a term broadly used to describe imaging applications that detect molecules or molecular signals. It encompasses gene expression imaging as well as vascular and metabolic imaging. In recent years, there has been a tremendous surge of interest in the application of magnetic resonance (MR) molecular imaging techniques in cancer research as well as in the clinical management of the disease. The ability to identify and image common key pathways specific to cancer cells and the ability to image the effectiveness and outcome of strategies designed against these targets is critically important for the treatment of this disease. MR methods are particularly applicable for metabolic and vascular imaging of cancer, and they have recently been applied to detect receptor and gene expression. Some of these applications are reviewed in this paper.
II. MR Imaging of Receptor and Gene Expression
Recent advances in developing targeted or so-called “smart” contrast agents (CAs) have significantly extended the versatility of MR applications to include detection of receptor expression and specific molecular targets. The low concentration of receptors and molecular targets and the inherent insensitivity of MR detection have also led to the development of amplification strategies to improve detection limits. The design and application of “smart” CAs is reviewed in this section together with some of the amplification strategies used to improve the sensitivity of MR detection. Strategies for generating targeted contrast can be broadly categorized as to where the CA is directed to a specific receptor using a high-affinity ligand such as a monoclonal antibody (mAb), where the number of MR reporter molecules increases with enzymatic activity, resulting in signal amplification, and where the presence of a targeted probe is detected through a decrease in the bulk water signal due to chemical exchange between protons of bulk water and those of the probe. The high sensitivity of detection of the latter is due to numerous water molecules interacting with a single molecule of the probe.
A. MR Contrast Agents
Most MR CAs are detected by changes induced in water proton T1, T2, or relaxation times. CAs are characterized by their T1 or T2 relaxivity, which is the reciprocal of the change in relaxation time of the CA per unit concentration and a measure of the efficacy of the CA. Most CAs will affect T1, T2, as well as relaxation times of tissues, but some agents are more potent in affecting a particular relaxation mechanism than others.
T1 agents are typically paramagnetic and effectively shorten the T1 (longitudinal) relaxation time to produce signal hyperintensity in T1 -weighted images. These agents are mostly chelates of the lanthanide gadolinium (Gd). T1 relaxivity values of Gd-based CAs are usually in the range of 5–20 (mM · s)−1 [1] and up to 80 (mM · s)−1 for the blood pool CA MS-325 bound to albumin [2]. These agents affect both T1 and T2 of tissues, but because the intrinsic T1 of tissues is much longer than the intrinsic T2, the relative change in T1 exceeds that of T2, for an equivalent percentage change. Imaging sequences sensitive to this change are called “T1-weighted” sequences. T2 contrast agents most effectively shorten the T2 (transverse) relaxation time and produce hypointensity in T2-weighted images. These agents are generally polymer-coated iron oxide nanoparticles that shorten T2 through the susceptibility-induced local magnetic field heterogeneity. Iron-oxide-based superparamagnetic CAs can have T2 relaxivities reaching 200 (mM·s)−1 [3]. Since the intrinsic tissue T2 is shorter than its intrinsic T1, the CA-induced percentage change in tissue T2 is greater than the percentage change in T1, for an equivalent change in absolute relaxation time. Imaging sequences that are sensitive to this change are called “T2-weighted” sequences. In addition to T2 relaxation, the transverse magnetization is also affected by inhomogeneity in the static magnetic field, which results in enhanced relaxation. The relaxation due to both the T2 mechanism as well as the magnetic field inhomogeneity is called relaxation.
T1 Contrast Agents
Gd3+ (III), Mn2+(II), or Fe3+(III) chelates are used as T1 CAs because their paramagnetic moieties shorten the T1 of the protons of bulk water, generating positive contrast enhancement in a T1 -weighted image. Gd diethylene triamine penta-acetate (GdDTPA) is the most commonly used CA in this category because of the high stability of the DTPA complex. Multiple chelates of Gd ions can be attached to a single polymer molecule to increase its relaxation efficiency. These multichelate Gd-polymer complexes include high molecular weight and longer half-life agents like albumin-GdDTPA [4], [5] and other conjugates of multichelate Gd ions with polymer carriers such as poly-L-lysine [6], [7], avidin [8], and polyamidoamine (PAMAM) dendrimers of different generations [9], [10]. The relaxivity of these larger complexes is generally a linear function of the number of Gd3+ ions per complex.
While protons provide the highest sensitivity of detection, their biological abundance often makes 1H MR lack molecular specificity. Targeted CAs have therefore been developed to probe specific molecules. For such CAs, the minimum detectable molecular concentration depends on the labeling efficiency of the CA or that of the molecular probe. For instance, cell surface receptors with high expression levels (≥ 106 per cell) have a concentration of ∼ 1015 binding sites per ml (∼ 1 μM). With current MRI detection capability, each receptor must be labeled with more than ten Gd.
In recent studies, large Gd complexes such as paramagnetic polymerized liposomes [11] and Gd-perfluorocarbon nanoparticles [12], [13] were targeted to αVβ3 integrin receptors using monoclonal antibodies or target peptides that were either attached via biotin–avidin linkers or covalently bound to the nanoparticle. These studies demonstrated the ability of magnetic resonance imaging (MRI) to detect αVβ3 integrin receptors expressed on the angiogenic endothelium. Human folate receptors in ovarian xenografts were imaged with the small folate-conjugated GdDTPA magnetic dendrimer CA [14]. In a study by Gohr-Rosenthal et al. [7], Poly-L-Lysine-GdDTPA was covalently bound to an anti-mucin mAb to image a mucin-like protein expressed in gastrointestinal carcinomas. More recently, a two-step labeling strategy was used to image the HER-2/neu receptor in vivo [8]. A biotinylated anti-HER-2/neu mAb was used to prelabel the HER-2/neu receptor. A GdDTPA-avidin conjugate was systemically delivered 12 h later. The GdDTPA-avidin conjugate bound to the biotinylated antibody, generating positive contrast in T1 -weighted images of HER-2/neu expressing tumor xenografts.
As mentioned earlier, a novel approach of using enzyme-specific relaxivity amplification has been developed to image molecular targets using MRI. In one such approach, β-galactosidase, was used to mediate the catalytic removal of the sugar cap of a Gd3+ caged CA, thereby exposing numerous water molecules to the inner-sphere relaxation effects of gadolinium and consequently shortening T1 [15]. In another approach, peroxidase enzymatic amplification was used to image the E-selectin expression on the surface of endothelial cells [16]. With this approach, the enzymatic polymerization of hydroxyphenol-modified Gadoterate meglumine (GdDOTA) monomers resulted in MR hyperintensity through a significant increase in T1 relaxivity.
T2 Contrast Agents
Since Gd-based CAs shorten T1 and T2, some Gd-based CAs are also used to generate T2 contrast. However, most T2 and CAs currently in use rely on an iron oxide core to generate contrast. Monocrystalline iron-oxide nanoparticles (MION) and polycrystalline superparamagnetic iron-oxide nanoparticles (SPIO) generate T2 contrast through the Curie spin effect [17]. These nanoparticles also generate contrast through the susceptibility-induced local magnetic field inhomogeneities. Iron-oxide nanoparticles not only produce contrast detectable at nanomolar concentrations but also have an increased probability of uptake in the tumor due to their long circulation time.
MION (∼5 nm) and SPIO (∼30 nm) cores are coated with biopolymers such as dextran or other polysaccharides, or unilamellar vesicles, to provide biocompatibility and chemical stability to the CA. Nonspecific cellular uptake of these nanoparticle CAs occurs through phagocytosis and pinocytosis. Nanoparticle-labeled cells with iron concentrations as low as 1.7 × 10⁻¹⁵ g/cell were successfully detected with MRI [18]; Dodd et al. [19] detected a single T cell labeled with SPIO while Bulte et al. [20] have tracked mangetoden-drimer-loaded stem cells both in vivo and in vitro.
The strategy of targeting iron-oxide nanoparticles to selected receptors using mAb has been used to image lymphocytes in culture; a biotinylated anti-lymphocyte-directed mAb was conjugated to a biotinylated dextran-coated SPIO with a streptavidin linker, generating selective negative contrast enhancement of lymphocyte suspensions [21]. Kang et al. [22] have imaged E-selectin expression in human endothelial cells by conjugating a F(ab′)2 fragment of the anti-human-E-selectin mAb to cross-linked iron oxide (CLIO) nanoparticles. Only cells incubated in the presence of the IL-1β cytokine demonstrated negative contrast on T2-weighted images. Similarly, HER-2/neu expression in malignant breast cancer cells was detected with a two-step labeling process where biotinylated Herceptin mAb was conjugated with streptavidin-SPIO nanoparticles [23]. Strong T2 contrast was detected in AU-565 cells with high levels of HER-2/neu receptor expression, as shown in Fig. 1.
Fig. 1.
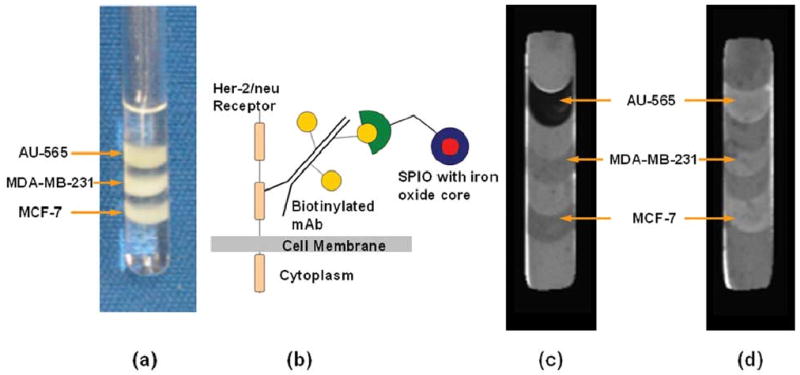
AU-565, MDA-MB-231, and MCF-7 breast cancer cells were layered in agarose gel and (a) photographed in a 5-mm NMR tube. Cells express different levels of the HER-2/neu receptor which is overexpressed in 25% of breast cancers. Receptor expression levels were 2.7 × 10⁶ for AU-565 cells, 8.9 × 10⁴ for MCF-7 cells, and 4 × 10⁴ for MDA-MB-231 cells. (b) Receptors were prelabeled with either the biotinylated immunotherapeutic agent Herceptin or a nonspecific biotinylated mAb as control. Cells were subsequently probed with streptavidin-SPIO microbeads. Eight T2-weighted MR images were used to obtain T2 maps of cell samples, with an 8-s relaxation delay and TE values of 20–250 ms. T2 maps show contrast in (c) Herceptin-labeled cancer cells, whereas no additional T2 contrast was observed in (d) controls.
Receptor targeting with iron-oxide nanoparticles has also been applied in vivo. Since the protein synaptotagmin binds to phosphatidylserine residues that relocate to the outer leaflet of the plasma membrane in apoptotic cells, SPIO particles conjugated to the C2 domain of synaptotagmin have been used to image apoptosis in solid tumors following chemotherapy [24]. Weissleder et al. [25] engineered 9L glioma cells to express a modified transferrin receptor, ETR, with a knocked-out negative feedback regulation domain. MION particles conjugated to human holo-transferrin (a substrate for an engineered human transferrin receptor, ETR) were internalized by these cells in situ and in vivo, generating detectable contrast in -weighted MR images.
B. MR Spectroscopic Imaging and Water Exchange
Although 1H MR spectroscopy (MRS) provides the highest sensitivity, suppression of the strong signal from water and mobile lipids is required for in vivo detection of metabolites. The 19F isotope exhibits approximately 80% of proton receptivity. The complete absence of background signal from natural fluorine makes it a useful reporter for in vivo MR. Stegman et al. [26] used the bacterial or yeast enzyme cytosine deaminase (CD) to convert 5-fluorocytosine (5-FC) to 5-fluorouracil (5-FU) and detected the conversion in vivo, with 19F MRS. Solid tumors derived from yeast CD transfected cells were easily detected in vivo since the CD enzyme is not mammalian. In a study by Aboagye et al. [27], CD was covalently conjugated to an mAb specific to the L6 antigen expressing tumors derived from human lung adenocarcinoma H2981 cells. Here too, the signal from 5-FU was detected in these tumors with 19F MR spectroscopic imaging (MRSI), following administration of 5-FC.
Chemical-exchange saturation transfer (CEST) is a spectroscopic technique that permits MR detection of exchangeable water protons by detecting changes in the bulk water signal. Changes in the bulk water signal intensity are measured with and without RF irradiation at the chemical shift of the exchangeable group [28]–[30]. Magnetization transfer from the exchangeable protons to numerous bulk water protons can provide a sensitivity enhancement factor of over 5000 for specially optimized probes such as polyuridilic acid (imino protons [31]). This proton transfer enhancement factor (PTE) is defined as
| (1) |
where Ssat and S0 are the water signal intensities with and without RF irradiation, respectively. CEST efficiency is determined by the exchange rate constant and the number of exchangeable protons. For meaningful MR detection, the proton exchange between bulk water and the exchangeable group of the CA should be fast enough to allow multiple water molecules to exchange with the exchangeable group in the CA but slow enough to allow sufficient spectral separation [30]. A large chemical shift between bulk water and the exchangeable group enables the use of higher exchange rates with a correspondingly higher PTE and can be attained with paramagnetic shift reagents [32], [33]. CEST agents provide sensitivity comparable to paramagnetic CAs (for an equivalent number of exchangeable groups and Gd-chelates), suggesting that dedicated CEST “contrast agents” may be used as probes for targeted MRI.
Although the MR imaging probes and methods discussed above can be successfully used to image molecular targets in isolated cells, their application in vivo is challenging. The translation of these techniques into the clinic will require a substantial improvement in both CA chemistry and MR imaging technology.
III. MR Imaging of Tumor Vasculature
Both the metabolism and the physiological microenvironment of solid tumors are dependent on the tumor vasculature. The vascular network provides cancer cells with nutrients to grow, avenues for dissemination, and a means through which anticancer agents may be delivered. Tumor growth, metastasis, and therapy are therefore strongly dependent on the vasculature. Numerous studies spanning more than a century (see [34] and [35] for review) have identified several characteristic features of tumor vasculature. These include spatial heterogeneity and tortuous architecture, arterio-venous shunts, acutely and transiently collapsing vessels, angiogenic sprouting with poorly differentiated fragile and leaky vessels lacking in smooth muscle cell lining, and vasculature that is frequently unable to match the rapid growth of cancer cells resulting in areas of hypoxia and necrosis [36].
Based on the type of CA and the imaging sequence, MR methods can be used to derive different parameters that characterize the tumor vasculature (see Table 1). These methods mostly rely on the use of exogenous CAs, although as discussed, endogenous contrast mechanisms can also be used to characterize tumor vasculature. The three parameters typically derived from these MR methods are relative blood flow, vascular volume, and vessel permeability. For vessel permeability, usually an effective “permeability-surface area” product (PS), also referred to as “capillary-diffusion capacity” in the case of microvessels, is obtained by determining the rate of extravasation of an intravascular probe from the vessel into the tumor interstitium. PS values obtained by this technique depend on factors such as the molecular weight, size, and charge of the probe.
Table 1.
Summary of Vascular Parameters Derived From MRI of Different CAs, the Assumptions Made in the Derivations, and the Accompanying Limitations. Symbols and the Corresponding Parameters Are Listed in Table 2
| T1 CONTRAST AGENTS | |||
|---|---|---|---|
| Contrast Agent | Size | Extractable Vascular Parameters | Modeling Assumptions/Caveats |
| GdDTPA | ≈550-600 Da | Ktrans, kep, ve [41, 131] | In general Ktrans=FE=F(1-e-PS/F) |
| If PS»F, extraction is complete i.e. E=1 ⇒ Ktrans≈ F |
|||
| If PS«F, E ≈ PS/F ⇒ Ktrans≈ PS | |||
| vb, F | If E and mean transit time (MTT) can be estimated. | ||
| λ | If tissue density (ρ) is known. | ||
| Gadomer-17 | ≈17kDa | vb, Ktrans [132] | PS-limited regime and the larger molecular weight of the CA must be taken into account, i.e. PS«F and Ktrans ≈ PS |
| Albumin-GdDTPA | ≈80 kDa | Same as above [56] | Primarily an intravascular tracer and Ktrans ≈ ps as above |
| Antibody-conjugated Gd Liposomes | ≈MDa | Receptor density on the luminal surface and turnover [11] | Requires high local concentration of the CA at target sites and high labeling efficiency of CA. Delivery to extravascular targets is challenging. |
| T2 CONTRAST AGENTS | |||
| Contrast Agent | Size | Extractable Vascular Parameters | Modeling Caveats/Remarks |
| Gd-DTPA | ≈500-600 Da | rCBV, rCBF, Time-to-peak, FWHM[133] | Using first-pass tracer kinetics and elimination of recirculation effects. |
| ≈MTT[134] | This is not the true first moment of the MRI concentration-time curve. | ||
| Permeability or leakage [50] | Requires leakage correction for T1 enhancement due to extravasated CA. | ||
| F[135] | Requires knowledge of the arterial input function to deconvolve the measured concentration-time curve. | ||
| Vessel size index [50] | Requires simultaneous gradient- and spin-echo MRI. | ||
| MION/SPIO | ≈0.775-1 MDa | rCBV, rCBF, time-to-peak, FWHM, F, Vessel size index [48] | Same as above. |
A. Extrinsic or Exogenous Contrast
As mentioned earlier, tissues that take up Gd-based CAs are brightened in T1 -weighted images. T2 and shortening from the susceptibility-induced effects of these Gd-based tracers can also be used to characterize tumor vasculature; tissues that take up the paramagnetic agent are darkened in T2- and -weighted images. Tissue vascular parameters are calculated from tracer kinetics based on the tissue concentration of the CA and the induced relaxivity changes.
Low Molecular Weight Contrast Agents
Low molecular Gd-based CA such as Gadoteridol, Gd-HP-DO3A (Prohance), Gadopentate dimeglumine, Gd-DTPA (Magnevist), Gadoversetamide (Optimark), and Gadodiamide, Gd-DTPA-BMA (Omniscan) are the only class of paramagnetic agents in routine clinical use [37]–[39]. T1 relaxivity changes induced by the CA are analyzed for influx and efflux transfer constants and for determining the extravascular, extracellular volume fraction [40]. These CAs are not freely diffusible and do not enter cells. The standard kinetic parameters that can be derived from dynamic contrast-enhanced T1 -weighted MRI are Ktrans (min−1), the volume transfer constant between the blood plasma and the extravascular extracellular space (EES), kep (min−1), the rate constant between the EES and blood plasma, and υe (%), the volume of the EES per unit volume of tissue, i.e., the volume fraction of the EES [41]. These three parameters are related by
| (2) |
where Ktrans is dependent upon the tissue blood flow and PS (Fig. 2). Tofts et al. [41] have summarized four special cases of the two-compartment model, wherein one can extract PS and flow information based on certain assumptions, as shown in Table 1. The utility of these parameters in detecting tumor angiogenesis as well as in evaluating the efficiency of anti-angiogenic therapy has also been studied [42]–[45].
Fig. 2.
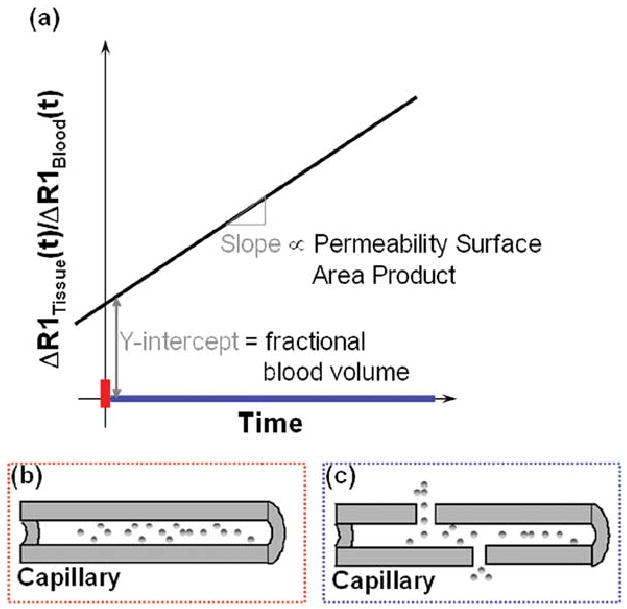
Schematic illustrating that (a) initially (red bar on time axis), the bulk of the T1 relaxation effect is proportional to the intravascular space since the CA is confined to this space. Ratio of the change in relaxation rate of the tissue Δ(l/T1tissue(t)) to that in the blood Δ(l/T1blood(t)), at t = 0, yields the fractional blood volume in that voxel (b) Blood vessel in which the macromolecular CA is initially (red bar on time axis) confined to the intravascular space. Over time (blue bar on time axis), as the CA extravasates into the adjoining tissue, the rate of change of the normalized relaxation rate Δ(l/T1tissue(t))/Δ(l/T1blood(t)) becomes proportional to the permeability–surface area product for that vessel (c) In the case of a leaky tumor vessel, for example, the CA extravasates into the adjoining interstitial space due to the elevated vessel permeability. Color of the rectangles in (b) and (c) correspond to the color of the appropriate time intervals (on the time axis) of the MR measurement.
At high enough doses of the CA, differences in the magnetic susceptibility of the intra- and extra-vascular space result in microscopic magnetic field inhomogeneities. Line-broadening effects dominate the MR contrast through diffusion and magnetic field inhomogeneity-induced signal dephasing, leading to contrast in - weighted images. Spin echo (SE) and gradient echo (GE) sequences have differential sensitivity to vessel caliber [46], [47]. For a given CA dose and echo time, the ratio of the change in the GE relaxation rate to the change in the SE relaxation rate Δ(1/T2) is directly proportional to the vessel radius [46], [47]. Dennie et al. [48] have demonstrated the application of this approach for assessing tumor angiogenesis in a brain tumor model.
Relative cerebral blood volume (rCBV) maps can be derived from first-pass dynamic susceptibility contrast (DSC) studies with good spatio-temporal resolution [42], [49]. Preliminary studies with this approach suggest that MRI-derived rCBV can differentiate histologic tumor grade [42]. A potential problem in obtaining rCBV with low molecular weight tracers is that the tracer can leak into the tumor when the blood brain barrier is disrupted, which is often the case in brain tumors, and MR data should be corrected for leakage effects [50]. For example, Donahue et al. [50] have observed a positive correlation between GE rCBV corrected for leakage effects and histologic tumor grade.
Most two-compartment models assume that water is in fast exchange between the vascular and EES compartments. This assumption may not apply in some tissues [51] and may lead to errors in the estimate of vascular volume [52]. Errors in the vascular volume estimates due to intermediate or slow exhange can be minimized by applying rapid imaging techniques and models of analyses such as BOLus Enhanced Relaxation Overview (BOLERO) [53].
High Molecular Weight Contrast Agents
Due to their rapid extravasation, low molecular weight CAs are not ideal for quantifying vessel permeability. High molecular weight CAs such as albumin-GdDTPA compounds [4] and polylysine-GdDTPA [6] can better quantify vascular volume and PS due to their long intravascular half-life. As shown in Figs. 2 and 3, vascular volume and PS can be spatially mapped from changes in tissue relaxation rates, which are proportional to the tracer concentration, assuming fast intercompartmental water exchange [54].
Fig. 3.
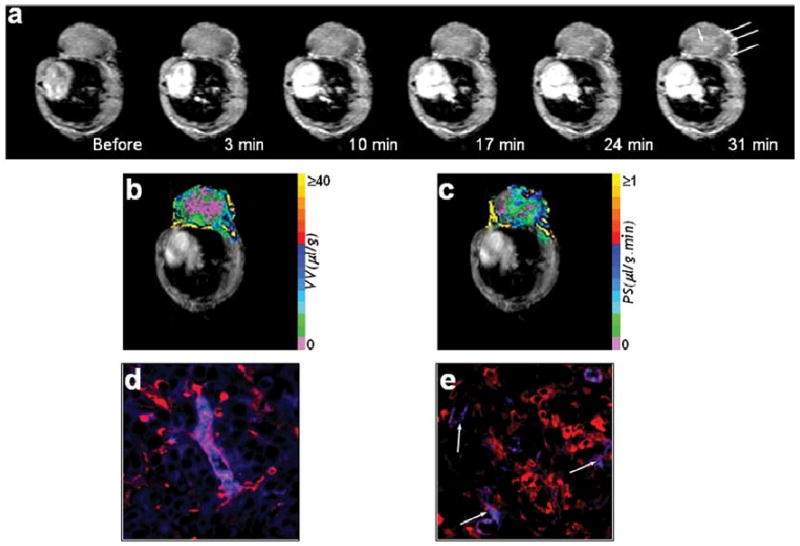
(a) Raw 1-s saturation recovery MR images obtained from a single slice of an MCF-7 tumor, at different experimental time points. Contrast uptake in the tumor is evident from the increased signal intensity (see regions marked by arrows). Maps of (b) vascular volume and (c) permeability–surface area product derived for this slice. High magnification (40×) fluorescent microscopy images demonstrating (d) a nonleaky tumor blood vessel (stained red) with the albumin-GdDTPA (stained blue) within its lumen and (e) highly permeable vessels (stained red) with the albumin GdDTPA (stained blue) extravasating from their incomplete or leaky lumens (indicated by arrows).
The blood concentration of albumin-GdDTPA equilibrates in 2–3 min and remains constant for at least 40 min after an intravenous bolus injection [5], [55]. A linear model can be employed [56] to derive maps of tumor vascular volume and permeability from quantitative T1 maps acquired before and at time points after intravenous administration of albumin-GdDTPA (Fig. 3). Bhujwalla et al. [5] have used this linear model approach to differentiate between the vasculature of metastatic versus nonmetastatic breast and prostate cancer xenografts. The study showed that regions of high vascular volume had low vessel permeability and vice versa. The data suggest that macromolecular therapeutic agents would have poor delivery in viable well-vascularized regions and would leak out in poorly vascularized already dying regions.
The study also demonstrated that both vascularization and invasion are required for metastasis to occur. Turetschek et al. [57] used albumin-GdDTPA to measure the transendothelial permeability KPS (i.e., Ktrans) and correlate it to histologic tumor grade in a breast tumor model. The study concluded that albumin-GdDTPA more accurately characterized tumor grade than a rapid clearance blood pool CA (P792). The accuracy of this approach depends on the validity of assuming fast water exchange between the intra- and extra-vascular compartments, and it may underestimate vascular volume in the presence of either slow and/or intermediate water exchange [58], [59].
B. Intrinsic or Endogenous Contrast
Intrinsic or endogenous contrast can also be exploited to characterize tumor vasculature. For instance, susceptibility-induced relaxation of oxygenated versus deoxygenated blood can be used to generate blood oxygen level-dependent (BOLD) contrast. The BOLD technique was originally proposed by Ogawa et al. [60] for brain imaging and subsequently adapted to image tumor microvasculature [61]. The functional dependence of on blood oxygenation and blood volume fraction is given by
| (3) |
where Y is the fraction of oxygenated blood and b is the blood volume fraction. In hypoxic tumors where 0 < Y < 0.2, the contrast produced by the BOLD effect depends primarily on b and permits the rapid in vivo determination of fractional blood volume. Such a susceptibility-based technique has also been used to detect changes in tumor vascularization following induction of angiogenesis by angiogenic cytokines [61] and to obtain “functional vasculature” maps of genetically modified HIF-1 (+/+ and −/−) animal tumor models, showing that the loss of HIF-1α impaired vascular function and prevented formation of large vessels in embryonic stem cell derived tumors [62]. BOLD contrast provides a fast and truly noninvasive measure of tumor vascularization, since it does not require the injection of a CA. However, one cannot measure vascular permeability or tumor blood flow quantitatively with this approach. Also, susceptibility-based contrast mechanisms such as BOLD are not solely related to the oxygenation status of blood but are also affected by factors such as oxygen saturation, hematocrit, blood flow, blood volume, vessel orientation, and geometry [63].
Another method to generate endogenous contrast is arterial spin labeling (ASL). With ASL, arterial blood is magnetically tagged proximal to the imaging slice using spatially selective pulses. The tagged blood is then used as a perfusion tracer to quantify blood flow in the downstream tissue. ASL requires high blood flow along with relatively long T1 relaxation times for the magnetization to be retained until the tagged blood reaches the tissue of interest. Silva et al. [64] used ASL to quantify blood flow in rodent brain tumors. Blood flow was 36.3 ± 18.9 ml/100 g/min in the tumor core and 85.3 ± 26.9 ml/100 g/min in the tumor periphery. These values were significantly lower than blood flow in normal contra-lateral white matter (147.7 ± 31.1 ml/100 g/min).
IV. Tumor Physiology and Metabolism
The poor vascularization of tumors frequently leads to areas of hypoxia, substrate deprivation, build-up of lactate, and extracellular acidosis, which are some of the typical physiological and metabolic characteristics of tumors [36]. Although the tumor vasculature plays a key role in controlling tumor metabolism, cancer cells also display aberrant metabolism such as increased glycolysis and altered choline phospholipid metabolism. MRS and MRSI of nuclei such as 1H, 13C, and 31P can be used to measure pH, energy status, and concentrations of certain metabolites within tumors. These parameters provide important information about tumor malignancy, invasiveness, and response to therapy.
A. 1H MRS
1H MRS provides the highest sensitivity of detection, permitting the acquisition of 1H MR spectra from localized regions within a tumor. Therefore, the spatial distribution of metabolites within a tumor can be readily obtained with 1H MRS as shown in Fig. 4(b). The heterogeneity of the tumor vasculature results in a nonuniform intratumoral distribution of oxygen, pH, and metabolites [36]. 1H MRSI can characterize the metabolite distribution within a tumor [see Fig. 4(d)], detect the heterogeneity of metabolic changes, and assess response following therapy [65], [66]. Unedited proton spectra are dominated by water and mobile lipid signals whose broad resonances can mask signals of other metabolites. Selective suppression techniques can be employed to suppress the water and lipid signals during MRS data acquisition. Water suppression can be achieved using the VAPOR [67], CHESS [68], or PRESS sequences [69]. Frequency-selective refocusing can also be utilized to reduce the water signal [70], [71].
Fig. 4.
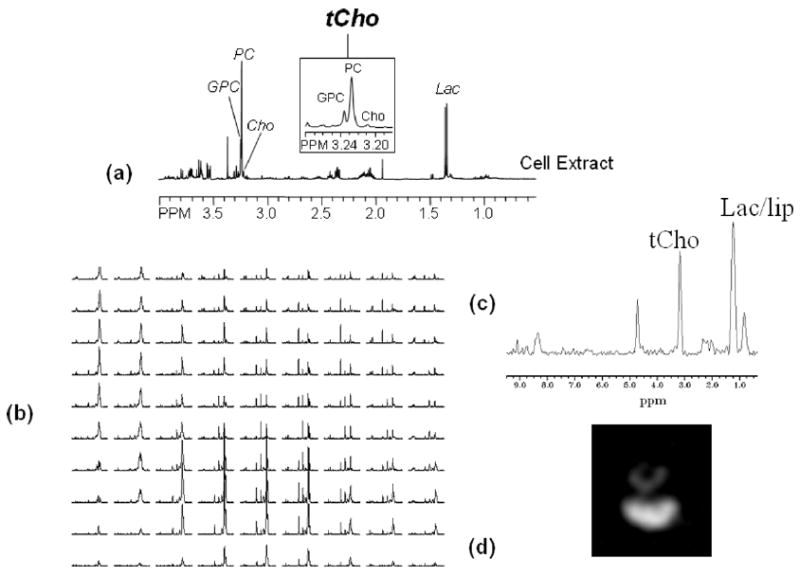
1H MR spectra showing (a) high resolution spectrum of a perchloric acid cell extract. Zoomed region around 3.2 ppm shows high levels of PC and total-choline containing metabolites and low levels of GPC in human breast cancer MDA-MB-231 cells (see inset). (b) Proton CSI spectra obtained from 1 × 1 × 4 mm voxels from an MDA-MB-231 tumor (vol. = 500 mm3) with TE = 272 ms, TR = 1 s, and the total acquisition time = 25 min. (c) Spectrum obtained from a representative 1 × 1 × 4 mm single voxel showing total choline and lactate/lipid. (d) Total choline map derived from the total choline signal in the CSI data set demonstrating the heterogeneity of metabolite distribution within the tumor. Following peaks are assigned in the 1H MR spectra: Cho, free choline; GPC, glycerophosphocholine; Lac, lactate; Lac/lip, lactate+lipids; PC, phosphocholine; tCho, total choline-containing metabolites (Cho + GPC + PC).
Although signals from the methyl and methylene protons of mobile lipids can provide useful information [72]–[74], they obscure signals from resonances such as lactate and alanine. To detect lactate without overlapping lipid signals, coherence-selection through gradient filtering can be used [75], [76] with spectral editing using adiabatic pulses [77] and additional phase cycling when necessary. Localized presaturation can also be used when the lipid signal is localized to the tumor periphery [70], [78]. It is possible to suppress both the water and the lipid signals in a single acquisition using homonuclear gradient-coherence transfer in conjunction with a frequency selective pulse [79], [80].
Proton spectra of tumors typically exhibit elevated levels of lactate and total choline [81], [82]. Elevated lactate concentrations are most likely due to a combination of increased glycolytic activity, poor blood flow, and hypoxia. As demonstrated in Fig. 4(a)–(d), tumor 1H MR spectra exhibited elevated levels of total choline primarily due to increased cellular phosphocholine (PC) concentrations. Immortalized oncogene-transformed or tumor-derived human mammary epithelial cells, representing different stages of breast carcinogenesis, exhibited a step-wise increase of PC and total choline (tCho: GPC + PC + Free choline) levels [83]. The PC to GPC ratio increased during malignant transformation in human mammary epithelial cells [83]. An increase in choline transport rate [84], increased choline kinase expression, and activity [85], [86] and increased phospholipase A2 [87], [88] and phospholipase D [89], [90] activities are some of the mechanisms which contribute to the elevated total choline and PC levels in tumors (reviewed in [91]). In the clinic, the utility of MRSI of total choline is currently being evaluated for detecting cancer and following its response to therapy in breast [92], prostate [93], and brain [94] cancer patients.
B. 13C MRS
Carbon-13 MRS is useful for studying metabolic fluxes and intermediary metabolism. As shown in Fig. 5, 13C-labeled glucose can be used to determine the glycolytic rate of a tumor [95], [96] and 13C-labeled choline can be used to follow choline membrane metabolism [97]. 13C-labeled precursors have been used in high resolution 13C MR studies of cells or tissue extracts, in noninvasive cell perfusion studies of isolated cells, and in infusion studies of animal tumor models. [1,2 −13 C]-choline has been used to study choline phospholipid metabolism in breast cancer cells to delineate enzymatic and molecular causes underlying the increased total choline and PC levels [84], [98]. Katz-Brull et al. [84] observed enhanced choline transport and choline kinase activity in perfused cells using 13C-labeled choline. Their study also showed that choline phosphorylation rates were higher than choline transport rates, indicating that the increase in PC was not attributable entirely to choline transport.
Fig. 5.
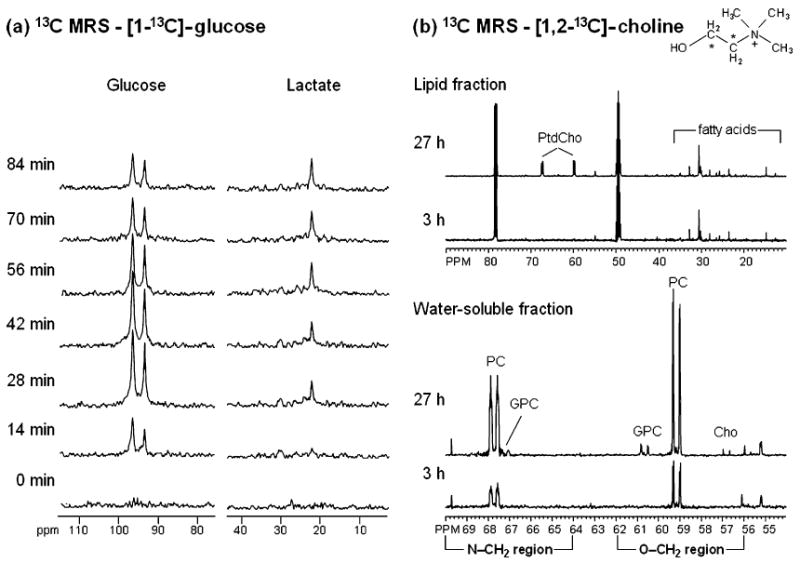
(a) In vivo13C MR spectra of a RIF-1 tumor obtained at 400 MHz using heteronuclear cross polarization following intravenous administration of 900 mg/kg [1 – 13 C]-glucose. Glycolytic rate of the tumor can be determined from the kinetic analysis of 13C-lactate build-up. (b) Representative 13C MR spectra from MDA-MB-231 cells labeled with 100 μM [1, 2 – 13 C]-choline (13C labels are indicated by asterisks in the choline structure schematic) for 3 or 27 h. Cells were extracted using a dual-phase extraction method and 13C MR spectra were obtained from the water-soluble fractions and the lipid fractions at both time points. The 27-h time point shows metabolites derived from a combination of biosynthetic and breakdown pathways. At this time point, the 13C label was detected in glycerophosphocholine (GPC), phosphocholine (PC), and free choline (Cho) in the water-soluble fraction and in membrane phosphatidylcholine (PtdCho) in the lipid fraction. At the 3-h time point 13C labeling was incorporated only through the biosynthetic pathways of choline membrane metabolism. Labeling of PtdCho did not occur at this time point; therefore, the contribution of the 13C label from PtdCho breakdown pathways was not detectable.
In poorly differentiated transplanted tumors, [1 −13 C]-labeled glucose is metabolized to lactate [95], [99]–[101], whereas well-differentiated tumors such as rat hepatoma demonstrated metabolic behavior close to the tissue of origin [102]. Lactate levels in tumors are related to several parameters such as glycolytic rates, blood flow, glucose supply, hypoxia, venous clearance, extent of necrosis, and degree of inflammatory cell infiltration [103]. Terpstra et al. [103] showed that for viable neoplastic cells elevated lactate in tumors correlated well with high glycolytic cell activity. They also observed a putative threshold above which glucose availability and blood flow did not significantly influence lactate levels. Areas of necrosis did not exhibit a strong correlation with levels of intratumoral lactate. In a study by Nielsen et al. [96] using volume localized 13C MRS with 1H -13 C cross polarization, a strong correlation was observed between decreasing tumor oxygenation and increasing glycolytic rate in a murine mammary carcinoma model.
Since the 13C nucleus has a low MR sensitivity, several approaches have been developed to increase the sensitivity of 13C MRS, and some of these approaches have been applied in humans [104]. The detection sensitivity of 13C-labeled compounds can be significantly improved up to levels approaching that of the 1H nucleus by the indirect detection of protons coupled to the nucleus of interest [105], [106]. Heteronuclear cross-polarization transfer can also be used to increase the sensitivity of direct 13C MRS [107].
C. 31P MRS
Phosphorus-31 MRS can detect metabolites such as nucleoside triphosphates (NTP), phosphocreatine (PCr), inorganic phosphate (Pi), phosphodiesters (PDE), and phosphomonoesters (PME). Although less sensitive than 1H MRS, 31P MRS can resolve signals from PME and PDE in vivo. PME concentrations in human breast tumors are significantly increased compared to normal breast tissue [108]. A decrease of the PME signal was detected in breast tumors that responded to the standard course of chemotherapy [108]. Representative 31P MR spectra from intact perfused MCF-12A human mammary epithelial cells and MDA-MB-231 human breast cancer cells are shown in Fig. 6. Higher PC concentrations were detected in the malignant MDA-MB-231 cells compared to immortalized, nonmalignant MCF-12A cells.
Fig. 6.
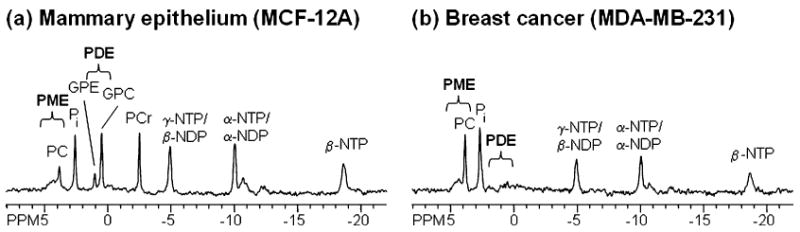
31P MR spectra of intact perfused cells, acquired in our MR-compatible perfusion system, showing spectra from (a) MCF-12A human mammary epithelial cells and (b) MDA-MB-231 human breast cancer cells. Breast cancer cells exhibit high PC levels, whereas mammary epithelial cells exhibit low PC and high GPC levels. Following peaks are assigned in the 31P MR spectra: GPC, glycerophosphocholine; GPE, glycerophosphoethanolamine; NDP, nucleoside diphosphate; NTP, nucleoside triphosphate; PC, phosphocholine; PCr, phosphocreatine; Pi, inorganic phosphate; PME, phosphomonoesters; PDE, phosphodiesters.
Energy metabolites such as NTP and PCr detected in tumor 31P MR spectra depend on parameters such as glucose and oxygen delivery, oxygen consumption rates, cell density, and nutritive blood flow. With tumor progression and the accompanying reduction of blood flow, high-energy metabolite levels such as NTP and PCr decreased, and Pi levels increased [109], [110]. 31P MRS studies have also demonstrated that ratios of PCr/Pi and NTP/Pi were significantly correlated with tumor oxygenation [111]. In a study using four cell lines, Rofstad et al. [112] found that within a cell line, the (NTP + PCr)/Pi ratio decreased with increasing tumor volume and radiobiological hypoxic fraction, which is an important parameter for radiation therapy. There was no correlation between the (NTP + PCr)/Pi ratio and radiobiological hypoxic fraction across cell lines; dissociation between energy metabolism and the radiobiological hypoxic fraction can occur if cells are highly glycolytic and require only small amounts of oxygen. 31P MRS can also be employed to detect metabolic responses of tumors to changes in blood flow and oxygenation during therapy [113].
In vivo and in vitro investigations using 31P MRS have complemented the 1H MRS studies of choline phospholipid metabolism (reviewed by [81], [91], [114], and [115]). Ronen et al. [116] detected higher PC levels in mutant ras transfected NIH 3T3 cells compared to their nontransfected counterparts; increased PC in the ras transfected NIH 3T3 cells was associated with Ras activation. Glunde et al. [117] observed an increase of the GPC/PC ratio following treatment of malignant human mammary epithelial cells (HMECs) with the nonsteroidal anti-inflammatory agent indomethacin. The increased GPC/PC ratio suggested that with indomethacin treatment, the choline metabolite profile of malignant HMECs was altered toward a profile typical of nonmalignant HMECs. Sterin et al. [118] observed increased intracellular GPC in breast cancer cells following treatment with antimicrotubule drugs (paclitaxel, vincristine, colchicine, nocodazole). These data suggest that different molecular interventions can lead to similar end points in choline metabolism.
V. Tumor pH
The microenvironment of tumors is frequently characterized by an acidic extracellular pH (pHe) and a neutral to alkaline intracellular pH (pHi). Tumor hypoxia and increased glycolysis causes elevated cellular acid production which, when combined with poor tumor perfusion and efficient mechanisms of proton extrusion, leads to acidic pHe in tumors and a neutral to alkaline pHi. MRS and MRSI provide a means of detecting both intracellular and extracellular pH.
A. 31P MRS
31P MRS can be employed to measure tumor pH using the pH-dependent chemical shift between Pi and an endogenous reference such as PCr or α-NTP [119]. The tumor interstitium and blood plasma have similar Pi concentrations of ∼1–2 mM. Therefore, for tumors with an extracellular volume less than 50%, pH as measured by 31P MRS is weighted toward intracellular pH by at least 70% [120]. This explains why tumor pH measured with 31P MRS is higher than tumor pH measured with microelectrodes, since the latter method primarily measures extracellular pH [36]. An exogenous compound, 3-aminopropyl phosphonate (3-APP), was employed to determine extracellular tumor pH in vivo using 31P MRS [121]. Studies in transplanted tumor models demonstrated an acidic extracellular tumor environment and a neutral to alkaline intracellular pH, confirming microelectrode measurements. Gillies et al. [122] demonstrated that below an external pH threshold, Ehrlich ascite cells maintain an intracellular pH value of ∼7.1 for pHe ∼ 6.8, thereby building up a transmembrane pH gradient. This gradient is energy driven and has been shown to depend on H+-ATPases (V-ATPases) that normally reside in acidic organelles but are also located at the cell surface in cancer cells [123], [124]. In vivo MRS studies revealed that intracellular pH of tumors depended on blood flow and substrate supply [121], [125]. An acute reduction of blood flow usually resulted in a significant decrease in intracellular pH [125], [126].
B. 1H MRS
While 1H sensitivity permits pH measurements with a short acquisition time and at higher spatial resolution than 31P, there are no endogenous markers for measuring pH with 1H MRS. Therefore, tumor pH measurements using 1H MRS rely on exogenous extracellular compounds whose spectral resonances are sufficiently separated from those of endogenous metabolites. One such compound is (+/−) 2-imidazole-1-yl-3-ethoxycarbonylpropionic acid (IEPA), which reported a pHe range of 6.4–6.8 in breast cancer xenografts [127]. This range is in agreement with analogous measurements using 3-APP. The advantage of using 1H MRS is that it provides the ability to obtain colocalized maps of pHe with 1H MRSI of IEPA and of vascular volume and permeability with MRI of albumin-GdDTPA [128]. In addition, these pHe maps can be related to metabolite maps of tCho, lactate, N-acetylasparate (NAA), and total creatine (tCr) [129] to understand the relationship between these parameters.
C. CEST
Chemical-exchange dependent saturation transfer (CEST), i.e., the exchange of water protons with those from mobile proteins and peptides, has also been used to measure relative pH in vivo [130]. The pH-dependent amide proton transfer (APT) technique cannot provide absolute pH values since parameters such as the concentration of amide and water protons can affect the measurement. Currently, using this technique, one cannot differentiate between intra- and extra-cellular pH.
VI. Conclusion
Noninvasive MRI and MRSI provide a wealth of spatial and temporal information on tumor vasculature, metabolism, physiology, receptor and gene expression, and pH. Advances in the development of targeted contrast agents have significantly increased the versatility of MR for molecular imaging and make it an invaluable technique for understanding a complex disease such as cancer. Several of these MR imaging techniques are translatable into the clinic and have the potential to be eventually realized as “bench to bedside” applications.
Table 2.
List of Parameters Used in Table 1 and Corresponding Symbols
| Symbol | Parameter |
|---|---|
| Ktrans | volume transfer constant between the blood plasma and the extravascular extracellular space (min−1) |
| kep | rate constant between the extravascular extracellular space and blood plasma (min−1) |
| ve | volume of the extravascular extracellular space per unit volume of tissue i.e. the volume fraction of |
| the extravascular extracellular space (%) | |
| F | flow of whole blood per unit mass of tissue (ml g−1 min−1) |
| E | initial extraction ratio |
| P | permeability of the vessel wall (cm min−1) |
| S | surface area per unit mass of tissue (cm2 g−1) |
| P | tissue density (g ml−1) |
| n | whole blood volume per unit volume of tissue |
| MTT | mean transit time |
| λ | tissue blood partition coefficient (ml/g) |
| rCBV | relative cerebral blood volume |
| rCBF | relative cerebral blood flow |
| FWHM | full-width half-maximum |
Acknowledgments
This work was supported by the National Institute of Health under Grants 2R01 CA73850, 1R01 CA90471, 1R01 CA82337, and P50 CA 103175.
Biographies

Barjor Gimi received the B.A. degree in physics from Lawrence University and a B.S. degree in mechanical engineering from Washington University, St. Louis, in 1995. He received the M.S. and Ph.D. degrees in bioengineering from the University of Illinois, Chicago, in 2000 and 2002, respectively.
From 1996 to 1999, he worked in the medical device industry, designing and developing devices for cryosurgery and cytology applications. In 2003, he joined the Radiology Department, The Johns Hopkins University School of Medicine, Baltimore, MD, as a Postdoctoral Research Fellow, where he currently conducts research on the functional and molecular imaging of cancer, and magnetic resonance microimaging. His research interests include developing detection devices for MR microimaging, dynamic MR microimaging of angiogenesis, monitoring the effect of anticancer drugs through vascular and diffusion imaging, and MR imaging of the function of pancreatic islet cells postimplantation and transplantation.
Dr. Gimi is a member of the International Society for Magnetic Resonance in Medicine, the Society for Molecular Imaging, and the American Association for Cancer Research.

Arvind P. Pathak received the B.E. degree in industrial electronics from B. V. College of Engineering, University of Poona, Pune, India, in 1993, where he specialized in the design of microprocessor-based systems. He received the Ph.D. degree from the joint doctoral program in functional imaging between the National Biophysics Research Institute, Medical College of Wisconsin, and the Department of Biomedical Engineering, Marquette University, Milwaukee, WI, in 2001.
His research centered on the biophysics of susceptibility-based MR contrast mechanisms and its efficacy in assessing tumor angiogenesis. He continued his research into the relationship between MR contrast mechanisms and tumor physiology at the Johns Hopkins University School of Medicine, Baltimore, MD, as a Postdoctoral Fellow in the Oncology/Molecular Imaging Section, MR Research Division, Department of Radiology, Johns Hopkins. In 2003, he joined the faculty of the Department of Radiology, Johns Hopkins, where his research is focused on the functional and molecular imaging of cancer.
Dr. Pathak is a full member of the International Society for Magnetic Resonance in Medicine, the American Association for Cancer Research, and the Society for Molecular Imaging.

Ellen Ackerstaff received the Diplom-Physikerin (Masters equivalent) degree in physics from the Westfälische Wilhems Universität Münster, Germany, in 1994. In her Diploma thesis, she studied the detection process of high molecular mass ions in MALDI mass spectrometry under the supervision of Dr. F. Hillenkamp. She received the Ph.D. degree in experimental physics at the Institute for Experimental Physics and Electrical Engineering, University of Bremen, Germany, in 1998, under the supervision of Dr. A. Mayer-Heinricy. Her doctoral research focused on the metabolism and water diffusion in algae using in vivo and in vitro multinuclear magnetic resonance spectroscopy.
She joined the laboratory of Dr. Z. M. Bhujwalla, Johns Hopkins University School of Medicine, Baltimore, MD, as a Postdoctoral Research Fellow in September 1998, followed by a promotion to the rank of faculty in March 2001. She currently investigates the effects of hypoxia, pH, VEGF overexpression, and endothelial-cancer cell interaction on breast and prostate cancer cell invasion and metabolism. Her research interests also include characterizing changes in phospholipid metabolism as a result of malignant transformation or due to the unique physiological environments found in solid tumors.

Kristine Glunde received the Diploma, in chemistry, in 1997, and the Ph.D. degree, in 2000, both from the University of Bremen, Bremen, Germany. In her Ph.D. thesis, she studied the role of Na+/H+ exchange in stroke-related conditions in brain cells using fluorescence and magnetic resonance spectroscopy.
She joined the Oncology Program of Prof. Bhujwalla in the Radiology Department, Johns Hopkins University School of Medicine, Baltimore, MD, as a Postdoctoral Fellow, in 2000. Her postdoctoral work focused on studying choline metabolism in breast cancer cells. Since 2003, she has been a junior faculty member in the JHU ICMIC Program of Dr. Bhujwalla at the Johns Hopkins University School of Medicine. She is currently developing novel optical imaging techniques to study the role of lysosomal trafficking in breast cancer invasion. She also studies mechanisms underlying the aberrant choline phospholipid metabolism in breast cancer cells using molecular biology techniques combined with magnetic resonance spectroscopy.
Dr. Glunde has been awarded an Excellence Award by the Constancia 1823 Foundation and a Career Development Award.

Dmitri Artemov received the Ph.D. degree in physics and mathematics from the Russian Academy of Sciences, Moscow, and completed postdoctoral training at the University of Wuerzburg, Germany.
He is an Associate Professor in the Departments of Radiology and Oncology, Johns Hopkins University School of Medicine, Baltimore, MD. He joined the Department of Radiology, Johns Hopkins University, in 1993. His research interests include the development of noninvasive MR methods for detection of drug delivery to tumors and tumor response to therapy. This research also includes study of tumor drug resistance, determination of its mechanisms, and finding novel treatment strategies. He is also involved in development of molecular imaging MR technologies with a particular emphasis on noninvasive imaging of cell surface receptors that are targets for molecular therapy and can also be used as noninvasive reporters of the expression of therapeutic genes.
Dr. Artemov is a member of American Association for Cancer Research and International Society for Magnetic Resonance in Medicine.

Zaver M. Bhujwalla received the Ph.D. degree from the University of London, London, U.K.
She is a Professor in the Departments of Radiology and Oncology, Johns Hopkins University (JHU) School of Medicine, Baltimore, MD. She is also the Director of the JHU in vivo Cellular and Molecular Imaging Center. She joined the Department of Radiology at the Johns Hopkins University School of Medicine in 1989. Her research interests include the application of MR imaging technology to promote the understanding of cancer biology in general and, in particular, to characterize the nature and importance of tumor-specific alterations in cellular metabolism and vascularization. Her additional research interests are to understand the role of vascularization, lymphangiogenesis, and the tumor's physiological environment in breast and prostate cancer invasion and metastasis using imaging techniques.
Dr. Bhujwalla serves on the editorial boards of Cancer Research, NMR in Biomedicine, Cancer Biology and Therapy, Molecular Imaging, and The Lancet Oncology, and she is a member of the Medical Imaging Study Section of the NIH.
References
- 1.Koenig SH, Brown RD., 3rd . Relaxometry and MRI. In: RJ Gillies., editor. NMR in Physiology and Biomedicine. San Diego, CA: Academic; 1994. p. 70. [Google Scholar]
- 2.Caravan P, Cloutier NJ, Greenfield MT, McDermid SA, Dunham SU, Bulte JW, Amedio JC, Jr, Looby RJ, Supkowski RM, Horrocks WD, McMurry TJ, Lauffer RB. The interaction of MS-325 with human serum albumin and its effect on proton relaxation rates. J Amer Chem Soc. 2002;124:3152–3162. doi: 10.1021/ja017168k. [DOI] [PubMed] [Google Scholar]
- 3.Strable E, Bulte JW, Moskowitz BM, Vivekanandan K, Allen M, Douglas T. Synthesis and characterization of soluble iron oxide-dendrimer composites. Chem Mater. 2001;13:2201–2209. [Google Scholar]
- 4.Schmiedl U, Ogan M, Paajanen H, Marotti M, Crooks LE, Brito AC, Brasch RC. Albumin labeled with Gd-DTPA as an intravascular, blood pool-enhancing agent for MR imaging: Biodistribution and imaging studies. Radiology. 1987;162:205–210. doi: 10.1148/radiology.162.1.3786763. [DOI] [PubMed] [Google Scholar]
- 5.Bhujwalla ZM, Artemov D, Natarajan K, Ackerstaff E, Solaiyappan M. Vascular differences detected by MRI for metastatic versus nonmetastatic breast and prostate cancer xenografts. Neoplasia. 2000;3:1–11. doi: 10.1038/sj.neo.7900129. [DOI] [PMC free article] [PubMed] [Google Scholar]
- 6.Bogdanov AA, Jr, Weissleder R, Frank HW, Bogdanova AV, Nossif N, Schaffer BK, Tsai E, Papisov MI, Brady TJ. A new macromolecule as a contrast agent for MR angiography: Preparation, properties, and animal studies. Radiology. 1993;187:701–706. doi: 10.1148/radiology.187.3.8497616. [DOI] [PubMed] [Google Scholar]
- 7.Gohr-Rosenthal S, Schmitt-Willich H, Ebert W, Conrad J. The demonstration of human tumors on nude mice using gadolinium-labeled monoclonal antibodies for magnetic resonance imaging. Invest Radiol. 1993;28:789–795. [PubMed] [Google Scholar]
- 8.Artemov D, Mori N, Ravi R, Bhujwalla ZM. Magnetic resonance molecular imaging of the Her-2/neu receptor. Cancer Res. 2003;63:2723–2727. [PubMed] [Google Scholar]
- 9.Bryant LH, Jr, Brechbiel MW, Wu C, Bulte JW, Herynek V, Frank JA. Synthesis and relaxometry of high-generation (G = 5, 7, 9, and 10) PAMAM dendrimer-DOTA-gadolinium chelates. J Magn Reson Imag. 1999;9:348–352. doi: 10.1002/(sici)1522-2586(199902)9:2<348::aid-jmri30>3.0.co;2-j. [DOI] [PubMed] [Google Scholar]
- 10.Kobayashi H, Kawamoto S, Saga T, Sato N, Hiraga A, Ishimori T, Akita Y, Mamede MH, Konishi J, Togashi K, Brechbiel MW. Novel liver macromolecular MR contrast agent with a polypropylenimine diaminobutyl dendrimer core: Comparison to the vascular MR contrast agent with the polyamidoamine dendrimer core. Magn Reson Med. 2001;46:795–802. doi: 10.1002/mrm.1259. [DOI] [PubMed] [Google Scholar]
- 11.Sipkins DA, Cheresh DA, Kazemi MR, Nevin LM, Bednarski MD, Li KC. Detection of tumor angiogenesis in vivo by alphaVbeta3-targeted magnetic resonance imaging. Nat Med. 1998;4:623–626. doi: 10.1038/nm0598-623. [DOI] [PubMed] [Google Scholar]
- 12.Anderson SA, Rader RK, Westlin WF, Null C, Jackson D, Lanza GM, Wickline SA, Kotyk JJ. Magnetic resonance contrast enhancement of neovasculature with alpha(v)beta(3)-targeted nanoparticles. Magn Reson Med. 2000;44:433–439. doi: 10.1002/1522-2594(200009)44:3<433::aid-mrm14>3.0.co;2-9. [DOI] [PubMed] [Google Scholar]
- 13.Winter PM, Caruthers SD, Kassner A, Harris TD, Chinen LK, Allen JS, Lacy EK, Zhang H, Robertson JD, Wickline SA, Lanza GM. Molecular imaging of angiogenesis in nascent Vx-2 rabbit tumors using a novel alpha(nu)beta3-targeted nanoparticle and 1.5 tesla magnetic resonance imaging. Cancer Res. 2003;63:5838–5843. [PubMed] [Google Scholar]
- 14.Konda SD, Aref M, Brechbiel M, Wiener EC. Development of a tumor-targeting MR contrast agent using the high-affinity folate receptor: Work in progress. Invest Radiol. 2000;35:50–57. doi: 10.1097/00004424-200001000-00006. [DOI] [PubMed] [Google Scholar]
- 15.Louie AY, Huber MM, Ahrens ET, Rothbacher U, Moats R, Jacobs RE, Fraser SE, Meade TJ. In vivo visualization of gene expression using magnetic resonance imaging. Nat Biotechnol. 2000;18:321–325. doi: 10.1038/73780. [DOI] [PubMed] [Google Scholar]
- 16.Bogdanov A, Jr, Matuszewski L, Bremer C, Petrovsky A, Weissleder R. Oligomerization of paramagnetic substrates result in signal amplification and can be used for MR imaging of molecular targets. Mol Imag. 2002;1:16–23. doi: 10.1162/15353500200200001. [DOI] [PubMed] [Google Scholar]
- 17.Gueron M. Nuclear relaxation in macromolecules by paramagnetic ions: A novel mechanism. J Magn Reson. 1975;19:58–66. [Google Scholar]
- 18.Weissleder R, Cheng HC, Bogdanova A, Bogdanov A. Magnetically labeled cells can be detected by MR imaging. J Magn Reson Imag. 1997;7:258–263. doi: 10.1002/jmri.1880070140. [DOI] [PubMed] [Google Scholar]
- 19.Dodd SJ, Williams M, Suhan JP, Williams DS, Koretsky AP, Ho C. Detection of single mammalian cells by high-resolution magnetic resonance imaging. Biophys J. 1999;76:103–109. doi: 10.1016/S0006-3495(99)77182-1. [DOI] [PMC free article] [PubMed] [Google Scholar]
- 20.Bulte JW, Douglas T, Witwer B, Zhang SC, Strable E, Lewis BK, Zywicke H, Miller B, van Gelderen P, Moskowitz BM, Duncan ID, Frank JA. Magnetodendrimers allow endosomal magnetic labeling and in vivo tracking of stem cells. Nat Biotechnol. 2001;19:1141–1147. doi: 10.1038/nbt1201-1141. [DOI] [PubMed] [Google Scholar]
- 21.Bulte JW, Hoekstra Y, Kamman RL, Magin RL, Webb AG, Briggs RW, Go KG, Hulstaert CE, Miltenyi S, The TH. Specific MR imaging of human lymphocytes by monoclonal antibody-guided dextran-magnetite particles. Magn Reson Med. 1992;25:148–157. doi: 10.1002/mrm.1910250115. [DOI] [PubMed] [Google Scholar]
- 22.Kang HW, Josephson L, Petrovsky A, Weissleder R, Bogdanov A., Jr Magnetic resonance imaging of inducible E-selectin expression in human endothelial cell culture. Bioconjug Chem. 2002;13:122–127. doi: 10.1021/bc0155521. [DOI] [PubMed] [Google Scholar]
- 23.Artemov D, Mori N, Okollie B, Bhujwalla ZM. MR molecular imaging of the Her-2/neu receptor in breast cancer cells using targeted iron oxide nanoparticles. Magn Reson Med. 2003;49:403–408. doi: 10.1002/mrm.10406. [DOI] [PubMed] [Google Scholar]
- 24.Zhao M, Beauregard DA, Loizou L, Davletov B, Brindle KM. Non-invasive detection of apoptosis using magnetic resonance imaging and a targeted contrast agent. Nat Med. 2001;7:1241–1244. doi: 10.1038/nm1101-1241. [DOI] [PubMed] [Google Scholar]
- 25.Weissleder R, Moore A, Mahmood U, Bhorade R, Benveniste H, Chiocca EA, Basilion JP. In vivo magnetic resonance imaging of transgene expression. Nat Med. 2000;6:351–355. doi: 10.1038/73219. [DOI] [PubMed] [Google Scholar]
- 26.Stegman LD, Rehemtulla A, Beattie B, Kievit E, Lawrence TS, Blasberg RG, Tjuvajev JG, Ross BD. Noninvasive quantitation of cytosine deaminase transgene expression in human tumor xenografts with in vivo magnetic resonance spectroscopy. Proc Nat Acad Sci USA. 1999;96:9821–9826. doi: 10.1073/pnas.96.17.9821. [DOI] [PMC free article] [PubMed] [Google Scholar]
- 27.Aboagye EO, Artemov D, Senter P, Bhujwalla ZM. Intratumoral conversion of 5-fluorocytosine to 5-fluorouracil by monoclonal antibody-cytosine deaminase conjugates: Noninvasive detection of prodrug activation by magnetic resonance spectroscopy and spectroscopic imaging. Cancer Res. 1998;58:4075–4078. [PubMed] [Google Scholar]
- 28.Guivel-Scharen V, Sinnwell T, Wolff SD, Balaban RS. Detection of proton chemical exchange between metabolites and water in biological tissues. J Magn Reson. 1998;133:36–45. doi: 10.1006/jmre.1998.1440. [DOI] [PubMed] [Google Scholar]
- 29.Ward KM, Balaban RS. Determination of pH using water protons and chemical exchange dependent saturation transfer (CEST) Magn Reson Med. 2000;44:799–802. doi: 10.1002/1522-2594(200011)44:5<799::aid-mrm18>3.0.co;2-s. [DOI] [PubMed] [Google Scholar]
- 30.Goffeney N, Bulte JW, Duyn J, Bryant LH, Jr, van Zijl PC. Sensitive NMR detection of cationic-polymer-based gene delivery systems using saturation transfer via proton exchange. J Amer Chem Soc. 2001;123:8628–8629. doi: 10.1021/ja0158455. [DOI] [PubMed] [Google Scholar]
- 31.Snoussi K, Bulte JW, Gueron M, Van Zijl PC. Sensitive CEST agents based on nucleic acid imino proton exchange: Detection of poly(rU) and of a dendrimer-poly(rU) model for nucleic acid delivery and pharmacology. Magn Reson Med. 2003;49:998–1005. doi: 10.1002/mrm.10463. [DOI] [PubMed] [Google Scholar]
- 32.Chu SC, Pike MM, Fossel ET, Smith TW, Balschi JA, Springer CS., Jr Aqeous shift-reagents for high-resolution cationic nuclear magnetic-resonance 3. DY(TTHA)3-, TM(TTHA)3-, and TM(PPP)27- J Magn Reson. 1984;56:33–47. [Google Scholar]
- 33.Zhang S, Winter P, Wu K, Sherry AD. A novel europium(III)-based MRI contrast agent. J Amer Chem Soc. 2001;123:1517–1518. doi: 10.1021/ja005820q. [DOI] [PubMed] [Google Scholar]
- 34.Jain RK. Transport of molecules across tumor vasculature. Cancer Metastasis Rev. 1987;6:559–593. doi: 10.1007/BF00047468. [DOI] [PubMed] [Google Scholar]
- 35.Jain RK. Determinants of tumor blood flow: A review. Cancer Res. 1988;48:2641–2658. [PubMed] [Google Scholar]
- 36.Vaupel P, Kallinowski F, Okunieff P. Blood flow, oxygen and nutrient supply, and metabolic microenvironment of human tumors: A review. Cancer Res. 1989;49:6449–6465. [PubMed] [Google Scholar]
- 37.Aronen HJ, Cohen MS, Belliveau JW, Fordham JA, Rosen BR. Ultrafast imaging of brain tumors. Top Magn Reson Imag. 1993;5:14–24. [PubMed] [Google Scholar]
- 38.Hawighorst H, Knapstein PG, Weikel W, Knopp MV, Zuna I, Knof A, Brix G, Schaeffer U, Wilkens C, Schoenberg SO, Essig M, Vaupel P, van Kaick G. Angiogenesis of uterine cervical carcinoma: Characterization by pharmacokinetic magnetic resonance parameters and histological microvessel density with correlation to lymphatic involvement. Cancer Res. 1997;57:4777–4786. [PubMed] [Google Scholar]
- 39.Degani H, Gusis V, Weinstein D, Fields S, Strano S. Mapping pathophysiological features of breast tumors by MRI at high spatial resolution. Nat Med. 1997;3:780–782. doi: 10.1038/nm0797-780. [DOI] [PubMed] [Google Scholar]
- 40.Tofts PS. Modeling tracer kinetics in dynamic Gd-DTPA MR imaging. J MRI. 1997;7:91–101. doi: 10.1002/jmri.1880070113. [DOI] [PubMed] [Google Scholar]
- 41.Tofts PS, Brix G, Buckley DL, Evelhoch JL, Henderson E, Knopp MV, Larsson HB, Lee TY, Mayr NA, Parker GJ, Port RE, Taylor J, Weisskoff RM. Estimating kinetic parameters from dynamic contrast-enhanced T(1)-weighted MRI of a diffusable tracer: Standardized quantities and symbols. J MRI. 1999;10:223–232. doi: 10.1002/(sici)1522-2586(199909)10:3<223::aid-jmri2>3.0.co;2-s. [DOI] [PubMed] [Google Scholar]
- 42.Maeda M, Itoh S, Kimura H, Iwasaki T, Hayashi N, Yamamoto K, Ishii Y, Kubota T. Tumor vascularity in the brain: Evaluation with dynamic susceptibility-contrast MR imaging. Radiology. 1993;189:233–238. doi: 10.1148/radiology.189.1.8372199. [DOI] [PubMed] [Google Scholar]
- 43.Aronen HJ, Gazit IE, Louis DN, Buchbinder BR, Pardo FS, Weisskoff RM, Harsh GR, Cosgrove GR, Halpern EF, Hochberg FH, Rosen BR. Cerebral blood volume maps of gliomas: Comparison with tumor grade and histological findings. Radiology. 1994;191:41–51. doi: 10.1148/radiology.191.1.8134596. [DOI] [PubMed] [Google Scholar]
- 44.Eder JP, Jr, Supko JG, Clark JW, Puchalski TA, Garcia-Carbonero R, Ryan DP, Shulman LN, Proper J, Kirvan M, Rattner B, Connors S, Keogan MT, Janicek MJ, Fogler WE, Schnipper L, Kinchla N, Sidor C, Phillips E, Folkman J, Kufe DW. Phase I clinical trial of recombinant human endostatin administered as a short intravenous infusion repeated daily. J Clin Oncol. 2002;20:3772–3784. doi: 10.1200/JCO.2002.02.082. [DOI] [PubMed] [Google Scholar]
- 45.Jayson GC, Zweit J, Jackson A, Mulatero C, Julyan P, Ranson M, Broughton L, Wagstaff J, Hakannson L, Groenewegen G, Bailey J, Smith N, Hastings D, Lawrance J, Haroon H, Ward T, McGown AT, Tang M, Levitt D, Marreaud S, Lehmann FF, Herold M, Zwierzina H. Molecular imaging and biological evaluation of HuMV833 anti-VEGF antibody: Implications for trial design of antiangiogenic antibodies. J Nat Cancer Inst. 2002;94:1484–1493. doi: 10.1093/jnci/94.19.1484. [DOI] [PubMed] [Google Scholar]
- 46.Weisskoff RM, Zuo CS, Boxerman JL, Rosen BR. Microscopic susceptibility variation and transverse relaxation: Theory and experiment. Magn Reson Med. 1994;31:601–610. doi: 10.1002/mrm.1910310605. [DOI] [PubMed] [Google Scholar]
- 47.Boxerman JL, Hamberg LM, Rosen BR, Weisskoff RM. MR contrast due to intravascular magnetic susceptibility perturbations. Magn Reson Med. 1995;34:555–566. doi: 10.1002/mrm.1910340412. [DOI] [PubMed] [Google Scholar]
- 48.Dennie J, Mandeville JB, Boxerman JL, Packard SD, Rosen BR, Weisskoff RM. NMR imaging of changes in vascular morphology due to tumor angiogenesis. Magn Reson Med. 1998;40:793–799. doi: 10.1002/mrm.1910400602. [DOI] [PubMed] [Google Scholar]
- 49.Rosen BR, Belliveau JW, Buchbinder BR, McKinstry RC, Porkka LM, Kennedy DN, Neuder MS, Fisel CR, Aronen HJ, Kwong KK, Weisskoff RM, Cohen MS, Brady TJ. Contrast agents and cerebral hemodynamics. Magn Reson Med. 1991;19:285–292. doi: 10.1002/mrm.1910190216. [DOI] [PubMed] [Google Scholar]
- 50.Donahue KM, Krouwer HGJ, Rand SD, Pathak AP, Marzalkowski CS, Censky SC, Prost RW. Utility of simultaneously-acquired gradient-echo and spin-echo cerebral blood volume and morphology maps in brain tumor patients. Mag Reson Med. 2000;43:845–853. doi: 10.1002/1522-2594(200006)43:6<845::aid-mrm10>3.0.co;2-j. [DOI] [PubMed] [Google Scholar]
- 51.Donahue KM, Weisskoff RM, Chesler DA, Kwong KK, Bogdanov AA, Mandeville JB, Rosen BR. Improving MR quantitation of regional blood volume with intravascular T1 contrast agents: Accuracy, precision, and water exchange. Magn Reson Med. 1996;36:858–867. doi: 10.1002/mrm.1910360608. [DOI] [PubMed] [Google Scholar]
- 52.Landis CS, Li X, Telang FW, Molina PE, Palyka I, Vetek G, Springer CS., Jr Equilibrium transcytolemmal water-exchange kinetics in skeletal muscle in vivo. Magn Reson Med. 1999;42:467–478. doi: 10.1002/(sici)1522-2594(199909)42:3<467::aid-mrm9>3.0.co;2-0. [DOI] [PubMed] [Google Scholar]
- 53.Yankeelov TE, Rooney WD, Li X, Springer CS., Jr Variation of the relaxographic “shutter-speed” for transcytolemmal water exchange affects the CR bolus-tracking curve shape. Magn Reson Med. 2003;50:1151–1169. doi: 10.1002/mrm.10624. [DOI] [PubMed] [Google Scholar]
- 54.Brasch R, Pham C, Shames D, Roberts T, van Dijke K, van Bruggen N, Mann J, Ostrowitzki S, Melnyk O. Assessing tumor angiogenesis using macromolecular MR imaging contrast media. J Magn Reson Imag. 1997;7:68–74. doi: 10.1002/jmri.1880070110. [DOI] [PubMed] [Google Scholar]
- 55.Pathak AP, Artemov D, Bhujwalla ZM. Novel system for determining contrast agent concentration in mouse blood in vivo. Magn Reson Med. 2004;51:612–615. doi: 10.1002/mrm.10727. [DOI] [PubMed] [Google Scholar]
- 56.Demsar F, Roberts TP, Schwickert HC, Shames DM, van Dijke CF, Mann JS, Saeed M, Brasch RC. A MRI spatial mapping technique for microvascular permeability and tissue blood volume based on macromolecular contrast agent distribution. Magn Reson Med. 1997;37:236–242. doi: 10.1002/mrm.1910370216. [DOI] [PubMed] [Google Scholar]
- 57.Turetschek K, Floyd E, Shames DM, Roberts TP, Preda A, Novikov V, Corot C, Carter WO, Brasch RC. Assessment of a rapid clearance blood pool MR contrast medium (P792) for assays of microvascular characteristics in experimental breast tumors with correlations to histopathology. Magn Reson Med. 2001;45:880–886. doi: 10.1002/mrm.1117. [DOI] [PubMed] [Google Scholar]
- 58.Kim YR, Rebro KJ, Schmainda KM. Water exchange and inflow affect the accuracy of T1-GRE blood volume measurements: Implications for the evaluation of tumor angiogenesis. Magn Reson Med. 2002;47:1110–1120. doi: 10.1002/mrm.10175. [DOI] [PubMed] [Google Scholar]
- 59.Schwickert HC, Roberts TP, Shames DM, van Dijke CF, Disston A, Muhler A, Mann JS, Brasch RC. Quantification of liver blood volume: Comparison of ultra short TI inversion recovery echo planar imaging (ULSTIR-EPI), with dynamic 3D-gradient recalled echo imaging. Magn Reson Med. 1995;34:845–852. doi: 10.1002/mrm.1910340609. [DOI] [PubMed] [Google Scholar]
- 60.Ogawa S. Oxygenation-sensitive contrast in MR image of rodent brain at high magnetic fields. Magn Reson Med. 1990;14:68–78. doi: 10.1002/mrm.1910140108. [DOI] [PubMed] [Google Scholar]
- 61.Abramovitch R, Dafni H, Smouha E, Benjamin L, Neeman M. In vivo prediction of vascular susceptibility to vascular endothelial growth factor withdrawal: Magnetic resonance imaging of C6 rat glioma in nude mice. Cancer Res. 1999;59:5012–5016. [PubMed] [Google Scholar]
- 62.Carmeliet P, Dor Y, Herbert JM, Fukumura D, Brusselmans K, Dewerchin M, Neeman M, Bono F, Abramovitch R, Maxwell P, Koch CJ, Ratcliffe P, Moons L, Jain RK, Collen D, Keshet E. Role of HIF-1 in hypoxia-mediated apoptosis, cell proliferation and tumor angiogenesis. Nature. 1998;394:485–490. doi: 10.1038/28867. [DOI] [PubMed] [Google Scholar]
- 63.Pathak AP, Ward BD, Rebro KJ, Schmainda KM. The effect of brain tumor angiogenesis on the in vivo relationship between contrast agent (MION) dose and the gradient echo relaxation rate change (ΔR2*) J MRI. 2003 doi: 10.1002/jmri.10371. [DOI] [PubMed] [Google Scholar]
- 64.Silva AC, Kim SG, Garwood M. Imaging blood flow in brain tumors using arterial spin labeling. Magn Reson Med. 2000;44:169–173. doi: 10.1002/1522-2594(200008)44:2<169::aid-mrm1>3.0.co;2-u. [DOI] [PubMed] [Google Scholar]
- 65.Preul MC, Caramanos Z, Villemure JG, Shenouda G, LeBlanc R, Langleben A, Arnold DL. Using proton magnetic resonance spectroscopic imaging to predict in vivo the response of recurrent malignant gliomas to tamoxifen chemotherapy. Neurosurgery. 2000;46:306–318. doi: 10.1097/00006123-200002000-00009. [DOI] [PubMed] [Google Scholar]
- 66.Nelson SJ, Graves E, Pirzkall A, Li X, Antiniw Chan A, Vigneron DB, McKnight TR. In vivo molecular imaging for planning radiation therapy of gliomas: An application of 1H MRSI. J Magn Reson Imag. 2002;16:464–476. doi: 10.1002/jmri.10183. [DOI] [PubMed] [Google Scholar]
- 67.Tkac I, Starcuk Z, Choi IY, Gruetter R. In vivo 1H NMR spectroscopy of rat brain at 1 ms echo time. Magn Reson Med. 1999;41:649–656. doi: 10.1002/(sici)1522-2594(199904)41:4<649::aid-mrm2>3.0.co;2-g. [DOI] [PubMed] [Google Scholar]
- 68.Haase A, Frahm J, Hanicke W, Matthaei D. 1H NMR chemical shift selective (CHESS) imaging. Phys Med Biol. 1985;30:341–344. doi: 10.1088/0031-9155/30/4/008. [DOI] [PubMed] [Google Scholar]
- 69.Bottomley PA. Ann NY Acad Sci. 1984;508 [Google Scholar]
- 70.Shungu DC, Glickson JD. Band-selective spin echoes for in vivo localized 1H NMR spectroscopy. Magn Reson Med. 1994;32:277–284. doi: 10.1002/mrm.1910320302. [DOI] [PubMed] [Google Scholar]
- 71.Star-Lack J, Nelson SJ, Kurhanewicz J, Huang LR, Vigneron DB. Improved water and lipid suppression for 3D PRESS CSI using RF band selective inversion with gradient dephasing (BASING) Magn Reson Med. 1997;38:311–321. doi: 10.1002/mrm.1910380222. [DOI] [PubMed] [Google Scholar]
- 72.Callies R, Sri-Pathmanathan RM, Ferguson DY, Brindle KM. The appearance of neutral lipid signals in the 1H NMR spectra of a myeloma cell line correlates with the induced formation of cytoplasmic lipid droplets. Magn Reson Med. 1993;29:546–550. doi: 10.1002/mrm.1910290418. [DOI] [PubMed] [Google Scholar]
- 73.Barba I, Cabanas ME, Arus C. The relationship between nuclear magnetic resonance-visible lipids, lipid droplets, and cell proliferation in cultured C6 cells. Cancer Res. 1999;59:1861–1868. [PubMed] [Google Scholar]
- 74.Al-Saffar NM, Titley JC, Robertson D, Clarke PA, Jackson LE, Leach MO, Ronen SM. Apoptosis is associated with triacylglycerol accumulation in Jurkat T-cells. Brit J Cancer. 2002;86:963–970. doi: 10.1038/sj.bjc.6600188. [DOI] [PMC free article] [PubMed] [Google Scholar]
- 75.Sotak CH. A volume-localized, two-dimensional NMR method for the determination of lactate using zero-quantum coherence created in a stimulated echo pulse sequence. Magn Reson Med. 1988;7:364–370. doi: 10.1002/mrm.1910070315. [DOI] [PubMed] [Google Scholar]
- 76.Hurd RE, Freeman D. Proton editing and imaging of lactate. NMR Biomed. 1991;4:73–80. doi: 10.1002/nbm.1940040208. [DOI] [PubMed] [Google Scholar]
- 77.de Graaf RA, Luo Y, Terpstra M, Garwood M. Spectral editing with adiabatic pulses. J Magn Reson B. 1995;109:184–193. doi: 10.1006/jmrb.1995.0008. [DOI] [PubMed] [Google Scholar]
- 78.Bhujwalla ZM, Shungu DC, Glickson JD. Effects of blood flow modifiers on tumor metabolism observed in vivo by proton magnetic resonance spectroscopic imaging. Magn Reson Med. 1996;36:204–211. doi: 10.1002/mrm.1910360206. [DOI] [PubMed] [Google Scholar]
- 79.He Q, Shungu DC, van Zijl PC, Bhujwalla ZM, Glickson JD. Single-scan in vivo lactate editing with complete lipid and water suppression by selective multiple-quantum-coherence transfer (Sel-MQC) with application to tumors. J Magn Reson B. 1995;106:203–211. doi: 10.1006/jmrb.1995.1035. [DOI] [PubMed] [Google Scholar]
- 80.He Q, Bhujwalla ZM, Maxwell RJ, Griffiths JR, Glickson JD. Proton NMR observation of the antineoplastic agent Iproplatin in vivo by selective multiple quantum coherence transfer (Sel-MQC) Magn Reson Med. 1995;33:414–416. doi: 10.1002/mrm.1910330315. [DOI] [PubMed] [Google Scholar]
- 81.Negendank W. Studies of human tumors by MRS: A review. NMR Biomed. 1992;5:303–324. doi: 10.1002/nbm.1940050518. [DOI] [PubMed] [Google Scholar]
- 82.Gribbestad IS, Sitter B, Lundgren S, Krane J, Axelson D. Metabolite composition in breast tumors examined by proton nuclear magnetic resonance spectroscopy. Anticancer Res. 1999;19:1737–1746. [PubMed] [Google Scholar]
- 83.Aboagye EO, Bhujwalla ZM. Malignant transformation alters membrane choline phospholipid metabolism of human mammary epithelial cells. Cancer Res. 1999;59:80–84. [PubMed] [Google Scholar]
- 84.Katz-Brull R, Degani H. Kinetics of choline transport and phosphorylation in human breast cancer cells: NMR application of the zero trans method. Anticancer Res. 1996;16:1375–1380. [PubMed] [Google Scholar]
- 85.Ramirez de Molina A, Gutierrez R, Ramos MA, Silva JM, Silva J, Bonilla F, Sanchez JJ, Lacal JC. Increased choline kinase activity in human breast carcinomas: Clinical evidence for a potential novel antitumor strategy. Oncogene. 2002;21:4317–4322. doi: 10.1038/sj.onc.1205556. [DOI] [PubMed] [Google Scholar]
- 86.Ramirez de Molina A, Rodriguez-Gonzalez A, Gutierrez R, Martinez-Pineiro L, Sanchez J, Bonilla F, Rosell R, Lacal J. Overexpression of choline kinase is a frequent feature in human tumor-derived cell lines and in lung, prostate, and colorectal human cancers. Biochem Biophys Res Commun. 2002;296:580–583. doi: 10.1016/s0006-291x(02)00920-8. [DOI] [PubMed] [Google Scholar]
- 87.Yamashita S, Yamashita J, Ogawa M. Overexpression of group II phospholipase A2 in human breast cancer tissues is closely associated with their malignant potency. Brit J Cancer. 1994;69:1166–1170. doi: 10.1038/bjc.1994.229. [DOI] [PMC free article] [PubMed] [Google Scholar]
- 88.Guthridge CJ, Stampfer MR, Clark MA, Steiner MR. Phospholipases A2 in ras-transformed and immortalized human mammary epithelial cells. Cancer Lett. 1994;86:11–21. doi: 10.1016/0304-3835(94)90175-9. [DOI] [PubMed] [Google Scholar]
- 89.Uchida N, Okamura S, Nagamachi Y, Yamashita S. Increased phospholipase D activity in human breast cancer. J Cancer Res Clin Oncol. 1997;123:280–285. doi: 10.1007/BF01208639. [DOI] [PubMed] [Google Scholar]
- 90.Noh DY, Ahn SJ, Lee RA, Park IA, Kim JH, Suh PG, Ryu SH, Lee KH, Han JS. Overexpression of phospholipase D1 in human breast cancer tissues. Cancer Lett. 2000;161:207–214. doi: 10.1016/s0304-3835(00)00612-1. [DOI] [PubMed] [Google Scholar]
- 91.Ackerstaff E, Glunde K, Bhujwalla ZM. Choline phospholipid metabolism: A target in cancer cells? J Cell Biochem. 2003;90:525–533. doi: 10.1002/jcb.10659. [DOI] [PubMed] [Google Scholar]
- 92.Katz-Brull R, Lavin PT, Lenkinski RE. Clinical utility of proton magnetic resonance spectroscopy in characterizing breast lesions. J Nat Cancer Inst. 2002;94:1197–1203. doi: 10.1093/jnci/94.16.1197. [DOI] [PubMed] [Google Scholar]
- 93.Kurhanewicz J, Vigneron DB, Nelson SJ. Three-dimensional magnetic resonance spectroscopic imaging of brain and prostate cancer. Neoplasia. 2000;2:166–189. doi: 10.1038/sj.neo.7900081. [DOI] [PMC free article] [PubMed] [Google Scholar]
- 94.Li X, Lu Y, Pirzkall A, McKnight T, Nelson SJ. Analysis of the spatial characteristics of metabolic abnormalities in newly diagnosed glioma patients. J Magn Reson Imag. 2002;16:229–237. doi: 10.1002/jmri.10147. [DOI] [PubMed] [Google Scholar]
- 95.Artemov D, Bhujwalla ZM, Pilatus U, Glickson JD. Two-compartment model for determination of glycolytic rates of solid tumors by in vivo 13C NMR spectroscopy. NMR Biomed. 1998;11:395–404. doi: 10.1002/(sici)1099-1492(199812)11:8<395::aid-nbm536>3.0.co;2-r. [DOI] [PubMed] [Google Scholar]
- 96.Nielsen FU, Daugaard P, Bentzen L, Stodkilde-Jorgensen H, Overgaard J, Horsman MR, Maxwell RJ. Effect of changing tumor oxygenation on glycolytic metabolism in a murine C3H mammary carcinoma assessed by in vivo nuclear magnetic resonance spectroscopy. Cancer Res. 2001;61:5318–5325. [PubMed] [Google Scholar]
- 97.Katz-Brull R, Margalit R, Degani H. Differential routing of choline in implanted breast cancer and normal organs. Magn Reson Med. 2001;46:31–38. doi: 10.1002/mrm.1157. [DOI] [PubMed] [Google Scholar]
- 98.Ronen SM, Degani H. The application of 13C NMR to the characterization of phospholipid metabolism in cells. Magn Reson Med. 1992;25:384–389. doi: 10.1002/mrm.1910250219. [DOI] [PubMed] [Google Scholar]
- 99.Constantinidis I, Chatham JC, Wehrle JP, Glickson JD. In vivo 13CNMR spectroscopy of glucose metabolism of RIF-1 tumors. Magn Reson Med. 1991;20:17–26. doi: 10.1002/mrm.1910200103. [DOI] [PubMed] [Google Scholar]
- 100.Bhujwalla ZM, Constantinidis I, Chatham JC, Wehrle JP, Glickson JD. Energy metabolism, pH changes, and lactate production in RIF-1 tumors following intratumoral injection of glucose. Int J Radiat Oncol Biol Phys. 1992;22:95–101. doi: 10.1016/0360-3016(92)90987-s. [DOI] [PubMed] [Google Scholar]
- 101.Schupp DG, Merkle H, Ellermann JM, Ke Y, Garwood M. Localized detection of glioma glycolysis using edited 1H MRS. Magn Reson Med. 1993;30:18–27. doi: 10.1002/mrm.1910300105. [DOI] [PubMed] [Google Scholar]
- 102.Ronen SM, Volk A, Mispelter J. Comparative NMR study of a differentiated rat hepatoma and its dedifferentiated subclone cultured as spheroids and as implanted tumors. NMR Biomed. 1994;7:278–286. doi: 10.1002/nbm.1940070605. [DOI] [PubMed] [Google Scholar]
- 103.Terpstra M, High WB, Luo Y, de Graaf RA, Merkle H, Garwood M. Relationships among lactate concentration, blood flow and histopathologic profiles in rat C6 glioma. NMR Biomed. 1996;9:185–194. doi: 10.1002/(SICI)1099-1492(199608)9:5<185::AID-NBM414>3.0.CO;2-X. [DOI] [PubMed] [Google Scholar]
- 104.Bottomley PA, Hardy CJ, Roemer PB, Mueller OM. Proton-decoupled, overhauser-enhanced, spatially localized carbon-13 spectroscopy in humans. Magn Reson Med. 1989;12:348–363. doi: 10.1002/mrm.1910120307. [DOI] [PubMed] [Google Scholar]
- 105.Rothman DL, Behar KL, Hetherington HP, den Hollander JA, Bendall MR, Petroff OA, Shulman RG. 1H-Observe/13C-decouple spectroscopic measurements of lactate and glutamate in the rat brain in vivo. Proc Nat Acad Sci USA. 1985;82:1633–1637. doi: 10.1073/pnas.82.6.1633. [DOI] [PMC free article] [PubMed] [Google Scholar]
- 106.van Zijl PC, Chesnick AS, DesPres D, Moonen CT, Ruiz-Cabello J, van Gelderen P. In vivo proton spectroscopy and spectroscopic imaging of [1–13 C]-glucose and its metabolic products. Magn Reson Med. 1993;30:544–551. doi: 10.1002/mrm.1910300504. [DOI] [PubMed] [Google Scholar]
- 107.Artemov D, Bhujwalla ZM, Glickson JD. In vivo selective measurement of (1–13 C)-glucose metabolism in tumors by heteronuclear cross polarization. Magn Reson Med. 1995;33:151–155. doi: 10.1002/mrm.1910330202. [DOI] [PubMed] [Google Scholar]
- 108.Leach MO, Verrill M, Glaholm J, Smith TA, Collins DJ, Payne GS, Sharp JC, Ronen SM, McCready VR, Powles TJ, Smith IE. Measurements of human breast cancer using magnetic resonance spectroscopy: A review of clinical measurements and a report of localized 31P measurements of response to treatment. NMR Biomed. 1998;11:314–340. doi: 10.1002/(sici)1099-1492(1998110)11:7<314::aid-nbm522>3.0.co;2-z. [DOI] [PubMed] [Google Scholar]
- 109.Okunieff PG, Koutcher JA, Gerweck L, McFarland E, Hitzig B, Urano M, Brady T, Neuringer L, Suit HD. Tumor size dependent changes in a murine fibrosarcoma: Use of in vivo 31P NMR for noninvasive evaluation of tumor metabolic status. Int J Radiat Oncol Biol Phys. 1986;12:793–799. doi: 10.1016/0360-3016(86)90038-6. [DOI] [PubMed] [Google Scholar]
- 110.Li SJ, Wehrle JP, Rajan SS, Steen RG, Glickson JD, Hilton J. Response of radiation-induced fibrosarcoma-1 in mice to cyclophosphamide monitored by in vivo 31P nuclear magnetic resonance spectroscopy. Cancer Res. 1988;48:4736–4742. [PubMed] [Google Scholar]
- 111.Vaupel P, Okunieff P, Kallinowski F, Neuringer LJ. Correlations between 31P-NMR spectroscopy and tissue O2 tension measurements in a murine fibrosarcoma. Radiat Res. 1989;120:477–493. [PubMed] [Google Scholar]
- 112.Rofstad EK, DeMuth P, Fenton BM, Sutherland RM. 31P nuclear magnetic resonance spectroscopy studies of tumor energy metabolism and its relationship to intracapillary oxyhemoglobin saturation status and tumor hypoxia. Cancer Res. 1988;48:5440–5446. [PubMed] [Google Scholar]
- 113.Tozer GM, Bhujwalla ZM, Griffiths JR, Maxwell RJ. Phosphorus-31 magnetic resonance spectroscopy and blood perfusion of the RIF-1 tumor following X-irradiation. Int J Radiat Oncol Biol Phys. 1989;16:155–164. doi: 10.1016/0360-3016(89)90023-0. [DOI] [PubMed] [Google Scholar]
- 114.de Certaines JD, Larsen VA, Podo F, Carpinelli G, Briot O, Henriksen O. In vivo 31P MRS of experimental tumours. NMR Biomed. 1993;6:345–365. doi: 10.1002/nbm.1940060602. [DOI] [PubMed] [Google Scholar]
- 115.Podo F. Tumour phospholipid metabolism. NMR Biomed. 1999;12:413–439. doi: 10.1002/(sici)1099-1492(199911)12:7<413::aid-nbm587>3.0.co;2-u. [DOI] [PubMed] [Google Scholar]
- 116.Ronen SM, Jackson LE, Beloueche M, Leach MO. Magnetic resonance detects changes in phosphocholine associated with Ras activation and inhibition in NIH 3T3 cells. Brit J Cancer. 2001;84:691–696. doi: 10.1054/bjoc.2000.1663. [DOI] [PMC free article] [PubMed] [Google Scholar]
- 117.Glunde K, Ackerstaff E, Natarajan K, Artemov D, Bhujwalla ZM. Real-time changes in 1H and 31P NMR spectra of malignant human mammary epithelial cells during treatment with the anti-inflammatory agent indomethacin. Magn Reson Med. 2002;48:819–825. doi: 10.1002/mrm.10295. [DOI] [PubMed] [Google Scholar]
- 118.Sterin M, Cohen JS, Mardor Y, Berman E, Ringel I. Levels of phospholipid metabolites in breast cancer cells treated with antimitotic drugs: A (31)p-magnetic resonance spectroscopy study. Cancer Res. 2001;61:7536–7543. [PubMed] [Google Scholar]
- 119.Moon RB, Richards JH. Determination of intracellular pH by 31P magnetic resonance. J Biol Chem. 1973;248:7276–7278. [PubMed] [Google Scholar]
- 120.Stubbs M, Bhujwalla ZM, Tozer GM, Rodrigues LM, Maxwell RJ, Morgan R, Howe FA, Griffiths JR. An assessment of 31P MRS as a method of measuring pH in rat tumours. NMR Biomed. 1992;5:351–359. doi: 10.1002/nbm.1940050606. [DOI] [PubMed] [Google Scholar]
- 121.Gillies RJ, Liu Z, Bhujwalla Z. 31P-MRS measurements of extracellular pH of tumors using 3-aminopropylphosphonate. Amer J Physiol. 1994;267:C195–C203. doi: 10.1152/ajpcell.1994.267.1.C195. [DOI] [PubMed] [Google Scholar]
- 122.Gillies RJ, Ogino T, Shulman RG, Ward DC. 31P nuclear magnetic resonance evidence for the regulation of intracellular pH by Ehrlich ascites tumor cells. J Cell Biol. 1982;95:24–28. doi: 10.1083/jcb.95.1.24. [DOI] [PMC free article] [PubMed] [Google Scholar]
- 123.Martinez-Zaguilan R, Lynch RM, Martinez GM, Gillies RJ. Vacuolar-type H(+)-ATPases are functionally expressed in plasma membranes of human tumor cells. Amer J Physiol. 1993;265:C1015–C1029. doi: 10.1152/ajpcell.1993.265.4.C1015. [DOI] [PubMed] [Google Scholar]
- 124.Sennoune SR, Bakunts K, Martinez GM, Chua-Tuan JL, Kebir Y, Attaya MN, Martinez-Zaguilan R. Vacuolar H+-ATPase in human breast cancer cells with distinct metastatic potential: Distribution and functional activity. Amer J Physiol Cell Physiol. 2004 doi: 10.1152/ajpcell.00407.2003. [DOI] [PubMed] [Google Scholar]
- 125.Tozer GM, Maxwell RJ, Griffiths JR, Pham P. Modification of the 31P magnetic resonance spectra of a rat tumour using vasodilators and its relationship to hypotension. Brit J Cancer. 1990;62:553–560. doi: 10.1038/bjc.1990.329. [DOI] [PMC free article] [PubMed] [Google Scholar]
- 126.Bhujwalla ZM, Tozer GM, Field SB, Maxwell RJ, Griffiths JR. The energy metabolism of RIF-1 tumours following hydralazine. Radiother Oncol. 1990;19:281–291. doi: 10.1016/0167-8140(90)90155-p. [DOI] [PubMed] [Google Scholar]
- 127.van Sluis R, Bhujwalla ZM, Raghunand N, Ballesteros P, Alvarez J, Cerdan S, Galons JP, Gillies RJ. In vivo imaging of extracellular pH using 1H MRSI. Magn Reson Med. 1999;41:743–750. doi: 10.1002/(sici)1522-2594(199904)41:4<743::aid-mrm13>3.0.co;2-z. [DOI] [PubMed] [Google Scholar]
- 128.Bhujwalla ZM, Artemov D, Ballesteros P, Cerdan S, Gillies RJ, Solaiyappan M. Combined vascular and extracellular pH imaging of solid tumors. NMR Biomed. 2002;15:114–119. doi: 10.1002/nbm.743. [DOI] [PubMed] [Google Scholar]
- 129.Garcia-Martin ML, Herigault G, Remy C, Farion R, Ballesteros P, Coles JA, Cerdan S, Ziegler A. Mapping extracellular pH in rat brain gliomas in vivo by 1H magnetic resonance spectroscopic imaging: Comparison with maps of metabolites. Cancer Res. 2001;61:6524–6531. [PubMed] [Google Scholar]
- 130.Zhou J, Payen JF, Wilson DA, Traystman RJ, vanZijl PC. Using the amide proton signals of intracellular proteins and peptides to detect pH effects in MRI. Nat Med. 2003;9:1085–1090. doi: 10.1038/nm907. [DOI] [PubMed] [Google Scholar]
- 131.Larsson HB, Fritz-Hansen T, Rostrup E, Sondergaard L, Ring P, Henriksen O. Myocardial perfusion modeling using MRI. Magn Reson Med. 1996;35:716–726. doi: 10.1002/mrm.1910350513. [DOI] [PubMed] [Google Scholar]
- 132.Henderson E, Sykes J, Drost D, Weinmann HJ, Rutt BK, Lee TY. Simultaneous MRI measurement of blood flow, blood volume, and capillary permeability in mammary tumors using two different contrast agents. J Magn Reson Imag. 2000;12:991–1003. doi: 10.1002/1522-2586(200012)12:6<991::aid-jmri26>3.0.co;2-1. [DOI] [PubMed] [Google Scholar]
- 133.Sorensen AG, Tievsky AL, Ostergaard L, Weisskoff RM, Rosen BR. Contrast agents in functional MR imaging. J Magn Reson Imag. 1997;7:47–55. doi: 10.1002/jmri.1880070108. [DOI] [PubMed] [Google Scholar]
- 134.Weisskoff RM. Pitfalls in MR measurement of tissue blood flow with intravascular tracers: Which mean transit time. Magn Reson Med. 1993;29:553–559. doi: 10.1002/mrm.1910290420. [DOI] [PubMed] [Google Scholar]
- 135.Ostergaard L, Weisskoff RM, Chesler DA, Gyldensted C, Rosen BR. High resolution measurement of cerebral blood flow using intravascular tracer bolus passages. Part I: Mathematical approach and statistical analysis. Magn Reson Med. 1996;36:715–725. doi: 10.1002/mrm.1910360510. [DOI] [PubMed] [Google Scholar]