

Abstract
We report numerical simulation results for the force-velocity relation for actin-polymerization-driven motility. We use Brownian dynamics to solve a physically consistent formulation of the dendritic nucleation model with semiflexible filaments that self-assemble and push a disk. We find that at small loads, the disk speed is independent of load, whereas at high loads, the speed decreases and vanishes at a characteristic stall pressure. Our results demonstrate that at small loads, the velocity is controlled by the reaction rates, whereas at high loads the stall pressure is determined by the mechanical properties of the branched actin network. The behavior is consistent with experiments and with our recently proposed self-diffusiophoretic mechanism for actin-polymerization-driven motility. New in vitro experiments to measure the force-velocity relation are proposed.
Introduction
Cells crawl by self-assembling dense arrays of branched actin filament networks near the plasma membrane. The self-assembly of these networks is carefully orchestrated by a coterie of proteins that regulate polymerization, depolymerization, branching, capping, and severing of filaments. This self-assembly process and resultant motility have been reproduced in vitro using a variety of moving surfaces in place of the cell membrane, such as cantilevers (1), beads (2,3), disks (4), vesicles (5,6), and oil droplets (7). On the theoretical side, several mechanisms have been advanced for the origin of motility (8–12). One potential way to distinguish between these proposed mechanisms is to measure the velocity of a moving object as a function of the external force applied to the object. Many experiments have measured the velocity of crawling cells (13) and of in vitro realizations of actin-based motility (1,14–19) while varying either the drag coefficient or an opposing force applied to the moving surface. Although there is considerable variation in the results, some experiments (1,13,14) seem to indicate that the velocity is independent of force at small forces, and decreases rapidly to zero at the stall force. This leads to velocity-force curve that is concave downwards in shape, in contradiction to most theoretical predictions (8,9,11,15,20–22).
In earlier work, we introduced a physically consistent model of actin-polymerization-driven motility that we explored numerically by Brownian dynamics simulations (12). The results suggested a new view of the mechanism of motility, in which Arp2/3-mediated growth of actin behind an object leads to a large increase in actin concentration there, causing the object to move forward as it is repelled by actin (12). As discussed in Lee and Liu (12), this mechanism can be viewed as an example of the phenomenon of self-diffusiophoresis (23,24), in which an object generates a steady-state concentration gradient that drives motion of the object. We will therefore refer to this mechanism as the “self-diffusiophoretic mechanism” throughout this article.
Our simulation model has two features that enable us to study not only motility, but also force generation. Specifically, we simulate semiflexible rather than rigid filaments, and the forces that arise in our model are physical ones that originate from interactions between constituents. In this paper, we take advantage of these features to study the force-velocity relation. We show that the results are consistent with the self-diffusiophoretic mechanism proposed in Lee and Liu (12). Our simulation results are also consistent with experiments by Parekh et al. (1), which measured the force-velocity relation by deflecting an atomic force microscope cantilever with the self-assembled actin network.
There is an additional intriguing feature of the experimentally measured force-velocity relation that any proposed mechanism must capture. For in vitro experiments on micron-sized beads, the force needed to drive the bead through a solution with a viscosity of 2.4 cP (18) at a speed of 0.2 μm/s (18,19) is of approximately tens of femtoNewtons. One might naively expect that an opposing force of tens of femtoNewtons would therefore suffice to stall the system; but the actual measured stall force is many orders of magnitude higher, in the nanoNewton range (1,13,15). Previously proposed models, such as the elastic Brownian ratchet model (8,9) and the actin gel model (10), have proposed resolutions of this discrepancy. Here we show that our proposed self-diffusiophoretic mechanism also provides a natural explanation of the discrepancy between the stall force and the driving force provided by the actin network at low loads. Finally, further experiments are proposed to measure the force-velocity relation.
Methods and Model
The details of our simulation model are described in a previous article (12). Our movable surface is a flat circular disk. Briefly, the disk is aligned normal to the z axis (see Fig. 1). The model explicitly breaks symmetry by emitting activated Arp2/3 complex from the back side of the disk (facing the −z direction). Motion of the disk in the ±x and ±y directions is prohibited in order to obtain results for motility at system sizes that are not too large; but the disk is free to move in the ±z directions.
Figure 1.
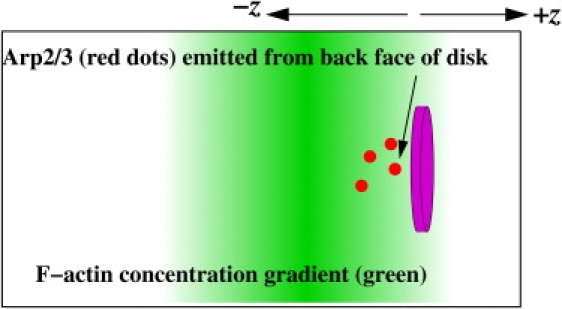
Schematic of simulation setup. A circular disk is centered in the simulation box in the x and y directions and is allowed to move in the ±z directions, where +z is to the right. Activated Arp2/3 complexes (red dots) are emitted in the form of point particles from the left-hand side of the disk (facing the −z direction). This causes branched filaments to assemble behind the disk, pushing it in the +z direction. The green shading indicates the steady-state actin concentration, with darker shading corresponding to higher actin concentration. Note that the length scale of the concentration gradient is not shown to scale, since it corresponds to a scale of 30 nm, which is small compared to the disk diameter (typically 100 nm in our simulations).
In contrast to previous simulations of actin-polymerization-driven motility in which actin materializes when it joins a filament and disappears when it depolymerizes off a filament, our simulation conserves matter. We explicitly simulate both the G-actin monomer and F-actin monomers as spheres. F-actin is not modeled as a double helix but as a single strand of connected monomers. The monomer-monomer and disk-monomer interactions are modeled by a soft repulsive potential (12). In addition, the monomers along a filament also interact with neighboring monomers via bond and bending potentials.
Arp2/3 is simulated as a point particle. It is reflected whenever it hits the disk without imparting momentum to the disk. When it touches a monomer in a filament, it sticks and tags the monomer for branching. The dynamics of the monomers, Arp2/3, and the disk are described by Brownian dynamics (25). We model biochemical processes, such as capping and depolymerization, stochastically according to the dendritic nucleation model (26,27). For example, when a free monomer comes within a capture distance and angle of the barbed end of a filament, it has some probability of being captured; this probability sets the polymerization rate. Likewise, if a free monomer comes into the proximity of a monomer tagged by Arp2/3 complex for branching, it has some probability of being captured to grow a new branch. A monomer at a pointed end has some probability of detaching in each time step, which sets the depolymerization rate, and monomers at the barbed end are assigned a probability for prohibiting further growth, which sets the capping rate. For details of the implementation of these biochemical processes, we refer the reader to Lee and Liu (12).
The advantage of treating both G-actin and F-actin on an equal footing is that our simulation is physically consistent in its treatment of interactions and forces. All forces arise as gradients of the potential energy of interaction, so our model allows calculation of the force exerted on the disk, and the velocity of the disk arises in direct response to the forces exerted on it. However, the explicit treatment of G-actin comes with the price of using higher rate constants (e.g., for depolymerization) to reach steady-state motion on the relatively short timescale of our simulation (see Table 1, reproduced from Lee and Liu (12)). To compensate, we fix the net fluxes to be comparable to the experimental values. In Lee and Liu (12), we performed a limited set of runs with somewhat more realistic rate constants and found that the trends move in the expected direction. In this article, we restrict our study to the rate constants corresponding to the standard conditions in Table 1 and Lee and Liu (12). We stress that our goal is not to reproduce experiments quantitatively, but to understand the phenomenon of force generation. The model that we have developed is a minimal one that is physically consistent, generates physical forces, and captures the basic features of the dendritic nucleation model.
Table 1.
Values of the parameters used in the simulations compared to those in experiments
| Parameter | In vitro exp. (Ref.) | Simulated |
|---|---|---|
| λp | 0.5–17.7 μm (44–48) | 0.1 μm |
| lave | 0.1–1 μm (49,50)∗ | 0.1 μm |
| Typical bead diameter | 0.2–2 μm (18) | 0.1 μm |
| Viscosity (η) | 2.4 cP (18) | 2.4 cP |
| D = kBT/3πησ | 36 μm2/s | 36 μm2/s |
| K+ | 11.6 μM−1 s−1 (26) | 504 μM−1 s−1 |
| K− | 0.3 s−1 (26) | 28,600 s−1 |
| [G-actin] | 7 μM (38) | 625 μM |
| K+[G-actin]/K− | 270 | 11 |
| Ka | — | ∼K+ |
| Kd | 0.002 s−1 (51) | 28,600 s−1 |
| [Arp2/3] | 0.1 μM (38) | 2.1 μM |
| Ka[Arp2/3]/Kd | N/A | 0.037 |
| KC+ | 8 μM−1 s−1 (52) | — |
| KC− | 0.00042 s−1 (52) | 0 s−1 |
| [Cap] | 0.1 μM (38) | — |
| kC+ = KC+[Cap] | 0.8 s−1 | 14,300 s−1 |
Unlike all other values in this column, this was not taken from an in vitro experiment.
The diameter of the spheres modeling actin monomers is taken to be σ = 5 nm. We assign a monomer diffusion coefficient of D = 36 μm2/s, corresponding to a characteristic time unit of τ ≡ σ2/2D = 0.35 μs. The standard diameter of the disk is 100 nm (20 monomers), which is very small compared to real bead sizes (typically 1 μm). We have varied the disk diameter over a range from 50 nm to 200 nm. The typical size of the simulation box is 200 nm × 200 nm × 400 nm; for disk diameters >100 nm, we use a simulation box of 400 nm × 400 nm × 400 nm. We adopt periodic boundary conditions in all directions.
We begin each run with 5–10% of the actin monomers in dimer form and the rest as free monomers. In our model, nucleation of filaments (which occurs at a very low rate experimentally (26)) is not allowed so the dimers serve as protofilaments. The results are not sensitive to the fraction of initial dimers as long as enough dimers are available. At the beginning of each run, dimers and monomers are distributed randomly in the system. Over time, filaments elongate and branch, leading to an accumulation of F-actin behind the disk that eventually pushes it forward with a well-defined average steady-state velocity (12). Because there are significant fluctuations in the displacement (28,29), we extract speeds from trajectories that are at least 7000-μs long (several times longer than the time needed to reach steady state, 1000 μs), and average over the final 3500–4200 μs of the trajectory. The error bars for the speed in all of our figures were obtained from the standard deviation calculated over five separate simulation runs under standard conditions (see Table 1).
There are several ways in which to vary the opposing force on the disk. Several experiments (14,16–19,28,30) have varied the opposing drag force Fdrag = ζDV ∝ ηDVRD, where ηD is the viscosity felt by the moving object, V is the velocity, and RD is the size of the moving object. We examine the drag force dependence by varying the disk radius, RD, and viscosity, ηD, and define the drag coefficient of the disk to be ζD = 2ηDRD. In the experiments, the viscosity is normally modified by adding a polymer, methylcellulose, to the system (14,17). This affects the viscosity felt by the movable object (a micron-sized plastic bead in the case of the experiments), but probably does not substantially affect the reaction rates or the diffusion of the free monomers, which are much smaller than the mesh size of the methylcellulose polymer solution. In our simulation, we therefore vary the viscosity felt by the disk (by varying the drag coefficient of the disk) while leaving fixed the viscosity felt by the monomers (determined by the drag coefficient for monomers).
An alternate way to measure the force-velocity relation is to apply an opposing force to the moving surface. Experimentally, this has been done via flexible cantilevers (1,13,15). We study the response to an applied opposing force on the disk by including this additional force in the equation of motion for the disk.
Results
Velocity versus load
We first vary the viscosity felt by the disk, ηD, and the disk radius, RD, at small loads (up to 0.3 pN). If the system had a fixed driving force, then the speed would vary as 1/ηDRD. If the system had a fixed driving pressure, then the speed would vary as RD/ηD. Fig. 2 shows that the velocity, V, is independent of both ηD and RD. In Fig. 2 a, ηD is varied at fixed RD, and in Fig. 2 b, RD is varied at fixed ηD. The fact that V is independent of ηD and RD shows that the driving force adjusts to maintain a fixed speed at small loads.
Figure 2.
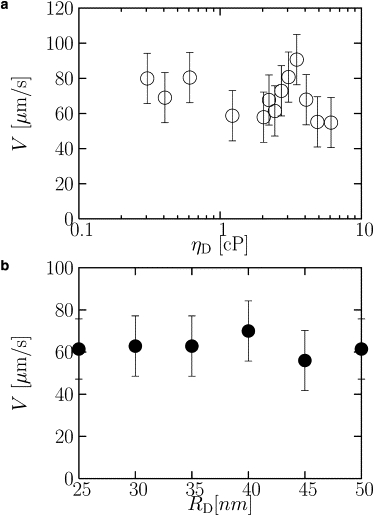
Velocity of disk as a function of (a) viscosity at fixed disk radius (RD = 50 nm) and (b) the disk radius at fixed viscosity (ηD = 2.4cP). The velocity is independent of both viscosity and disk radius, and is therefore independent of the drag force, over the indicated ranges.
In Fig. 3, we plot the velocity as a function of viscosity, ηD, over the full range of ηD studied. The standard viscosity used in our simulation runs is shown by the dashed vertical line. At low ηD, the velocity is constant, as shown in Fig. 2 as well as Fig. 3. Above a critical viscosity ηD∗ ≈ 20 cP, corresponding to a load force of ∼0.3 pN, the velocity decreases approximately as 1/ηD (solid line fit).
Figure 3.
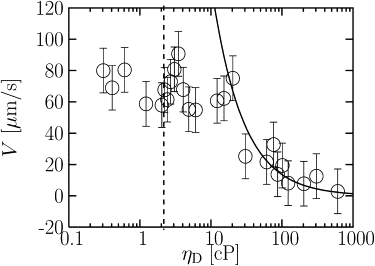
Velocity of disk as a function of viscosity for the full range studied. The velocity is constant up to ηD ≈ 20 cP, and decreases at high viscosities. The solid line is a fit of the high viscosity data to the form V = A/ηD, where the fit parameter is A = 0.22 pN/μm.
Fig. 4 a shows the velocity as a function of load force, where we have applied the load in two different ways. The open symbols correspond to the drag force, varied by changing ηD, the viscosity of the disk. The closed symbols correspond to an external opposing force applied to the disk for the standard conditions listed in Table 1. Note that these two sets of data fall on the same curve, suggesting that the structure of the actin comet tail does not depend on how the load force is applied.
Figure 4.
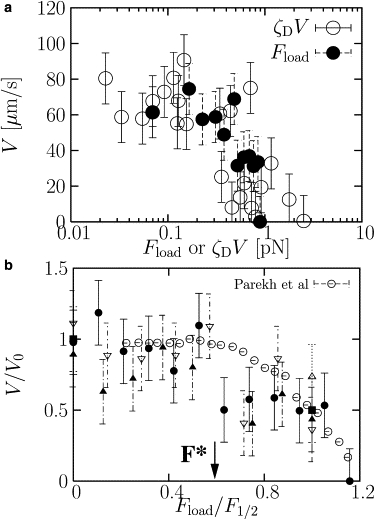
(a) Velocity of disk as a function of drag force (○) and applied external load at small drag force (●). The drag force is calculated using the equation ζDV, where ζD = 2ηDRD is the drag coefficient for the disk. There is good agreement between the two sets of results, as expected. (b) Velocity scaled by the zero applied load result, V/V0, as a function of applied force scaled by F1/2, where F1/2 is the force when the velocity drops to V0/2. To calculate V0, we use an average over the velocities shown in Fig. 2. Data for the disk velocity are shown at different disk sizes (RD = 30 nm, ▵; 35 nm, ■; 40 nm, ▿; 45 nm, ▴; and 50 nm, ●) and compared to the experimental data of Parekh et al. (1) (○) for actin-driven motion of an atomic-force microscope cantilever. There are no adjustable parameters in this comparison.
In Fig. 4 b, we have superimposed our data for velocity versus load force for different disk radii, RD, on the experimental data of Parekh et al. (1) by scaling V by its small load value, V0, and Fload by its value when V/V0 reaches 1/2, namely F1/2. We find reasonable agreement with experiment with no adjustable parameters. The force F∗, indicated by an arrow in Fig. 4 b, is the maximum load force that the system can sustain while maintaining a speed of V0, the zero-load value. Above F∗, the speed begins to decrease with increasing F. From the scaling collapse observed by Parekh et al. (1) and the collapse of our own data for different disk sizes, it is evident that F∗ is simply proportional to the stall force, so that F∗ ≈ 0.5Fstall.
Note that it is not possible to determine the functional form of the velocity versus load force curve from our data, due to the rather large error bars. In particular, it is difficult to tell whether the velocity drops smoothly with increasing force, or whether there is a second plateau in the velocity at higher loads. All we can conclude is that the velocity is constant at small loads, but then decreases to zero between F∗ and Fstall.
Stall force versus stall pressure
Fig. 4 a shows that the stall force for our system is ∼1 pN, far smaller than the experimentally measured value. The reason for this discrepancy is the size of our disk, which is much smaller than the moving objects studied experimentally. Fig. 5 shows that the stall pressure Pstall is independent of disk radius RD, suggesting that the stall force increases as RD2. According to Fig. 5, Pstall ≈ 0.12 nN μm2.
Figure 5.
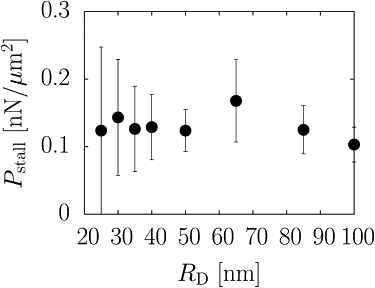
Stall pressure as a function of disk radius. There is no dependence on radius, suggesting that the stall force is proportional to the disk area, or RD2, which would correspond to an increase of a factor of 16 over the measured range.
Filament stiffness dependence
In our standard runs, the filament persistence length is ∼0.1 μm. This is approximately two orders of magnitude too low. To extrapolate our results to realistic persistence lengths, we also study systems with ℓp ≈ 1 μm. This is still shorter than the measured value for actin, but we note that mesh size (for example, the typical distance between branches) of the network is much shorter, so that we are in the correct regime in which the mesh size is short compared to the persistence length. As a result, the system is fairly rigid on the scale of the mesh size.
We have also studied systems with very flexible filaments with ℓp ≈ 0.01 μm. This may appear pointless, since such filaments have no biological relevance. In fact, it is extremely useful to vary filament stiffness since any proposed mechanism for motility should also account for the filament stiffness dependence.
Fig. 6 shows that although filament stiffness does not affect the speed at sufficiently small loads, as noted previously in Lee and Liu (12), it affects the force-velocity relation significantly at higher loads. In particular, the constant behavior of V with load at small loads is a feature of stiff filaments that disappears for floppy filaments with ℓp ≈ 0.01 μm. The shape of the velocity-force curve is now concave upwards for floppy filaments. In addition, we find that the stall pressure increases with filament stiffness.
Figure 6.
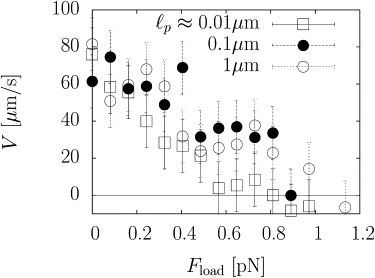
Disk velocity as a function of applied load for stiff filaments with persistence lengths of 0.1 μm (●), 1 μm (○), and for flexible filaments with a persistence length of 0.01 μm (□). For flexible filaments, the velocity decreases steadily with increasing load, whereas for stiff filaments, the velocity is initially constant.
To gain insight into the effect of filament stiffness on the force-velocity relation, we plot steady-state actin density profiles ρf(z) in Fig. 7. These steady-state profiles are shown in the frame of the moving disk, so that the disk is at z = 0. In calculating ρf(z), we have included only monomers in filaments that lie within a radius of RD + σ of the center axis along the z direction, where RD is the disk radius and σ is the monomer diameter. Just behind the disk, ρf(z) is small, because the disk repels actin (12). As z becomes more negative, ρf(z) increases to a maximum at ∼z ≈ −30 nm, because filaments are recruited by Arp2/3. As z becomes more negative, ρf(z) decreases again due to depolymerization.
Figure 7.
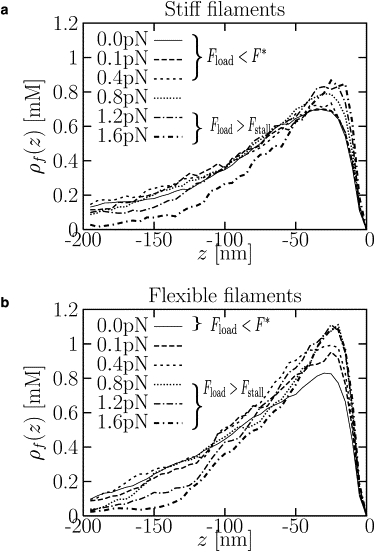
Steady-state density profiles of actin monomers in filaments, ρf, as a function of position z in the frame of the moving disk, whose position is at z = 0. The profiles are shown for different applied loads for (a) stiff filaments with a persistence length of 0.1 μm and (b) flexible filaments with a persistence length of 0.01 μm. For stiff filaments, there is no observable change in the density profile behind the moving disk (at z < 0) for Fload = 0 (solid) and Fload = 0.4 pN (short-dashed), whereas for flexible filaments, there is an appreciable difference between the profiles for Fload = 0 (solid) and Fload = 0.1 pN (long-dashed). For stiff filaments, the profile distorts when Fload = 0.8 pN, which is comparable to the stall force of ∼1 pN. Note that the disk is moving backward (Fload > Fstall) for the highest loads shown in both panels a and b.
Fig. 7 shows the evolution of the density profile with applied load. The self-diffusiophoretic mechanism suggests that changes in the profile in the range between the disk at z = 0 and the maximum at z ≈ −30 nm provide the key to understanding the behavior of the speed. For stiff filaments, there is no perceptible change of the profile in this range with increasing load until the load is comparable to F∗. For flexible filaments, on the other hand, the profile is quite sensitive to the applied load, suggesting that F∗ is much smaller and the network buckles under the load. This suggests that F∗ = c(ℓp)Fstall(ℓp), where c(ℓp) and Fstall(ℓp) both increase with persistence length.
Fig. 7 b also shows that at high Fload, the concentration gradient saturates at a maximum value. The corresponding maximum driving force corresponds to the stall pressure. Note that at the highest value of Fload shown in Fig. 7, Fload > Fstall and the disk is moving backward.
Discussion
Summary of results and comparison with self-diffusiophoretic mechanism
Our results show that at small loads, the velocity is independent of load, whereas at high loads, the velocity vanishes at the stall force Fstall, which is determined by the stall pressure: Fstall = Apstall, where Apstall is the cross-sectional area of the actin comet tail at the moving surface. Note that this result explains why the stall force (approximately nN in experiments) is so much larger than the minute force (tens of fN) exerted by the actin network to drive beads at the observed velocity in low-viscosity cell extracts. The difference between the two force scales can easily reach many orders of magnitude, depending on the size of the moving object and the viscosity of the solution. The crossover load force F∗ that separates the low- and high-load limits is a given fraction of the stall force (we find F∗ ≈ 0.5Fstall). Thus, the picture that emerges from our results automatically implies a velocity/force curve that is constant up to 0.5Fstall, then decreases to zero at Fstall.
We find that at small loads, our model is independent of load because it moves at a velocity set by the net polymerization rate. The force exerted by the actin tail adjusts to maintain this fixed velocity. This is consistent with the self-diffusiophoretic mechanism proposed earlier (12): the disk moves ahead of the accumulating actin to avoid it; thus, it achieves a speed determined by the buildup of actin, namely the net polymerization speed. This should hold true not only for our simulated model, with unphysical values of the rate constants, but for the real system, as well. Thus, the insight provided by the self-diffusiophoretic mechanism suggests that the speed of the moving surface should be given by the net polymerization speed in the real system.
At high loads, the actin comet tail can withstand up to a certain maximum pressure, namely the stall pressure. Again, this is consistent with our self-diffusiophoretic mechanism (12): the distortion of this concentration profile by an applied load will depend on the applied pressure, and the same distortion should be achieved for different disk sizes at a given pressure, not a given force. The distortion of the profile leads to a higher concentration gradient at the surface and consequently a higher driving pressure. The surface concentration gradient cannot grow indefinitely, however, so the driving pressure must eventually saturate. Once the opposing applied pressure reaches the maximum driving pressure, the system stalls.
The self-diffusiophoretic mechanism is also consistent with the filament stiffness dependence shown in Fig. 6. The magnitude of the distortion of the actin concentration profile due to an applied pressure will depend on the network compressibility near the moving surface, which will be affected by filament stiffness. For the same applied load, the distortion of the profile should be larger for a network of flexible filaments than for a network of stiff filaments. It is therefore not surprising that the force-velocity relation depends on filament stiffness even though the velocity is independent of stiffness in the small load limit.
The proposed self-diffusiophoretic mechanism for motility enables us to extract a prediction for the stall pressure for realistic rate constants. The stall pressure should correspond to the pressure needed to distort significantly the concentration profile, or equivalently, the branched actin network. The stall pressure should therefore be approximately the compression modulus of the tail at the surface. For cross-linked systems, the compression modulus should be of the same order of magnitude as the Young's modulus for the branched actin network. The latter quantity has been experimentally measured for actin comet tails, and is ∼kPa (31). This is indeed the order of magnitude of the experimental results for the stall pressure (1 kPa ≡ 1 nN/μm2). In general, the Young's modulus of a semiflexible network scales as
| (1) |
where ξm is the mesh size of the network and ℓp is the filament persistence length (32,33). We predict that the stall pressure scales similarly. Note that Eq. 1 explains why it is important for the filaments to be stiff—if they are flexible, the Young's modulus is low and the stall pressure will be low, as well.
Comparison with previous theoretical predictions
We stress that it is important to use physical forces that arise from interactions between particles and to allow free monomers as well as monomers in filaments to exert forces, to obtain physically meaningful results for motility and the force/velocity relation. Thus, some numerical approaches—such as those in which forces depend on the time step of the simulation or in which free monomers are treated in the context of a fixed concentration field—cannot be used to study force generation explicitly. When properly interpreted, however, such simulations can yield physical insight that can be used to adduce a force/velocity relation. For example, Carlsson (21) found that the velocity is independent of load force. In Carlsson's model, the filaments were infinitely rigid and fixed in space once they polymerized. According to the self-diffusiophoretic mechanism, this system would have an infinite compression modulus, which would lead to F∗ = ∞, so that the velocity would be constant at all loads. Carlsson's results are therefore consistent with our model in this limit.
The processive filament growth model (11) predicts a constant velocity at small loads, and a decreasing velocity at high loads. This shape is consistent with our results and with the experiments of Parekh et al. (1). However, we note that our simulations do not allow for processive filament growth, so it is not necessary to invoke a motorlike complex at the moving surface to obtain a force-velocity relation in reasonable agreement with experiments.
Both the elastic Brownian ratchet model (8,9) and the elastic gel model (10) explain the discrepancy between the femtoNewton-scale force needed to drive the system at small loads and the nanoNewton-scale stall force in ways that are similar to our proposed mechanism. All three models yield a fixed speed at small loads, arising from the rate at which F-actin is added by polymerization, and a fixed stall pressure at large loads. However, the predicted shape of the force-velocity relation is very different in between these two limits of small and large loads. In the elastic Brownian ratchet model (8,9), the velocity drops precipitously as the force increases from zero, and then decreases more gradually with increasing force, yielding a concave upwards shape for the velocity-force curve. We suspect that the primary reason for the discrepancy is the single-filament nature of the elastic Brownian ratchet model. The physical explanation that we have advanced for our results is explicitly a many-body one based on the existence of a well-defined, steady-state concentration profile for actin. It is not surprising that a single-filament model should fail to capture the physics of a cooperative, many-filament system.
The force-velocity relation predicted by the elastic gel model of Gerbal et al. (10) also differs from ours: it is concave upwards in shape with a rapidly decreasing velocity at small forces, and a more slowly decreasing velocity at higher forces. We note that the underlying assumptions of the elastic gel model differ significantly from ours. First, their model assumes that the comet tail is a continuum elastic medium, whereas our comet tail is not cross-linked. Second, our self-diffusiophoretic mechanism suggests that the main physics lies in the concentration gradient just behind the moving surface, and not in the competition between compressive and tensile stresses near the bead surface. Indeed, tensile stresses are completely absent in our simulations because we have not included binding of filaments to the surface.
It has been found, in all cases so far checked, be it a bacterium, a bead, or a cell, that the actin filaments are bound to the surface; one might therefore object that our neglect of such binding is unjustified. We disagree with this view since an effective way to determine whether attachment to the surface is essential is to leave it out and study, theoretically, what difference it makes. Certainly, filament binding is essential to several properties of actin-driven motility. For example, binding to the surface may play an important role in setting the overall magnitude of the velocity at small loads, V0 (34,35). Finite element simulations (A. Gopinathan and A. J. Liu, unpublished) suggest that V0 decreases with increasing filament binding energy, in accord with experiments by Co et al. (35). As noted by the Noireaux et al. (3) and Bernheim-Groswasser et al. (30), filament binding is also critical to phenomena such as hopping, and the competition between compressive and tensile stresses is particularly interesting for curved surfaces (10). Nevertheless, our results suggest that filament binding is not crucial for all aspects of motility. As noted in Lee and Liu (12), we obtain the correct dependence on Arp2/3 concentration and other protein concentrations, even without including filament binding to the surface. Here, we have further shown that filament binding does not seem to be essential for understanding the shape of the force-velocity relation. Further calculations (E. Banigan and A. J. Liu, unpublished) are currently underway to elucidate what the effects of filament binding on the force-velocity relation may be.
Comparison with experiments
Experimental results for the force-velocity relation are rather confusing, with different experiments yielding apparently contradictory results. Here we sift through the various experiments to construct a rationale for reconciling the different results, and to speculate on why our results agree or disagree with each one.
We preface our discussion with three remarks concerning the comparison of our results with experiments.
First, we note that our calculated stall pressure is ∼0.1 nN/μm2, in reasonable agreement with experimental measurements. Marcy et al. (15) and Parekh et al. (1) both find Pstall ≈ 1 nN/μm2. Indeed, there seems to be a consensus in experiments that the stall force lies somewhere in the nN range for micron-sized moving objects. The agreement between our simulation and the experiments is not fortuitous. We have adjusted the net polymerization rate to be comparable to the experimental one, so that the F-actin concentration behind the moving surface is realistic (in the mM range) (12). In addition, the persistence length in our simulations, although smaller than the true value, is still large compared to the mesh size of the network (of approximately tens of nanometers in our simulations and in experiments). As a result, the mechanical properties of the branched structure near the surface are likely to be reasonably close to the experimental ones.
Second, we note that the results for different disk sizes and disk drag coefficients collapse onto a single scaled force-velocity plot, when the force is scaled by the stall force and the velocity is scaled by its zero-load value. This scaling collapse was discovered by Parekh et al. (1) in experiments, and should be viewed as an important property of the force-velocity relation.
Third, we emphasize that our model does not contain cross-linking proteins. One might therefore expect our results to agree better with experiments on purified proteins than with those carried out on cell extracts, which contain cross-linking and bundling proteins. We note, however, that experiments with purified proteins found that the addition of cross-linkers did not affect the speed (38).
The experimental literature on the force-velocity relation shows that there are large discrepancies from experiment to experiment. For example, our calculations suggest that the velocity should remain constant up to a force of F∗ ≈ 0.5Fstall. This would then yield F∗ in the nN range, similar to the stall force, for micron-sized objects. These results are consistent with experimental findings of Wiesner et al. (14) for polystyrene beads in purified protein solutions with added methylcellulose to increase the viscosity. There, they observed that the velocity was nearly flat at least up to 50 pN. However, McGrath et al. (17) found F∗ ≈ 10 pN in cell extracts with added methylcellulose. Moreover, Cameron et al. (18), found a nonmonotonic dependence on bead size, or equivalently, a nonconstant dependence on load force in the 10–100 fN range, suggesting F∗ < 10 fN.
One possible explanation for the discrepancy between the results of Wiesner et al. (14) with the experiments of McGrath et al. (17) and Cameron et al. (18) is that the latter two experiments may be more strongly biased by spontaneous symmetry-breaking. In all three experiments, only beads that successfully break symmetry and continue moving are tallied. The factors that affect symmetry-breaking are still not clear. Bead size is certainly an important factor, since the rate of spontaneous symmetry-breaking appears to decrease rather strongly with increasing bead size (18). One example of a possible source of bias is that large coated beads might only succeed in breaking symmetry if they are coated with particularly sparse actin networks; this would bias the results toward lower speeds for larger beads. We note that spontaneous symmetry breaking appears to be more difficult in cell extracts than in systems with purified proteins (14), possibly due to cross-linking and bundling proteins. Thus, artifacts due to symmetry-breaking might be more pronounced for cell extracts than for purified proteins. This might explain why our results agree better with those of Wiesner et al. (14) than with those of McGrath et al. (17) or Cameron et al. (18).
Our results are also inconsistent with experiments by Shaevitz and Fletcher (16), who varied viscosity as a function of position by confining the system between two plates. They measured velocity as a function of height and found that the velocity was reduced by 36% even at a fair distance from the walls, where the viscosity gave rise to a load force of only 20 fN. This extraordinary sensitivity was attributed to the importance of Brownian fluctuations of the bead. An alternate possibility is that attraction of cross-linked actin filaments in solution to the confining surfaces in the cell extracts might have given rise to a network near the surface that is unrelated to the actin comet tail but that impedes motion of the bead.
In an interesting set of experiments by Paluch et al. (19) on purified proteins, the dependence on bead size was measured as a function of gelsolin concentration. Paluch et al. (19) found that the velocity is independent of bead size at high gelsolin concentration, but not at low gelsolin concentration. Thus, F∗ would appear to increase with gelsolin concentration. This is consistent with our expectation. It is known that increasing the concentration of gelsolin, which severs and caps F-actin (39), decreases the branch spacing in the actin comet tail (14). This is probably due to the capping activity of gelsolin, since it is known that capping can enhance the branching rate (14,40–42). As a result, the mesh size should decrease with increasing gelsolin, leading to an increase in the Young's modulus of the network and hence an increase in the stall force and F∗.
Since our results appear to agree reasonably well with experiments on purified proteins in which load force is varied by increasing viscosity or bead size, it seems disturbing that our force-velocity relation has an entirely different shape from that measured by Marcy et al. (15) for purified protein systems. We note, however, that near v = 0 there is considerable scatter in the experimental data at forces between 0 and 1.5 nN. A flat velocity is not inconsistent with their data in that regime, so our results may be consistent with theirs there. At higher forces, however, there is definitely a discrepancy between our results and theirs. This discrepancy could arise from the geometry of the experiment, in which the velocity was applied by pulling on the tail. This pulling force could modify the concentration gradient near the surface, especially for large pulling forces or speeds. To simulate their experiment, we would need to add cross-linking proteins to our simulations and apply forces to the depolymerizing end of the tail.
Finally, we note again that our results are in good agreement with those of Parekh et al. (1), as shown in Fig. 4 b, even though these experiments are performed in cell extracts. However, these experiments cannot be biased by spontaneous symmetry-breaking because the symmetry is broken by the geometry of the experiment. This may explain why their observations agree well with our simulations.
It is important to point out, however, that one aspect of the experiments of Parekh et al. does not agree with our simulations. In those experiments, the velocity depended not only on the load force but also on the load force history. The velocity was higher if the load force approached a given value from above than if it approached the value from below. We do not find any such hysteresis; our results depend only on the load. One possible reason is that load history dependence arises when cross-linking or bundling proteins are present to lock in the structure and density of the actin comet tail. Alternatively, recent experiments suggest that the persistence length of actin may increase upon compression (43), so that actin filaments are stiffer when a given compression is approached from above than from below. Our results in Fig. 6 show that the speed increases with bending stiffness. If we combine these results with those of Greene et al. (43), this would suggest that the speed would be higher if a given load was approached from above than below, consistent with the results of Parekh et al. (1).
Suggestions for future experiments
If our interpretation of previous experimental results is correct, then it is of paramount importance to measure the force-velocity relation in experimental systems that are designed to be asymmetric. In this way, one can avoid bias in the results due to the need to break symmetry. One possibility is to use Janus beads, which are coated only on one side with ActA or N-WASP. One article reports experiments on Janus beads (2), with the finding that 1-μm Janus beads moved at the same rate as smaller symmetrically coated beads, consistent with our interpretation, but that 2-μm beads moved at somewhat slower rates. It is not clear from Cameron et al. (2) whether the difference between the speeds of 2 μm and 1 μm beads lies within experimental error.
A second way to use geometry to break symmetry is to form dimers by grafting small ActA or N-WASP coated beads to uncoated beads of various sizes via strong bonds, such as streptavidin/biotin links. This system would clearly be asymmetric by design. For these bead dimers, the drag force would be determined by the diameter of both beads, whereas the stall pressure would depend only on the diameter of the coated bead. A systematic study of bead dimers, as a function of the diameters of the two beads and solution viscosity, would be very valuable in clearing up the discrepancies between the various reported experiments and for testing our predictions.
Acknowledgments
We thank M. Goulian, T. C. Lubensky, and D. J. Pine for valuable discussions. We also thank the editor and the referees, whose comments significantly strengthened the article.
The support of the National Science Foundation through grant No. DMR-0605044 and the UPenn Materials Research Science and Engineering Center, grant No. DMR-0520020, is gratefully acknowledged.
References
- 1.Parekh S.H., Chaudhuri O., Theriot J.A., Fletcher D.A. Loading history determines the velocity of actin-network growth. Nat. Cell Biol. 2005;7:1219–1223. doi: 10.1038/ncb1336. [DOI] [PubMed] [Google Scholar]
- 2.Cameron L.A., Footer M.J., van Oudenaarden A., Theriot J.A. Motility of ActA protein-coated microspheres driven by actin polymerization. Proc. Natl. Acad. Sci. USA. 1999;96:4908–4913. doi: 10.1073/pnas.96.9.4908. [DOI] [PMC free article] [PubMed] [Google Scholar]
- 3.Noireaux V., Golsteyn M., Friederich E., Prost J., Antony C. Growing an actin gel on spherical surfaces. Biophys. J. 2000;78:1643–1654. doi: 10.1016/S0006-3495(00)76716-6. [DOI] [PMC free article] [PubMed] [Google Scholar]
- 4.Schwartz I.M., Ehrenberg M., Bindshcadler M., McGrath J.M. The role of substrate curvature in actin-based pushing forces. Curr. Biol. 2004;14:1094–1098. doi: 10.1016/j.cub.2004.06.023. [DOI] [PubMed] [Google Scholar]
- 5.Upadhyaya A., Chabot J.R., Andreeva A., Samadani A., van Oudenaarden A. Probing polymerization forces by using actin-propelled lipid vesicles. Proc. Natl. Acad. Sci. USA. 2003;100:4521–4526. doi: 10.1073/pnas.0837027100. [DOI] [PMC free article] [PubMed] [Google Scholar]
- 6.Giardini P.A., Fletcher D.A., Theriot J.A. Compression forces generated by actin comet tails on lipid vesicles. Proc. Natl. Acad. Sci. USA. 2003;100:6493–6498. doi: 10.1073/pnas.1031670100. [DOI] [PMC free article] [PubMed] [Google Scholar]
- 7.Boukellal H., Campas O., Joanny J.-F., Prost J., Sykes C. Soft Listeria: actin-based propulsion of liquid drops. Phys. Rev. E Stat. Nonlin. Soft Matter Phys. 2004;69:061906. doi: 10.1103/PhysRevE.69.061906. [DOI] [PubMed] [Google Scholar]
- 8.Mogilner A., Oster G.F. Cell motility driven by actin polymerization. Biophys. J. 1996;71:3030–3045. doi: 10.1016/S0006-3495(96)79496-1. [DOI] [PMC free article] [PubMed] [Google Scholar]
- 9.Mogilner A., Oster G.F. Force generation by actin polymerization II: the elastic ratchet and tethered filaments. Biophys. J. 2003;84:1591–1605. doi: 10.1016/S0006-3495(03)74969-8. [DOI] [PMC free article] [PubMed] [Google Scholar]
- 10.Gerbal F., Chaikin P., Rabin Y., Prost J. An elastic analysis of Listeria monocytogenes propulsion. Biophys. J. 2000;79:2259–2275. doi: 10.1016/S0006-3495(00)76473-3. [DOI] [PMC free article] [PubMed] [Google Scholar]
- 11.Dickinson R.B., Caro L., Purich D.L. Force generation by cytoskeletal filament end-tracking proteins. Biophys. J. 2004;87:2838–2854. doi: 10.1529/biophysj.104.045211. [DOI] [PMC free article] [PubMed] [Google Scholar]
- 12.Lee K.-C., Liu A.J. New proposed mechanism of actin-polymerization-driven motility. Biophys. J. 2008;95:4529–4539. doi: 10.1529/biophysj.108.134783. [DOI] [PMC free article] [PubMed] [Google Scholar]
- 13.Prass M., Jacobson K., Mogilner A., Radmacher M. Direct measurement of the lamellipodial protrusive force in a migrating cell. J. Cell Biol. 2006;174:767–772. doi: 10.1083/jcb.200601159. [DOI] [PMC free article] [PubMed] [Google Scholar]
- 14.Wiesner S., Helfer E., Didry D., Ducouret G., Lafuma F. A biomimetic motility assay provides insight into the mechanism of actin-based motility. J. Cell Biol. 2003;160:387–398. doi: 10.1083/jcb.200207148. [DOI] [PMC free article] [PubMed] [Google Scholar]
- 15.Marcy Y., Prost J., Carlier M.-F., Sykes C. Forces generated during actin-based propulsion: a direct measurement by micromanipulation. Proc. Natl. Acad. Sci. USA. 2004;101:5992–5997. doi: 10.1073/pnas.0307704101. [DOI] [PMC free article] [PubMed] [Google Scholar]
- 16.Shaevitz J.W., Fletcher D.A. Load fluctuations drive actin network growth. Proc. Natl. Acad. Sci. USA. 2007;104:15688–15692. doi: 10.1073/pnas.0702601104. [DOI] [PMC free article] [PubMed] [Google Scholar]
- 17.McGrath J.L., Eungdamrong N.J., Fisher C.I., Peng F., Mahadevan L. The force-velocity relationship for the actin-based motility of Listeria monocytogenes. Curr. Biol. 2003;13:329–332. doi: 10.1016/s0960-9822(03)00051-4. [DOI] [PubMed] [Google Scholar]
- 18.Cameron L.A., Robbins J.R., Footer M.J., Theriot J.A. Biophysical parameters influence actin-based movement, trajectory, and initiation in a cell-free system. Mol. Biol. Cell. 2004;15:2312–2323. doi: 10.1091/mbc.E03-12-0913. [DOI] [PMC free article] [PubMed] [Google Scholar]
- 19.Paluch E., van der Gucht J., Joanny J.-F., Sykes C. Deformations in actin comets from rocketing beads. Biophys. J. 2006;91:3113–3122. doi: 10.1529/biophysj.106.088054. [DOI] [PMC free article] [PubMed] [Google Scholar]
- 20.Mogilner A. On the edge: modeling protrusion. Curr. Opin. Cell Biol. 2006;18:32–39. doi: 10.1016/j.ceb.2005.11.001. [DOI] [PubMed] [Google Scholar]
- 21.Carlsson A.E. Growth of branched actin networks against obstacles. Biophys. J. 2001;81:1907–1923. doi: 10.1016/S0006-3495(01)75842-0. [DOI] [PMC free article] [PubMed] [Google Scholar]
- 22.Carlsson A.E. Growth velocities of branched actin networks. Biophys. J. 2003;84:2907–2918. doi: 10.1016/S0006-3495(03)70018-6. [DOI] [PMC free article] [PubMed] [Google Scholar]
- 23.Anderson J.L. Colloid transport by interfacial forces. Annu. Rev. Fluid Mech. 1989;21:61–99. [Google Scholar]
- 24.Golestanian R., Liverpool T.B., Ajdari A. Propulsion of a molecular machine by asymmetric distribution of reaction products. Phys. Rev. Lett. 2005;94:220801. doi: 10.1103/PhysRevLett.94.220801. [DOI] [PubMed] [Google Scholar]
- 25.Allen M.P., Tildesley D.J. Oxford University Press; Oxford, UK: 1987. Computer Simulation of Liquids. [Google Scholar]
- 26.Pollard T.D., Blanchoin L., Mullins R.D. Molecular mechanisms controlling actin filament dynamics in nonmuscle cell. Annu. Rev. Biophys. Biomol. Struct. 2000;29:545–576. doi: 10.1146/annurev.biophys.29.1.545. [DOI] [PubMed] [Google Scholar]
- 27.Pollard T.D., Borisy G.G. Cellular motility driven by assembly and disassembly of actin filaments. Cell. 2003;112:453–465. doi: 10.1016/s0092-8674(03)00120-x. [DOI] [PubMed] [Google Scholar]
- 28.Bernheim-Groswasser A., Wiesner S., Golsteyn R.M., Carlier M.-F., Sykes C. The dynamics of actin-based motility depend on surface parameters. Nature. 2002;417:308–311. doi: 10.1038/417308a. [DOI] [PubMed] [Google Scholar]
- 29.Kuo S.C., McGrath J.L. Steps and fluctuations of Listeria monocytogenes during actin-based motility. Nature. 2000;407:1026–1029. doi: 10.1038/35039544. [DOI] [PubMed] [Google Scholar]
- 30.Bernheim-Groswasser A., Prost J., Sykes C. Mechanism of actin-based motility: a dynamic state diagram. Biophys. J. 2005;89:1411–1419. doi: 10.1529/biophysj.104.055822. [DOI] [PMC free article] [PubMed] [Google Scholar]
- 31.Gerbal F., Laurent V., Ott A., Carlier M.-F., Chaikin P. Measurement of the elasticity of the actin tail of Listeria monocytogenes. Eur. Biophys. J. 2000;29:134–140. doi: 10.1007/s002490050258. [DOI] [PubMed] [Google Scholar]
- 32.Frey, E., K. Kroy, and J. Wilhelm. 1998. Physics of solutions and networks of semiflexible macromolecules and the control of cell function. ArXiv:cond-mat/9808022.
- 33.Gardel M.L., Shin J.H., MacKintosh F.C., Mahadevan L., Matsudaira P. Elastic behavior of cross-linked and bundled actin networks. Science. 2004;304:1301–1305. doi: 10.1126/science.1095087. [DOI] [PubMed] [Google Scholar]
- 34.Soo F.S., Theriot J.A. Adhesion controls bacterial actin polymerization-based movement. Proc. Natl. Acad. Sci. USA. 2005;102:16233–16238. doi: 10.1073/pnas.0507022102. [DOI] [PMC free article] [PubMed] [Google Scholar]
- 35.Co C., Wong D.T., Gierke S., Chang V., Taunton J. Mechanism of actin network attachment to moving membranes: barbed end capture by N-WASP WH2 domains. Cell. 2007;128:901–913. doi: 10.1016/j.cell.2006.12.049. [DOI] [PMC free article] [PubMed] [Google Scholar]
- 36.Reference deleted in proof.
- 37.Reference deleted in proof.
- 38.Loisel T.P., Boujemaa R., Pantaloni D., Carlier M.-F. Reconstitution of actin-based motility of Listeria and Shigella using pure proteins. Nature. 1999;401:613–616. doi: 10.1038/44183. [DOI] [PubMed] [Google Scholar]
- 39.Cooper J.A., Schafer D.A. Control of actin assembly and disassembly at filament ends. Curr. Opin. Cell Biol. 2000;12:97–103. doi: 10.1016/s0955-0674(99)00062-9. [DOI] [PubMed] [Google Scholar]
- 40.Gopinathan A., Lee K.-C., Schwarz J.M., Liu A.J. Branching, capping, and severing in dynamic actin structures. Phys. Rev. Lett. 2007;99:058103. doi: 10.1103/PhysRevLett.99.058103. [DOI] [PubMed] [Google Scholar]
- 41.Carlsson A.E. Structure of autocatalytically branched actin solutions. Phys. Rev. Lett. 2004;92:238102. doi: 10.1103/PhysRevLett.92.238102. [DOI] [PubMed] [Google Scholar]
- 42.Akin O., Mullins R.D. Capping protein increases the rate of actin-based motility by promoting filament nucleation by the Arp2/3 complex. Cell. 2008;133:841–851. doi: 10.1016/j.cell.2008.04.011. [DOI] [PMC free article] [PubMed] [Google Scholar]
- 43.Greene G.W., Anderson T.H., Zeng H., Zappone B., Israelachvilli J.N. Force amplification response of actin filaments under confined compression. Proc. Natl. Acad. Sci. USA. 2009;106:445–449. doi: 10.1073/pnas.0812064106. [DOI] [PMC free article] [PubMed] [Google Scholar]
- 44.Kas J., Strey H., Barmann M., Sackmann E. Direct measurement of the wave-vector-dependent bending stiffness of freely flickering actin filaments. Europhys. Lett. 1993;21:865–870. [Google Scholar]
- 45.Gittes F., Mickey B., Nettleton J., Howard J. Flexural rigidity of microtubules and actin filaments measured from thermal fluctuations in shape. J. Cell Biol. 1993;120:923–934. doi: 10.1083/jcb.120.4.923. [DOI] [PMC free article] [PubMed] [Google Scholar]
- 46.Kas J., Strey H., Tang J., Finger B., Ezzel R. F-actin: a model polymer for semi-flexible chains in dilute, semi-dilute, and liquid crystalline solutions. Biophys. J. 1996;70:609–625. doi: 10.1016/S0006-3495(96)79630-3. [DOI] [PMC free article] [PubMed] [Google Scholar]
- 47.Isambert H., Venier P., Maggs A., Fattoum A., Kassab R. Flexibility of actin filaments derived from thermal fluctuations. Effect of bound nucleotide, phalloidin, and muscle regulatory proteins. J. Biol. Chem. 1995;270:11437–11444. doi: 10.1074/jbc.270.19.11437. [DOI] [PubMed] [Google Scholar]
- 48.Gotter R., Kroy K., Frey E., Barmann M. Dynamic light scattering from semidilute actin solutions—a study of hydrodynamic screening, filament bending stiffness, and the effect of tropomyosin/troponin binding. Macromolecules. 1996;29:30–36. [Google Scholar]
- 49.Bailly M., Macaluso F., Cammer M., Chan A., Segall J.E. Relationship between Arp2/3 complex and the barbed ends of actin filaments at the leading edge of carcinoma cells after epidermal growth factor stimulation. J. Cell Biol. 1999;145:331–345. doi: 10.1083/jcb.145.2.331. [DOI] [PMC free article] [PubMed] [Google Scholar]
- 50.Podolski J.L., Steck T.L. Length distribution of F-actin in Dictyostelium discoideum. J. Biol. Chem. 1990;265:1312–1318. [PubMed] [Google Scholar]
- 51.Blanchoin L., Pollard T.D., Mullins R.D. Interactions of ADF/Cofilin, Arp2/3 complex, capping protein and profilin in modeling of branched actin filament networks. Curr. Biol. 2000;10:1273–1282. doi: 10.1016/s0960-9822(00)00749-1. [DOI] [PubMed] [Google Scholar]
- 52.Carlsson A.E., Wear M.A., Cooper J.A. End versus side branching by Arp2/3 complex. Biophys. J. 2004;86:1074–1081. doi: 10.1016/S0006-3495(04)74182-X. [DOI] [PMC free article] [PubMed] [Google Scholar]