

Abstract
The 5-HT3A receptor is a member of the Cys-loop family of ligand-gated ion channels. To perform kinetic analysis, we mutated the 5-HT3A subunit to obtain a high-conductance form so that single-channel currents can be detected. At all 5-HT concentrations (>0.1 μM), channel activity appears as openings in quick succession that form bursts, which coalesce into clusters. By combining single-channel and macroscopic data, we generated a kinetic model that perfectly describes activation, deactivation, and desensitization. The model shows that full activation arises from receptors with three molecules of agonist bound. It reveals an earlier conformational change of the fully liganded receptor that occurs while the channel is still closed. From this pre-open closed state, the receptor enters into an open-closed cycle involving three open states, which form the cluster whose duration parallels the time constant of desensitization. A similar model lacking the pre-open closed state can describe the data only if the opening rates are fixed to account for the slow activation rate. The application of the model to M4 mutant receptors shows that position 10′ contributes to channel opening and closing rates. Thus, our kinetic model provides a foundation for understanding structural bases of activation and drug action.
Introduction
Cys-loop receptors are pentameric neurotransmitter-activated ion channels that mediate fast synaptic transmission throughout the nervous system. They include excitatory receptors, nicotinic acetylcholine (ACh) and serotonin type 3 receptors (5-HT3), and inhibitory receptors activated by GABA or glycine (1,2).
The 5-HT3 receptor modulates behavioral functions, including cognition, anxiety, and depression, and plays a role in alcohol addiction and inflammatory pain (3,4). It is also an important target for antiemetic drugs. Despite its potential therapeutic value, molecular characterization of this receptor has lagged behind.
To date, five different 5-HT3 subunits (A–E) are known in humans, and all subunits show splice variants (5–9). Only 5-HT3A subunits are able to form functional homomeric channels in heterologous expression systems and probably in native cells (7,10,11). Cotransfection studies have shown that the B subunit changes the properties of the macroscopic currents, the C and E subunits change the amplitude, and the D subunit does not affect the responses with respect to homomeric receptors (7).
Cys-loop receptor subunits contain an extracellular domain and a transmembrane region composed of four transmembrane segments (M1–M4). The intracellular loop between M3 and M4 contains three arginine residues that are responsible for the low conductance of 5-HT3A receptors (12). The replacement of these residues by the equivalent ones in the human 5-HT3B subunit (glutamine, aspartic acid, and alanine) gives rise to the high-conductance form of the homomeric 5-HT3A receptor, in which single-channel currents can be detected (12,13). Removal of the entire M3-M4 loop affects single-channel conductance but does not have a significant effect on gating kinetics (14).
Few studies have reported models that describe activation and desensitization of 5-HT3A receptors (15–17). Due to its low conductance, these studies have been restricted to the macroscopic level. We performed, for the first time that we know of, single-channel kinetic analysis of the high-conductance form of the 5-HT3A receptor that allowed us to generate a model that describes binding, gating, and desensitization. Our results are, in general, in agreement with those obtained from the analysis of macroscopic responses (17), but reveal conformational states that cannot be resolved at the macroscopic level and provide a detailed mechanism of channel activation. The kinetic model that better describes the experimental data includes a conformational change of the fully liganded receptor to an activatable state while the channel is still shut. This priming step has been recently proposed for activation of glycine and nicotinic ACh receptors (18–20). A similar model that lacks the pre-open closed state can describe the data only if the opening rates are constrained to account for the slow activation rate.
The application of the model to determine kinetic changes in M4 mutant receptors shows that a highly conserved residue at position 10′ of M4 contributes to the opening and closing rates. Thus, our kinetic model provides a foundation for studying structure-function relationships, as well as molecular mechanisms of drug action, in 5-HT3 receptors.
Methods
Site-directed mutagenesis and expression of high-conductance 5-HT3A receptors
The high-conductance form (HC) of mouse 5-HT3A was obtained by mutating three arginine residues responsible for low conductance (12). Point mutations were carried out using the Quik Change kit (Stratagene, La Jolla, CA) and were confirmed by sequencing. BOSC 23 cells (CRL-11270, ATCC, Manassas, VA) were transfected with high-conductance forms of control and mutant 5-HT3A cDNAs. A plasmid encoding green fluorescent protein was also included to allow identification of transfected cells.
Patch-clamp recordings
Single-channel currents were recorded in the cell-attached configuration at 20°C as described before (21). The bath and pipette solutions contained 142 mM KCl, 5.4 mM NaCl, 0.2 mM CaCl2, and 10 mM HEPES (pH 7.4). Open- and closed-time histograms were plotted using the program TACFit (Bruxton, Seattle, WA). Bursts and clusters of channel openings were identified as a series of closely separated openings (more than five) preceded and followed by closings longer than a critical duration. The critical time was taken as the point of intersection of the second and third components in the closed-time histogram for bursts (τcb), and of the third closed component and the succeeding one for clusters (τcc) (21). Open probability within clusters (Popen) was determined by calculating the mean fraction of time that the channel is open within a cluster.
Macroscopic currents were recorded in the outside-out patch configuration (22,23). The pipette solution contained 134 mM KCl, 5 mM EGTA, 1 mM MgCl2, and 10 mM HEPES (pH 7.3). The extracellular solution (ECS) contained 150 mM NaCl, 0.5 mM CaCl2, and 10 mM HEPES (pH 7.4). The solution exchange time was estimated by the open pipette and varied between 0.1 and 1 ms (13,22). Macroscopic currents were filtered at 5 kHz and analyzed using the IgorPro software (WaveMetrics, Lake Oswego, OR) (13,21,22).
EC50 and the Hill coefficient were obtained from the Hill equation,
| (1) |
where I is the peak current at a given 5-HT concentration (L), and nH is the Hill coefficient.
Currents were fitted by the exponential function
| (2) |
where I0 and I∞ are the peak and steady-state current values, respectively, and τd is the decay time constant. At concentrations >5 μM, decays were fitted by two exponential components (16).
To measure recovery from desensitization, pulses of 5-HT 1.5 s in duration were first applied to outside-out patches. After removal of the agonist, a second pulse was applied at delays from 0.6 to 16 s. The fractional recovery of the current elicited by the second 5-HT pulse was plotted against the interpulse interval. The sigmoid curve was fitted to the van Hooft equation (24),
| (3) |
where τr is the recovery time constant, and n approximates the number of agonist concentration-dependent steps from the desensitized to the resting state. Each constant value is expressed as the mean ± SE.
Kinetic analysis
For kinetic modeling, clusters were selected on the basis of their distribution of mean open duration and open probability (21). Typically, >80% of the clusters were selected. The resulting open and closed intervals, from single patches at several 5-HT concentrations, were analyzed according to a kinetic scheme using the QuB software (25) (QuB suite, www.qub.buffalo.edu, State University of New York, Buffalo, NY), as described previously (26). The dead time was 25–30 μs. The model and the estimated rates were accepted only if the resulting probability density functions correctly fitted the experimental open- and closed-duration histograms. Estimation of rate constants from macroscopic currents was performed with QuB software. Agonist association and dissociation rate constants were estimated by using the MAC program included in the QuB package. To determine the number of agonist binding steps, we changed the number of binding steps in the scheme from one to five. The program varies the free parameters to fit the experimental current until it reaches the minimum sum of square error (SSE).
Simulations of single-channel and macroscopic currents were performed using QuB software based on the proposed model and using the rate constants for desensitization and recovery from desensitization determined experimentally.
Statistical comparisons were performed with the Student's t-test.
Results
Kinetics of 5-HT3A receptors activated by serotonin
Single-channel currents of the high-conductance form of 5-HT3A receptors
The 5-HT3A subunit forms homopentameric receptors, but the single-channel conductance is too low to be detected. To overcome this, we introduced point mutations and obtained the HC form of the 5-HT3A receptor, which allows analysis at the single-channel level (12,13).
In the presence of 5-HT concentrations >0.1 μM, single-channel currents of 4.7 ± 0.4 pA at −70 mV are readily detected in cell-attached patches from cells transfected with the 5-HT3A(HC) subunit (Fig. 1 a). As reported previously (27), we also observed a minor proportion of lower-conductance events (∼2.4 pA at −70 mV), but these were discarded for the analysis.
Figure 1.
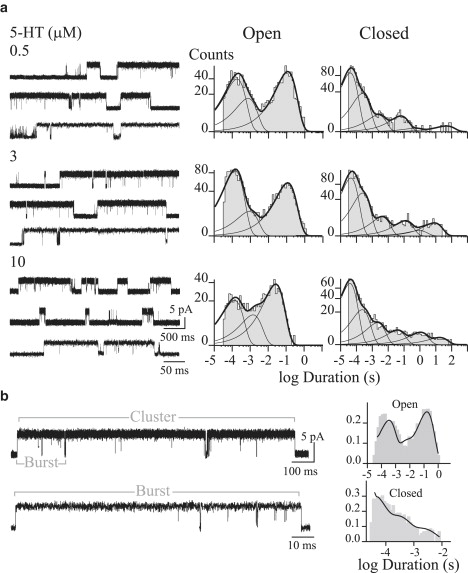
Single-channel currents through 5-HT3A(HC) receptors. (a) Single channels from cell-attached patches. Open- and closed-duration histograms were constructed with data from the entire recording, before cluster selection. (b) A representative cluster and a burst (higher time resolution for the burst) are shown. Experimental open- and closed-time histograms with the fit by Scheme 1 b superimposed (solid lines). Histograms were constructed with the selected clusters. Ordinates correspond to the square root of the fraction of events per bin. Currents are displayed at 9 kHz bandwidth, with channel openings shown as upward deflections. Membrane potential, −70 mV.
At all agonist concentrations, channel activity appears mainly as opening events in quick succession forming bursts, which in turn coalesce into long clusters (Fig. 1 and Fig. S1 in the Supporting Material, and Bouzat et al. (13)).
We could not detect spontaneous single-channel activity (10 patches from cells showing activity in the presence of 5-HT), indicating that the frequency of spontaneous opening is extremely low (28). We then increased 5-HT concentrations to 50 nM, 80 nM, and 100 nM. Only in the latter condition were we able to detect reliable channel activity. However, only 25% of patches from transfected cells showed significant channel activity during the course of the recording.
Open-time histograms from the entire recording show three components at all 5-HT concentrations, whose durations are ∼100 ms (OL), ∼2.5 ms (OI), and ∼150 μs (OB) (Fig. 1 and Table S1). The duration of the slowest component (OL) is constant at concentrations <5 μM, but it shows a concentration-dependent decrease at higher concentrations (Fig. 1 a and Table S1). Such a decrease can be explained by open-channel block produced by the agonist (see below and Fig. S2).
Closed-time histograms show five to six components (Fig. 1 and Table S1). The duration and relative areas of the three briefest components are constant at 0.1–10 μM 5-HT and correspond to closings within clusters (CL ∼ 3 ms, CI ∼ 0.3 ms, and CB ∼ 50 μs) (Fig. 1 a and Table S1). The other closed components are variable among different recordings at the same agonist concentration and depend on the number of channels in the patch. No clear dependence on 5-HT concentration could be determined for closings within clusters, similar to the findings for α7 (13), and for the chimeric α7-5HT3A receptor (21).
Because 5-HT3A(HC) receptors activate in clear clusters, we studied open- and closed-time distributions within clusters. To this end, we selected kinetically homogeneous clusters and analyzed their open and closed dwell times. Open-time histograms obtained from the analysis of the selected clusters show the same three components as described from the analysis of the entire recording (Table S1), but the relative area of the briefest open component is smaller. This observation suggests that long openings mainly occur within clusters, given that isolated brief openings were excluded during the selection. Closed-time histograms are fitted by three exponentials whose mean values are similar to those described in the analysis of the whole recording (Table S1). Again, the durations of these components remain constant at all agonist concentrations. The probability of channel opening within the selected clusters (Popen) does not change with agonist concentration and it is >0.90 even at the minimum concentration that allows channel detection. Popen values are: 0.996 ± 0.002, 0.995 ± 0.002, 0.997 ± 0.001, and 0.973 ± 0.012 for 0.1, 1, 3, and 10 μM 5-HT, respectively.
The mean cluster duration is ∼1.5 s for 0.1–5 μM 5-HT. It decreases at concentrations >5 μM, probably due to channel block (Table S1).
Channel block by serotonin
The duration of the slowest open component remains constant at 5-HT concentrations <5 μM, but at higher concentrations it decreases linearly as a function of concentration (Table S1 and Fig. S2). On the basis of the linear blocking scheme (29) (Fig. S2), the value determined for the forward blocking rate (k+b) is 1.3 ± 0.07 × 10⁶ M−1 s−1. Channel block of the 5-HT3 pore by 5-HT was confirmed by evaluating the effect of 5-HT on a chimeric receptor composed of α7 in the extracellular domain and 5-HT3A in the transmembrane region (13). The mean duration of the slowest component of channels activated by 500 μM ACh decreases eightfold in the presence of 100 μM 5-HT (13). The value for k+b is ∼1.2 × 10⁶ M−1 s−1, similar to that calculated for block of the 5-HT3A receptor. Closed-time histograms of the α7-5HT3A chimera in the presence of 5-HT show a component of ∼15 μs, whose area increases with the increase of 5-HT (from 0.30 at 10 μM 5-HT to 0.84 at 100 μM 5-HT). Therefore, the inverse of the mean time of this closed component was used as an estimation of the unblocking rate in the full scheme (k−bf = 60,000 s−1).
A decrease in the cluster duration is observed at 5-HT concentrations ≥5 μM (Table S1). This observation suggests that in addition to fast open-channel block, slow channel block takes place at 5-HT concentrations >5 μM. Alternatively, concentration-dependent desensitization may take place. Because distinguishing between these two mechanisms is not possible, we restricted the kinetic analysis of single channels to 5-HT concentrations <5 μM.
Macroscopic currents elicited by 5-HT
Macroscopic currents are elicited when 5-HT is applied to outside-out patches from cells expressing the HC form of 5-HT3A receptors (Fig. 2 a). Expressing the peak current as a function of serotonin concentration results in an EC50 of 2.7 ± 0.5 μM (nH = 1.8 ± 0.3) (Fig. S3 a). Decays are well fitted by a single component at low concentrations (1–5 μM) and by two exponential components at higher 5-HT concentrations (Fig. 2 a and (13,30)). At saturating agonist concentrations the inverse of the rise time of macroscopic currents should approach the activation rate. At 100 μM 5-HT, the rise time (tr 20–80%) is 3.9 ± 1.3 ms, which corresponds to an activation rate of ∼300 s−1.
Figure 2.
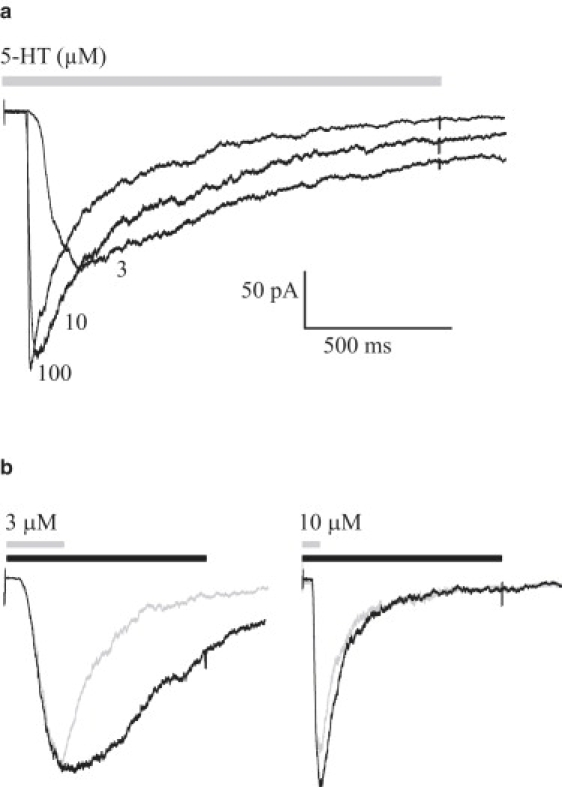
Macroscopic currents from 5-HT3A(HC) receptors. (a) Outside-out currents evoked by the indicated 5-HT concentration (1.5-s pulse). (b) Outside-out currents elicited by a brief pulse of agonist that shows decay by deactivation (gray) and a longer pulse that shows decay by desensitization (black) at 3 and 10 μM 5-HT.
After a long-duration 5-HT pulse (1.5 s), which allows the current to decay by desensitization, the decay time constants are 1136 ± 576 ms (n = 15) for currents activated by 3 μM 5-HT, and τslow = 940 ± 400 ms (∼30%) and τfast = 150 ± 30 ms (∼70%) (n = 35) for 10 μM 5-HT. To avoid channel block, we determined the desensitization rate at concentrations higher than the EC50 but below saturation. Thus, the estimated rate may represent a lower bound. However, current decays at a high 5-HT concentration (>50 μM) show two exponential components, the slowest of which is only twofold faster than that at 3 μM 5-HT.
If 5-HT is applied to outside-out patches during a pulse briefer than that used for measuring desensitization (300 ms for 3 μM and 80 ms for 10 μM 5-HT), the current decays after the agonist removal due to deactivation (Fig. 2 b). At 3 μM 5-HT the deactivation phase is best fitted by a single-exponential, and the decay time constant is slightly briefer than that obtained after a desensitizing pulse (310 ± 110 ms). At 10 μM 5-HT, the time course of the decay was best fitted by a double exponential with time constants similar to those of desensitization (τslow = 460 ± 150 and τfast = 130 ± 80 ms) (Fig. 2 b). These results show that desensitization is a principal pathway for response termination, in agreement with previous reports (13,17).
Single-channel kinetic analysis of 5-HT3A clusters
To analyze the kinetics of channel activation, closed and open intervals of the selected clusters were fitted to kinetic schemes. Cluster duration, as well as open and closed durations within clusters, are independent of 5-HT concentrations below the blocking concentrations (Table S1).
Each cluster is typically composed of two to four bursts separated by closings, which correspond to the third-briefest closed component of the closed-time histogram (Fig. 1 b). We selected bursts, determined the open- and closed-time distributions for the selected bursts, and then compared these values to those of clusters (Table S1). The distribution of open durations of the selected bursts remains unchanged with respect to that of clusters, showing that the same three components are found within bursts and clusters. The distributions of closed times within bursts are fitted by two components, which correspond to the two briefest closed components (CB and CI) described for clusters (Table S1).
A detailed inspection of channel traces shows that the three classes of openings and the two classes of closings occur in any sequence within a burst. Among possible kinetic schemes, those that depict a linear sequence of alternating closed and open states do not account for this observation. We therefore considered a cyclic scheme to describe dwell times within bursts, in which the three openings are connected with the two closings (Scheme 1 a). This scheme is similar to that reported previously for the activation of the α7-5HT3A receptor (21).
Scheme 1.
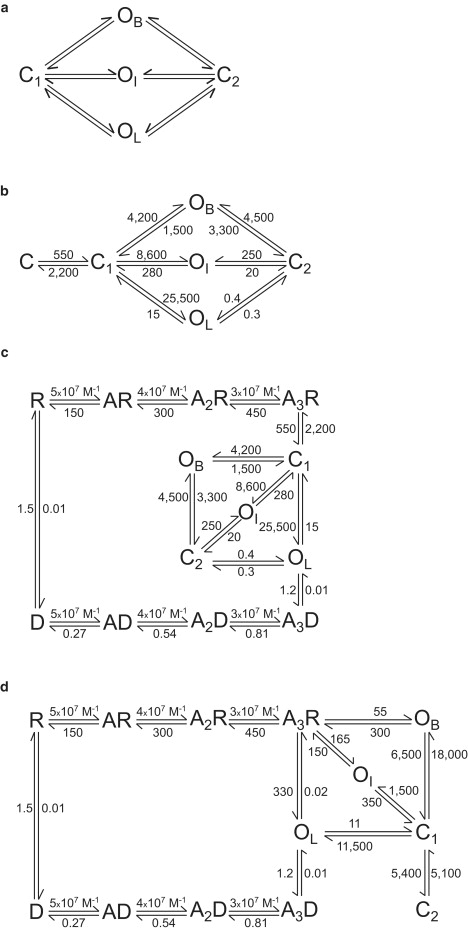
Kinetic schemes for activation of 5-HT3A receptors.
We thoroughly inspected single-channel recordings to determine in which proportion events corresponding to each of the three duration classes appear at the beginning and the end of bursts. From the inspection of 38 bursts, we observed that ∼60% of bursts start and finish with a long opening (OL), ∼30% with an intermediate opening (OI), and ∼10% with a brief opening (OB).
Since bursts are included in long clusters, which represent activation episodes, and since dwell-time distributions within bursts and clusters differ only in the third closed component, we next added the interburst intracluster closed state, C, to Scheme 1 a (Scheme 1 b). “C” corresponds to the closed, fully-liganded receptor (A3R) and should be therefore connected to the binding steps.
Scheme 1 b explains the observation that openings corresponding to every duration class can appear at the beginning and end of a burst. The dwell time in C corresponds to the observed intracluster interburst ∼3-ms closed time. The transition between C and C1 can also explain the relatively slow rise time of 5-HT3A currents (∼330 s−1).
Therefore, Scheme 1 b postulates that once the receptor is fully occupied (C in Scheme 1 b), it changes its conformation to a closed pre-open state (C1), from which channel opening is allowed (19). This scheme explains the observations of the concentration-independent clusters, the presence of brief closings within bursts, the coalescence of bursts into long clusters, and the slow activation rate.
By fitting the data from the selected clusters with Scheme 1 b, we obtained the rate constants shown in Scheme 1 b and Table S2. The curves resulting from the kinetic analysis superimposed on the experimental open- and closed-duration histograms (Fig. 1 b).
The estimated rate for C-to-C1 transition (k+) is similar to the activation rate obtained from macroscopic currents. Therefore, our analysis suggests that once fully occupied by the agonist, the receptor changes its conformation to a closed, but activatable, state. This is the limiting step for activation, which leads to the typical slow-activating 5-HT3A currents. Once this activatable state is reached, the opening rate (∼25,500 s−1) is fast and the channel can oscillate between different open and closed states, forming a burst. The transitions between the C1 and C states allow the bursts to coalesce into clusters.
The opening rates obtained on the basis of Scheme 1 b show that once the receptor reaches C1 it will open mainly to the OL state (∼60%), and in a minor proportion to the OI (∼30%) and OB states (∼10%). This agrees well with the proportion in which events corresponding to each open class appear at the beginning of a burst.
Models that assume that each open state corresponds to a different sate of ligation, such as those described for the glycine receptor (31), cannot describe the experimental dwell times within clusters. In addition, if we consider that the three classes of openings arise from the activity of fully-liganded receptors, but we include binding steps preceding the cyclic scheme, either the association rates have to be very fast or the dissociation rates very slow to allow the fit. Such rates would indicate a 5-HT affinity in the nanomolar order, whereas the reported values are in the order of tens of micromolar (16,17,32). Thus, these analyses support the idea that the open-closed cycle arises from the activity of fully liganded receptors and that binding steps are not included in the selected clusters.
Kinetic model for binding, activation, and desensitization of 5-HT3A receptors
To describe the full activation mechanism of 5-HT3A receptors, we included binding and desensitization steps in Scheme 1 b (Scheme 1 c).
The homopentameric receptor contains five identical subunits and each receptor can therefore, in principle, bind as many as five agonist molecules. We assumed that all binding sites are independent (there is no cooperativity), and rate constants for agonist association (k1) or dissociation (k2) are equal for each state (17).
The rising phase of macroscopic currents is clearly sigmoidal at all agonist concentrations, suggesting that channel opening requires more than one agonist molecule (33,34). We tested models with one to five agonist-dependent activation steps using MAC from QuB software, and compared the quality of the fitting by its SSE (33). The best fit is typically obtained with models containing two or three agonist binding steps. For example, for one patch, the SSE values, normalized to that obtained for a scheme with five binding steps, were 0.41, 0.16, 0.18, 0.96, and 1 for one, two, three, four, and five binding steps, respectively. The difference between three and two binding steps was not statistically significant, but we initially chose three binding steps to be consistent with previous studies (17,35).
Values for k1 and k2 were therefore estimated by fitting the rising phase of the macroscopic currents to a model with three agonist binding steps connected to a pre-open closed state (Scheme 1 c and Fig. 3 a). The values k1 = 1 × 10⁷ M−1 s−1 and k2 = 150 s−1 are very similar to those reported previously (17). Since closings within clusters do not show concentration dependence, we assume that the receptor reaches the pre-open closed state once it has achieved the maximal occupation (A3R), and we do not consider in this analysis openings from intermediate states of ligation.
Figure 3.
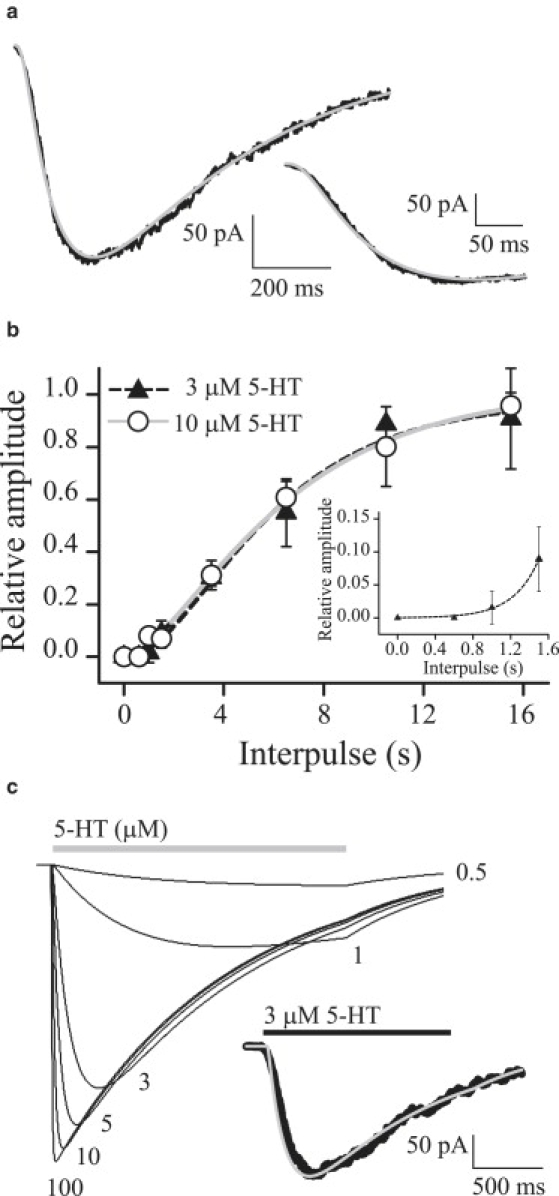
Activation and recovery from desensitization. (a) Experimental currents elicited by 3 μM 5-HT, with the fit from Scheme 1c superimposed (gray line). (Inset) Rising phase at a different timescale. (b) Recovery from desensitization in the absence of 5-HT. Currents were activated by a 1.5-s pulse of 3 or 10 μM 5-HT. The fractional recovery of the current elicited by a second pulse was plotted against the interpulse interval and fitted by Eq. 3. (Inset) Initial phase of the curve. (c) Macroscopic currents simulated at different 5-HT concentrations (μM) on the basis of Scheme 1c. (Inset) Simulated current at 3 μM 5-HT (gray line) superimposed on the experimental current (black line).
We next incorporated desensitization from the open state to allow termination of clusters (13,17). Although desensitization may occur from any open state, we connected the desensitized state (A3D) only from the longest-duration open state (OL), for which the probability of desensitization onset will be higher (Scheme 1 c).
Macroscopic currents show that at all agonist concentrations, the current reaches a steady state after a long desensitizing pulse (Fig. 2 a). The relationship between the amplitude of the steady-state current and the peak at high concentration of 5-HT is <1%. Therefore, the value for the rate of recovery from the desensitized state (A3D) in the presence of agonist (k-d) is ∼0.01 s−1. Given that k-d is close to zero and the Popen within clusters is close to 1, k+d can be calculated as the inverse of the current decay time constant (k+d = 1/τd) and therefore its estimated value is 1.2 ± 0.9 s−1.
The recovery of peak currents during washout of agonist shows a sigmoidal behavior (Fig. 3 b), thus suggesting a multistep mechanism by which the receptor returns from the desensitized to the resting state (AnD→[…]n−1→R) (24). Fitting the experimental points using Eq. 3 gives a recovery time (τr) of 3.7 ± 0.9 s in the absence of agonist, and an n factor of ∼3 (2.7 ± 0.8) (mean ± SE, r2 = 0.99). This factor is an estimation of the number of agonist-dependent pathways to restore the receptor to the resting state. This result is in agreement with the three agonist molecules required to enter the activation cycle. Therefore, the three agonist-dependent steps from the desensitized state to the resting state were interpreted as the agonist unbinding pathway (A3D→A2D→AD→D→R), and the resensitization rate (k3 in Scheme 1 c) approximates the inverse of the recovery time constant (17). The estimated value for k3 is 0.27 ± 0.04 s−1.
Scheme 1 c shows the complete kinetic model for the 5-HT3A receptor, with the rate constants for each transition (s−1) resulting from the combined analysis of single-channel and macroscopic currents.
Simulation of macroscopic and single-channel currents on the basis of complete kinetic schemes
To corroborate Scheme 1 c, we simulated macroscopic currents with the rates shown in the scheme. The simulated currents (Fig. 3 c) mimicked the experimental responses (Fig. 2 a). However, the decays of the simulated currents are fitted by a single component at all agonist concentrations, whereas experimental curves show a double exponential decay at concentrations >5 μM. This difference arises from the fact that Scheme 1 c does not include block by agonist. The EC50 and the Hill coefficient, calculated from the peak of the simulated currents at a range of 5-HT concentration, are 2.3 ± 0.1 μM and 2.1 ± 0.2, respectively, similar to the experimental values (Fig. S3). Simulation of recovery from desensitization on the basis of Scheme 1 c shows a sigmoidal curve that perfectly fits the experimental points (Fig. S3). The values obtained from the simulated curve for the recovery time (τr) and the number of steps (n) 3.7 ± 0.5 s−1 and 2.8 ± 0.6, respectively, using Eq. 3 are identical to those obtained experimentally. Simulated currents elicited by both brief and long pulses of agonist are similar to those observed experimentally (Fig. S3).
Moreover, single-channel currents at 1 μM 5-HT simulated on the basis of Scheme 1 c are indistinguishable from experimental currents (Fig. 4). The three open and the three briefest closed components of channels simulated at a range of concentrations (0.1, 1, 3, and 10 μM 5-HT) are identical to those of the selected clusters. However, the simulation of channels at a range of concentration shows an additional concentration-dependent closed component. This component varies between tens of seconds at 0.1 μM and 50 ms at 5 μM; these times are more prolonged than the critical time used to select clusters (5–10 ms). This closed component is therefore not included in the selected clusters. Given its long duration and low frequency (relative area <0.02), it cannot be experimentally distinguished.
Figure 4.
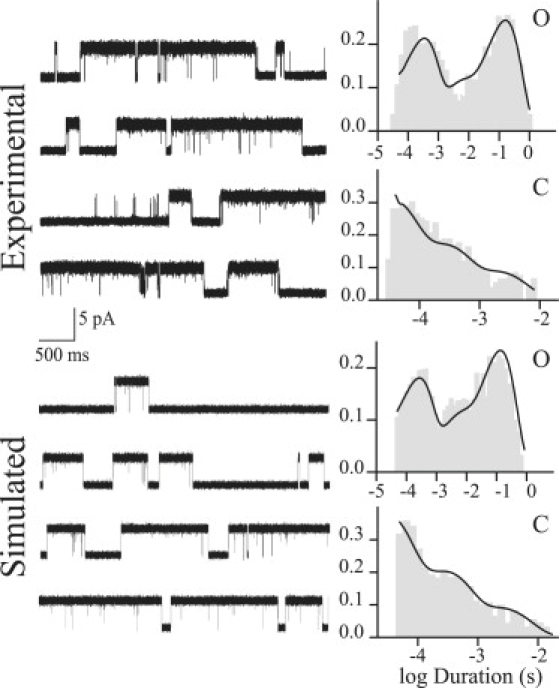
Simulation of single-channel currents at 1 μM 5-HT, with open- (O) and closed-duration histograms (C) for experimental and simulated channels. (Upper) Single-channel traces from cell-attached patches. (Lower) Single-channel currents simulated using the rate constants shown in Scheme 1c.
In conclusion, simulation of macroscopic and single-channel currents confirms the proposed mechanism for 5-HT3A activation.
We also tested other schemes lacking the pre-open closed state. First, we rearranged the connections between Scheme 1 b (with its resulting rates) and the binding steps. One possibility is that C1 in Scheme 1 c is not sequentially connected to the binding steps and that it is a fast desensitized state arising from A3R (Fig. S4, Scheme 2, CD, in the Supporting Material). In an alternative scheme, A3R is connected to the open states, and a fast desensitized state (Fig. S4, Scheme 3, CD, in the Supporting Material) is connected to C2 of Scheme 1 c. Macroscopic currents simulated on the basis of these schemes cannot mimic those observed in experiments mainly because activation rates are much faster in simulations than in experiments (Fig. S4).
Because the above models lack the pre-open closed state and therefore cannot describe the slow activation, we next fitted data from the selected clusters to a cyclic model but with the opening rates fixed to account for the slow activation of macroscopic currents. Under these conditions, the data from the selected clusters can be well described. We then added to the cyclic scheme the binding and desensitization steps, thus resulting in a full model that lacks the pre-open closed state (Scheme 1 d). Simulations show that this model can well reproduce the experimental currents and the dose-response curves (Fig. S5). Moreover, simulated channels occur in long clusters and distributions of open- and closed-time histograms are similar to those observed in experiments (Fig. S5).
Application of the scheme to identify kinetic changes produced by mutations
To corroborate that Scheme 1 b can be applied to explain kinetic changes associated with mutations, we analyzed mutant 5-HT3A receptors. Although M4 is the most external transmembrane domain, several findings have shown that it is important for activation of the nicotinic ACh receptor (26,36,37). Position 10′ has been shown to affect gating kinetics (36,38). Given that there is a highly conserved valine at this position of 5-HT3A, we mutated V10′ to alanine (V10′A) and to cysteine (V10′C) and performed single-channel kinetic analysis on the basis of Scheme 1 b.
At the single-channel level, activation of the mutant receptors occurs in clusters, similar to activation of the control. Open-time histograms also show three open components. However, there is a significant decrease of the duration of the slowest open component (two- to threefold) with respect to that of the control (Fig. 5). At 1 μM 5-HT, the mean duration of this component is 49 ± 19 ms and 41 ± 14 ms for V10′A and V10′C, respectively.
Figure 5.
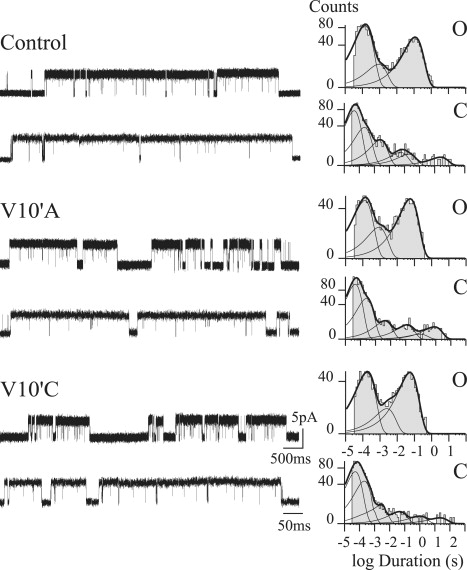
Effects of 10′M4 mutations on single-channel properties. Single channels from 5-HT3A(HC) (upper), V10′A (middle), and V10′C (lower) mutant receptors activated by 1 μM 5-HT. Membrane potential, −70 mV. Open- (O) and closed-duration histograms (C) corresponding to each condition are shown. Channel openings are shown as upward deflections.
To quantify the kinetic changes originated by the M4 mutations we performed single-channel kinetic analysis with the data from selected clusters obtained from recordings at 0.5–3 μM 5-HT. The analysis shows changes in the opening (β1L) and closing rates (α1L) corresponding to the transitions from C1 to OL in Scheme 1 b (Table S2). The opening rate decreases from 25,500 s−1 to 16,300 s−1 (V10′A) and 6900 s−1 (V10′C) and the closing rate slightly increases in both mutants. It is interesting that there is a 3.5-fold decrease in k+, which corresponds to the rate from the fully liganded closed state to the pre-open closed state, indicating impaired opening. Thus, the scheme is useful in demonstrating how mutations affect gating kinetics.
Discussion
The high-conductance form of the 5-HT3A receptor is a valid model for understanding the kinetics of wild-type receptors, since the triple mutation does not affect significantly channel activation parameters. Support for this lies in the fact that the EC50, the decay rate, and the rise time of macroscopic currents are similar to those determined previously for wild-type 5-HT3A receptors (10,11,16,17). Moreover, a recent study shows that deletion of the entire M3-M4 loop mainly affects channel conductance of 5-HT3A receptors (14). Nevertheless, there might be slight kinetic changes produced by the triple mutation that can be detected only at the single-channel level.
Under the recording conditions described in this article, the inward conductance of 5-HT3A(HC) channels, determined by the single-channel amplitude at different membrane potentials, is ∼67 pS. Different values for the conductance of the triple mutant receptor have been reported, thus indicating that it may be sensitive to the concentration of Ca2+, Mg2+, or other factors not yet identified (39,40).
Striking features of channel activity are that openings appear in clusters even at the lowest 5-HT concentration that elicits single-channel openings, and that the Popen and closed intervals within clusters do not depend on agonist concentration (at concentrations below the blocking concentrations). A similar activity pattern has been described for α7-5HT3A (21). The absence of concentration dependence suggests that the cluster arises from the activity of the fully liganded receptor (13). This activity pattern shows significant differences with respect to other Cys-loop receptors (26,31).
To derive rate constants underlying activation by 5-HT, we first analyzed open and closed intervals within clusters according to a scheme containing three open and three closed states. Inspection of bursts shows that all classes of openings can appear in any sequence within the burst, and therefore a cyclic scheme allows the best description (Scheme 1 b). A kinetic model that includes an earlier conformational change of the fully liganded receptor that occurs while the channel is still closed allows an adequate description of the experimental data. A pre-open closed state, called a “flipped state”, was first suggested for glycine receptors (18). It has also been reported that the differential responses between partial and full agonists on nicotinic ACh and glycine receptors can be explained by the different kinetics of entry and exit into this flipped state (19). More recently, pre-open closed states have been identified for activation of muscle ACh receptors (20). Our study reveals that the conformational change to a closed but activatable state may also take place in 5-HT3A, and this may be responsible for its relatively slow activation rate. Models lacking this state can reproduce the experimental data only if the opening rates are constrained to values that account for the slow activation.
We combined results from single-channel kinetic analysis and macroscopic currents to generate a complete kinetic mechanism that describes binding, activation, and desensitization. To incorporate binding steps into the model, we need to know how many binding sites are required for channel activation. Homopentameric Cys-loop receptors contain five identical subunits and therefore each receptor can, in principle, bind as many as five agonist molecules. Studies of dose-response relationships and modeling in homomeric Cys-loop receptors suggest that two to five sites may be required (16,17,31,41,42). Direct experimental evidence shows that occupancy of three sites is required for maximal activation of α7-5HT3A receptors (35). In agreement with this, analysis of the rising phase and recovery from desensitization suggests that three binding steps are required for activation of 5-HT3A receptors.
The estimated rates for agonist association and dissociation are similar to those reported previously (17). Our study does not eliminate the possibility that binding of the agonist to one or two sites can induce channel opening, since activation episodes corresponding to receptors that are not fully liganded, which may show different kinetic properties, could have been excluded during cluster selection. The study suggests that the binding steps are not included in the selected clusters. The concentration dependence arising from association and dissociation steps is demonstrated, in recordings from simulations based on the complete model, by the presence of prolonged closings sensitive to concentration. These closings are not included in the selected clusters and cannot be distinguished experimentally. Thus, by combining the rates calculated from the concentration-independent clusters arising from the activity of fully liganded receptors with the macroscopic results that contain information about the concentration-dependent steps at a wide range of concentrations, we were able to generate a full activation scheme.
Although desensitization may occur from open or closed states, it has been proposed for 5-HT3 (16,17) and for nicotinic ACh receptors (13,43) that it mainly occurs from the open state. Therefore, we initially assumed that desensitization takes place from the longest-duration open state. We then simulated macroscopic and single-channel currents and corroborated that desensitization is less likely to occur from the closed state (Fig. S6, Scheme 4 in the Supporting Material).
After a short pulse of agonist, currents decay due to deactivation. The decay time constant for deactivation is similar to that for desensitization at 10 μM 5-HT, though it is slightly faster at 3 μM. This indicates that in the absence of agonist, the receptors return to the resting state mainly by the same pathway as in the continuous presence of agonist, thus supporting the theory that desensitization is the main process that finishes the response (13,17). We have suggested that desensitization also governs the duration of openings of α7 receptors (13). Thus, desensitization may be important for governing the duration of the response of homomeric excitatory Cys-loop receptors.
Simulations performed on the basis of Scheme 1 c perfectly reproduce the experimental single-channel and macroscopic data, showing that this scheme adequately represents activation, deactivation, and desensitization. Our model is in general agreement with others generated on the basis of macroscopic data (16,17), and it further contributes to the understanding of the mechanism of activation of 5-HT3A(HC) receptors by revealing additional information that can be obtained only at the single-channel level.
We observed that 5-HT3A(HC) channels are blocked by 5-HT at concentrations >5 μM. Open-channel block is distinguished at the single-channel level by concentration-dependent decrease of the mean open time. However, since the cluster duration decreases, it is possible that slow block also occurs. We cannot distinguish slow channel block from concentration-dependent desensitization. Since Scheme 1 c does not incorporate block by the agonist, it does not reproduce the biphasic decay of macroscopic currents at high concentrations during the simulation. However, by performing the simulation with the incorporation of two blocked states in Scheme 1 c connected to the longest-duration open state (Fig. S6, Scheme 5 in the Supporting Material), experimental macroscopic and single-channel currents are perfectly mimicked. Therefore, fast open-channel block can explain the reduction in the open duration determined at the single-channel level, and slow block or concentration-dependent desensitization can explain the biphasic decay of currents, as well as the reduction in cluster duration at high 5-HT concentrations.
A conserved valine is found at position 10′ of M4 in all 5-HT3A subunits. We determine that mutations at this position decrease the opening rate, increase the closing rate, and decrease the transition to the pre-open closed state. These results validate the use of our kinetic model to understand the functional role of residues. In addition, they reveal a highly conserved role for the outermost transmembrane segment of members of the Cys-loop receptor superfamily.
Supporting Material
Two tables, six figures, and five schemes are available at http://www.biophysj.org/biophysj/supplemental/S0006-3495(09)01123-0.
Supporting Material
Acknowledgments
We thank Steven Sine for helpful discussions. We gratefully acknowledge advice from the QuB Suite, particularly from John Bannen and Chris Nicolai.
This work was supported by grants from Universidad Nacional del Sur, Agencia Nacional de Promoción Científica y Tecnológica, Consejo Nacional de Investigaciones Científicas y Técnicas, Loreal-UNESCO, and Fundación F. Fiorini (C.B.), and by National Institutes of Health grant NS053521 (to Steven. Sine, of the Mayo Clinic, and C.B.).
References
- 1.Sine S.M., Engel A.G. Recent advances in Cys-loop receptor structure and function. Nature. 2006;440:448–455. doi: 10.1038/nature04708. [DOI] [PubMed] [Google Scholar]
- 2.Collingridge G.L., Olsen R.W., Peters J., Spedding M. A nomenclature for ligand-gated ion channels. Neuropharmacology. 2009;56:2–5. doi: 10.1016/j.neuropharm.2008.06.063. [DOI] [PMC free article] [PubMed] [Google Scholar]
- 3.Chameau P., van Hooft J.A. Serotonin 5-HT3 receptors in the central nervous system. Cell Tissue Res. 2006;326:573–581. doi: 10.1007/s00441-006-0255-8. [DOI] [PubMed] [Google Scholar]
- 4.Thompson A.J., Lummis S.C. The 5-HT3 receptor as a therapeutic target. Expert Opin. Ther. Targets. 2007;11:527–540. doi: 10.1517/14728222.11.4.527. [DOI] [PMC free article] [PubMed] [Google Scholar]
- 5.Davies P.A., Pistis M., Hanna M.C., Peters J.A., Lambert J.J. The 5–HT3B subunit is a major determinant of serotonin-receptor function. Nature. 1999;397:359–363. doi: 10.1038/16941. [DOI] [PubMed] [Google Scholar]
- 6.Niesler B., Walstab J., Combrink S., Moller D., Kapeller J. Characterization of the novel human serotonin receptor subunits 5-HT3C, 5-HT3D, and 5-HT3E. Mol. Pharmacol. 2007;72:8–17. doi: 10.1124/mol.106.032144. [DOI] [PubMed] [Google Scholar]
- 7.Holbrook J.D., Gill C.H., Zebda N., Spencer J.P., Leyland R. Characterization of 5-HT3C, 5-HT3D and 5-HT3E receptor subunits: evolution, distribution and function. J. Neurochem. 2009;108:384–396. doi: 10.1111/j.1471-4159.2008.05775.x. [DOI] [PubMed] [Google Scholar]
- 8.Jensen P., Farago A.F., Awatramani R.B., Scott M.M., Deneris E.S. Redefining the serotonergic system by genetic lineage. Nat. Neurosci. 2008;11:417–419. doi: 10.1038/nn2050. [DOI] [PMC free article] [PubMed] [Google Scholar]
- 9.Niesler B., Kapeller J., Hammer C., Rappold G. Serotonin type 3 receptor genes: HTR3A, B, C, D, E. Pharmacogenomics. 2008;9:501–504. doi: 10.2217/14622416.9.5.501. [DOI] [PubMed] [Google Scholar]
- 10.Hussy N., Lukas W., Jones K.A. Functional properties of a cloned 5-hydroxytryptamine ionotropic receptor subunit: comparison with native mouse receptors. J. Physiol. 1994;481:311–323. doi: 10.1113/jphysiol.1994.sp020441. [DOI] [PMC free article] [PubMed] [Google Scholar]
- 11.Maricq A.V., Peterson A.S., Brake A.J., Myers R.M., Julius D. Primary structure and functional expression of the 5HT3 receptor, a serotonin-gated ion channel. Science. 1991;254:432–437. doi: 10.1126/science.1718042. [DOI] [PubMed] [Google Scholar]
- 12.Kelley S.P., Dunlop J.I., Kirkness E.F., Lambert J.J., Peters J.A. A cytoplasmic region determines single-channel conductance in 5-HT3 receptors. Nature. 2003;424:321–324. doi: 10.1038/nature01788. [DOI] [PubMed] [Google Scholar]
- 13.Bouzat C., Bartos M., Corradi J., Sine S.M. The interface between extracellular and transmembrane domains of homomeric Cys-loop receptors governs open-channel lifetime and rate of desensitization. J. Neurosci. 2008;28:7808–7819. doi: 10.1523/JNEUROSCI.0448-08.2008. [DOI] [PMC free article] [PubMed] [Google Scholar]
- 14.Jansen M., Bali M., Akabas M.H. Modular design of Cys-loop ligand-gated ion channels: functional 5-HT3 and GABA rho1 receptors lacking the large cytoplasmic M3M4 loop. J. Gen. Physiol. 2008;131:137–146. doi: 10.1085/jgp.200709896. [DOI] [PMC free article] [PubMed] [Google Scholar]
- 15.Hapfelmeier G., Tredt C., Haseneder R., Zieglgansberger W., Eisensamer B. Co-expression of the 5-HT3B serotonin receptor subunit alters the biophysics of the 5-HT3 receptor. Biophys. J. 2003;84:1720–1733. doi: 10.1016/S0006-3495(03)74980-7. [DOI] [PMC free article] [PubMed] [Google Scholar]
- 16.Mott D.D., Erreger K., Banke T.G., Traynelis S.F. Open probability of homomeric murine 5-HT3A serotonin receptors depends on subunit occupancy. J. Physiol. 2001;535:427–443. doi: 10.1111/j.1469-7793.2001.00427.x. [DOI] [PMC free article] [PubMed] [Google Scholar]
- 17.Solt K., Ruesch D., Forman S.A., Davies P.A., Raines D.E. Differential effects of serotonin and dopamine on human 5-HT3A receptor kinetics: interpretation within an allosteric kinetic model. J. Neurosci. 2007;27:13151–13160. doi: 10.1523/JNEUROSCI.3772-07.2007. [DOI] [PMC free article] [PubMed] [Google Scholar]
- 18.Burzomato V., Beato M., Groot-Kormelink P.J., Colquhoun D., Sivilotti L.G. Single-channel behavior of heteromeric α1β glycine receptors: an attempt to detect a conformational change before the channel opens. J. Neurosci. 2004;24:10924–10940. doi: 10.1523/JNEUROSCI.3424-04.2004. [DOI] [PMC free article] [PubMed] [Google Scholar]
- 19.Lape R., Colquhoun D., Sivilotti L.G. On the nature of partial agonism in the nicotinic receptor superfamily. Nature. 2008;454:722–727. doi: 10.1038/nature07139. [DOI] [PMC free article] [PubMed] [Google Scholar]
- 20.Mukhtasimova N., Lee W.Y., Wang H.L., Sine S.M. Detection and trapping of intermediate states priming nicotinic receptor channel opening. Nature. 2009;459:451–454. doi: 10.1038/nature07923. [DOI] [PMC free article] [PubMed] [Google Scholar]
- 21.Rayes D., Spitzmaul G., Sine S.M., Bouzat C. Single-channel kinetic analysis of chimeric α7-5HT3A receptors. Mol. Pharmacol. 2005;68:1475–1483. doi: 10.1124/mol.105.015438. [DOI] [PubMed] [Google Scholar]
- 22.Gumilar F., Arias H.R., Spitzmaul G., Bouzat C. Molecular mechanisms of inhibition of nicotinic acetylcholine receptors by tricyclic antidepressants. Neuropharmacology. 2003;45:964–976. doi: 10.1016/s0028-3908(03)00247-8. [DOI] [PubMed] [Google Scholar]
- 23.Liu Y., Dilger J.P. Opening rate of acetylcholine receptor channels. Biophys. J. 1991;60:424–432. doi: 10.1016/S0006-3495(91)82068-9. [DOI] [PMC free article] [PubMed] [Google Scholar]
- 24.van Hooft J.A., Vijverberg H.P. Selection of distinct conformational states of the 5-HT3 receptor by full and partial agonists. Br. J. Pharmacol. 1996;117:839–846. doi: 10.1111/j.1476-5381.1996.tb15269.x. [DOI] [PMC free article] [PubMed] [Google Scholar]
- 25.Qin F., Auerbach A., Sachs F. Estimating single-channel kinetic parameters from idealized patch-clamp data containing missed events. Biophys. J. 1996;70:264–280. doi: 10.1016/S0006-3495(96)79568-1. [DOI] [PMC free article] [PubMed] [Google Scholar]
- 26.Bouzat C., Gumilar F., Esandi M.C., Sine S.M. Subunit-selective contribution to channel gating of the M4 domain of the nicotinic receptor. Biophys. J. 2002;82:1920–1929. doi: 10.1016/S0006-3495(02)75541-0. [DOI] [PMC free article] [PubMed] [Google Scholar]
- 27.Reeves D.C., Jansen M., Bali M., Lemster T., Akabas M.H. A role for the β1-β2 loop in the gating of 5-HT3 receptors. J. Neurosci. 2005;25:9358–9366. doi: 10.1523/JNEUROSCI.1045-05.2005. [DOI] [PMC free article] [PubMed] [Google Scholar]
- 28.Hu X.Q., Lovinger D.M. The L293 residue in transmembrane domain 2 of the 5-HT3A receptor is a molecular determinant of allosteric modulation by 5-hydroxyindole. Neuropharmacology. 2008;54:1153–1165. doi: 10.1016/j.neuropharm.2008.03.009. [DOI] [PMC free article] [PubMed] [Google Scholar]
- 29.Neher E., Steinbach J.H. Local anaesthetics transiently block currents through single acetylcholine-receptor channels. J. Physiol. 1978;277:153–176. doi: 10.1113/jphysiol.1978.sp012267. [DOI] [PMC free article] [PubMed] [Google Scholar]
- 30.Gumilar F., Bouzat C. Tricyclic antidepressants inhibit homomeric Cys-loop receptors by acting at different conformational states. Eur. J. Pharmacol. 2008;584:30–39. doi: 10.1016/j.ejphar.2008.01.023. [DOI] [PubMed] [Google Scholar]
- 31.Beato M., Groot-Kormelink P.J., Colquhoun D., Sivilotti L.G. The activation mechanism of alpha1 homomeric glycine receptors. J. Neurosci. 2004;24:895–906. doi: 10.1523/JNEUROSCI.4420-03.2004. [DOI] [PMC free article] [PubMed] [Google Scholar]
- 32.Kaneez F.S., White M. Patch clamp study of serotonin-gated currents via 5-HT type 3 receptors by using a novel approach SHAM for receptor channel scanning. J. Biomed. Biotechnol. 2004;2004:10–15. doi: 10.1155/S1110724304302020. [DOI] [PMC free article] [PubMed] [Google Scholar]
- 33.Clements J.D., Westbrook G.L. Activation kinetics reveal the number of glutamate and glycine binding sites on the N-methyl-D-aspartate receptor. Neuron. 1991;7:605–613. doi: 10.1016/0896-6273(91)90373-8. [DOI] [PubMed] [Google Scholar]
- 34.Legendre P. A reluctant gating mode of glycine receptor channels determines the time course of inhibitory miniature synaptic events in zebrafish hindbrain neurons. J. Neurosci. 1998;18:2856–2870. doi: 10.1523/JNEUROSCI.18-08-02856.1998. [DOI] [PMC free article] [PubMed] [Google Scholar]
- 35.Rayes D., De Rosa M.J., Sine S.M., Bouzat C. Number and locations of agonist binding sites required to activate homomeric Cys-loop receptors. J. Neurosci. 2009;29:6022–6032. doi: 10.1523/JNEUROSCI.0627-09.2009. [DOI] [PMC free article] [PubMed] [Google Scholar]
- 36.Bouzat C., Roccamo A.M., Garbus I., Barrantes F.J. Mutations at lipid-exposed residues of the acetylcholine receptor affect its gating kinetics. Mol. Pharmacol. 1998;54:146–153. doi: 10.1124/mol.54.1.146. [DOI] [PubMed] [Google Scholar]
- 37.Mitra A., Bailey T.D., Auerbach A.L. Structural dynamics of the M4 transmembrane segment during acetylcholine receptor gating. Structure. 2004;12:1909–1918. doi: 10.1016/j.str.2004.08.004. [DOI] [PubMed] [Google Scholar]
- 38.Lee Y.H., Li L., Lasalde J., Rojas L., McNamee M. Mutations in the M4 domain of Torpedo californica acetylcholine receptor dramatically alter ion channel function. Biophys. J. 1994;66:646–653. doi: 10.1016/s0006-3495(94)80838-0. [DOI] [PMC free article] [PubMed] [Google Scholar]
- 39.Brown A.M., Hope A.G., Lambert J.J., Peters J.A. Ion permeation and conduction in a human recombinant 5–HT3 receptor subunit (h5-HT3A) J. Physiol. 1998;507:653–665. doi: 10.1111/j.1469-7793.1998.653bs.x. [DOI] [PMC free article] [PubMed] [Google Scholar]
- 40.Livesey M.R., Cooper M.A., Deeb T.Z., Carland J.E., Kozuska J. Structural determinants of Ca2+ permeability and conduction in the human 5-hydroxytryptamine type 3A receptor. J. Biol. Chem. 2008;283:19301–19313. doi: 10.1074/jbc.M802406200. [DOI] [PMC free article] [PubMed] [Google Scholar]
- 41.Amin J., Weiss D.S. Insights into the activation mechanism of rho1 GABA receptors obtained by coexpression of wild type and activation-impaired subunits. Proc. Biol. Sci. 1996;263:273–282. doi: 10.1098/rspb.1996.0042. [DOI] [PubMed] [Google Scholar]
- 42.Gentet L.J., Clements J.D. Binding site stoichiometry and the effects of phosphorylation on human α1 homomeric glycine receptors. J. Physiol. 2002;544:97–106. doi: 10.1113/jphysiol.2001.015321. [DOI] [PMC free article] [PubMed] [Google Scholar]
- 43.Auerbach A., Akk G. Desensitization of mouse nicotinic acetylcholine receptor channels. A two-gate mechanism. J. Gen. Physiol. 1998;112:181–197. doi: 10.1085/jgp.112.2.181. [DOI] [PMC free article] [PubMed] [Google Scholar]
Associated Data
This section collects any data citations, data availability statements, or supplementary materials included in this article.