

Abstract
Bone morphogenetic proteins (BMPs) are involved with a wide range of processes including apoptosis, differentiation, and proliferation. Several different pathways such as Smad, p38, and PI3/Akt are activated by BMPs. Signaling is transduced by BMP receptors (BMPRs) of type I and type II that are serine/threonine kinase receptors. BMPRs shuttle between membrane domains such as caveolae enriched with caveolin-1 β-isoform and caveolae of the caveolin-1 α/β-isoforms. It is hypothesized that there are other membrane domains to which the receptors localize. We used immunoprecipitation, Western blots, image cross-correlation spectroscopy, and fluorescence resonance energy transfer to investigate the interaction of BMPRs with proteins in clathrin-coated pits (CCPs). Our data indicate that these domains are associated with at least two of the BMPRs: BRIa and BRII. For the first time, to our knowledge, we showed what we believe are specific interactions between BRIa and BRII with a key component of CCPs, adaptor protein 2. Further, disruption of CCPs resulted in increased BRIa aggregation at the cell surface and activation of the BMP pathway even in the absence of BMP2. Therefore, CCPs seem to function as a negative regulatory membrane domain for BMP pathway activation.
Introduction
The bone morphogenetic proteins (BMPs) form a subgroup of the transforming growth factor-β superfamily of ligands. They are crucial not only during skeletal development but also during neurogenesis, hematopoiesis, and bone remodeling. At the cellular level, BMPs regulate a variety of processes such as apoptosis, differentiation, and proliferation (1–3). BMPs are a large family of cytokines that transduce their signal via serine/threonine kinase transmembrane receptors (4–6). Activation of the signaling pathway is initiated by the binding of ligands to the type-I and type-II receptors followed by phosphorylation of the type-I receptor by the type II receptor, a constitutive active kinase (7). The most examined pathway is Smad, in which the signal is mediated to the nucleus via a heterodimer complex of Smad1, Smad5, and Smad8 (regulatory Smads (R-Smads)) with Smad4 (1–3,8,9). Other pathways include the p38, and ID1 PI3 (phosphatidylinositol 3-kinase)/AKT, ERK (extracellular signal-related kinases), JNK (c-Jun N-terminal kinase), NF-κβ (Nuclear Factor κβ), pathways (4,9–13).
There are numerous distinct mechanisms that provide negative feedback loops of the BMP pathways. Several BMP antagonists, such as noggin and follistatin, have been identified in the extracellular compartment (9,14). At the cell surface BAMBI (BMP and activin bound protein), a transmembrane glycoprotein, associates with BMPRs and inhibits activation of type-I receptors. Inside the cell, Smad6 and Smad7, which are inhibitory Smads, regulate the Smad pathway by BMP dependent upregulation and blocking of R-Smad phosphorylation (9). In addition, BMP signaling is regulated at the cell surface by caveolae, which are flask-shaped invaginations of the plasma membrane. BMPRs localize to these domains and shuttle between caveolin isoforms, CAV-1αβ and CAV-1β. Binding of BRII to the caveolin-1 scaffolding domain, phosphorylation of caveolin-1, or downregulation of caveolae all inhibit BMP signaling (9,15,16).
Previous results showed that 25% of BRII and 40% of BRIa colocalize with caveolae (16) raising the question whether there are other, still unidentified, target signaling areas that regulate BMPR recycling, storage, and key signaling events. Clathrin-coated pits (CCPs) are involved with receptor recycling and BMP signaling. The use of nonspecific chemical and mechanical treatments of the plasma membrane to disrupt CCPs showed stimulation of BMP signaling (17) whereas Hartung et al. (4) and Billings et al. (18) showed an inhibition of BMP signaling. However, more specific treatments for CCPs disruption must be applied to delineate the exact role of CCPs in BMP signaling. Receptor recycling via CCPs is carried out in three main steps by the cell. First is formation of nucleation sites. These sites form from adaptor proteins such as adaptor protein complex 2 (AP2) binding to phosphatidylinositol 4,5 bisphosphate (PtdIns-4,5-P2) and internalizing domains of cargo proteins (19–22). Other adaptor proteins include autosomal recessive hypercholesterolemia discontinuous actin hexagon, β-arrestin, numb, epsin, Eps15 (epidermal growth factor receptor pathway substrate clone 15), clathrin assembly lymphoid myeloid protein, and dimeric Huntingtin-interacting protein 1 related protein). Second is recruitment of clathrin by adaptor proteins. Third is the vesicle pinching off from the membrane surface by the GTPase, dynamin, and then coat dissociation (19–21,23).
Eps15 was identified previously as a BRII interacting protein suggesting a role for Eps15 in CCP mediated BMPR recycling during the early steps of endocytosis. However, key proteins that regulate later events such as recruitment of clathrin and pit formation for BMPRs have yet to be identified. In this study, we provide evidence for what we believe is a new protein receptor interaction between BMPRs and AP2. We show with the family of image correlation spectroscopy and fluorescence resonance energy transfer (FRET) that BRIa and BRII bound AP2 independently of each other. BRIa, but not BRII, increased its colocalization with AP2 after the addition of BMP2 indicating that AP2 recruited BRIa to CCPs. Specific disruption of CCPs induced an activation of the Smad pathway and increased alkaline phosphatase (ALP) expression. A known marker for osteogenesis, ALP data suggested the disruption of CCPs led to the initiation of osteogenesis of C2C12 cells. These data together with our previous observations suggest that the receptor complexes must shuttle on the membrane surface to signal properly and CCPs is an inhibitory membrane domain.
Experimental Procedures
Materials
Recombinant BMP2 was obtained from R&D Systems (Minneapolis, MN). The polyclonal goat anti-sera against the BMP receptors BRIa and BRII, the Alexa 546 red X conjugated donkey anti-goat antibody and Alexa 488 goat anti mouse antibody were from Santa Cruz Biotechnology (Santa Cruz, CA). Mouse antisera against adaptin β is from Transduction Laboratories (Lexington, KY). The cell lines A431 (CRL 1555) and C2C12 (CRL 1772) were purchased from American Type Culture Collection (Manassas, VA). Both cell types were grown in Dulbecco's modified Eagle's medium (DMEM) supplemented with 1% penicillin/streptomycin and with or without 10% FBS as indicated in the protocols.
Transfection of A431
A431 cells grown on 35-mm dishes were transfected by the DEAE-(Diethyl-Aminoethyl) dextran method (16). Five micrograms of DNA/plasmid were used.
Immunofluorescence labeling of cell surface receptors
To measure the distribution of the BMP receptors on the cell surface, we used confocal fluorescence imaging measurements. Cells were grown on 22-mm glass coverslips. A431 cells grew in DMEM without FBS. After 72 h cells were stimulated or mock-stimulated with BMP2 (40 nM) for 2.5 h. C2C12 cells were either treated with DMEM absent of potassium or DMEM without FBS. Treated C2C12 cells were incubated overnight. Cells were fixed by the acetone/methanol method (24). Cells were incubated for 30 min with 5% BSA to minimize nonspecific binding. A431 and C2C12 cells were incubated with polyclonal goat anti-sera recognizing either BRII or BRIa according to manufacturer's protocol followed by the corresponding secondary donkey anti-goat (20 μg/mL). After each antibody labeling, cells were washed three times with phosphate-buffered saline (PBS). They were then incubated with mouse anti-sera against the β-subunit of AP2 (manufacturer's protocol). They were incubated again with goat anti mouse antibody at a concentration of 20 μg/mL, washed and coverslips were mounted in Airvol (16).
Image correlation spectroscopy and image cross-correlation spectroscopy
Image correlation spectroscopy (ICS) is the technique used to study the distribution and localization of the BMPRs. High resolution and high magnification images were collected by confocal microscopy using a 63× objective. The microscope used was a BioRad MRC 600 confocal equipped with an argon-krypton mixed-gas laser and appropriate filter sets for dual-fluorophore imaging. ICS involves autocorrelation analysis of the intensity fluctuations within these confocal images, in this case from immunofluorescent labeled proteins (25–27). From this, the cluster density (CD) was calculated from Eq. 1 (25)
| (1) |
Image cross-correlation spectroscopy (ICCS) is the tool used to quantify the extent of colocalization between two proteins. It is based on the autocorrelation and cluster density from ICS. The autocorrelation is calculated for each image separately and then the cross-correlation function is calculated from the two images. This represents the average density of clusters in which both proteins localize together. The fraction of one protein colocalizing with the other can be calculated (25,27).
Immunoprecipitation and Western blots
A431 cells were serum starved to upregulate BRII (16,28). Cells were washed twice with cold PBS and lysed at 4°C for 60 min with lysis buffer (containing 10 mM Tris pH 7.5, 50 mM NaCl, 1% Triton X-100, 60 mM octyl glucoside, 1 mM PMSF, 10 mg/mL each of leupeptin, aprotinin, soybean trypsin inhibitor, benzamidine-HCl, pepstatin, and antipain). Immunoprecipitation (IP) used 10 ng/mL of antibody for BRIa and BRII from Santa Cruz Biotechnology and standard Western blots using the AP2 antibody against the β-subunit (16). As a negative control for IPs, blocking peptides (Santa Cruz Biotechnology) were used at a 20 times higher molar concentration to block the interaction between BRIa, BRII, and their corresponding antibody.
FRET
FRET is used to study molecular scale interactions between AP2 and BMPRs. The technique measures the energy transfer between a donor chromophore (green label in Fig. 2 B) on one protein and an acceptor chromophore (red label in Fig. 2 B) on the other protein. Transfer of energy can only occur if the two chromophores (and hence the two proteins) are closer than ∼100 Å (29,30). High resolution and high magnification images were collected by confocal microscopy of the donor chromophore fluorescence. The acceptor chromophore was then bleached completely and the donor chromophore fluorescence was imaged again. The increase in intensity of the donor fluorescence is a measure of the donor fluorescence that was quenched by the acceptor in the energy transfer process. The energy transfer efficiency (E) was calculated from Eq. 2 (31):
| (2) |
where Fda is the fluorescent intensity of the donor with the acceptor and Fd is the fluorescent intensity of the donor after the acceptor is photobleached. Knowing the energy transfer efficiency, the distance between the chromophores (R) can then be estimated by Eq. 3:
| (3) |
Here, R0 is the Foerster distance, that is the distance at which energy transfer efficiency is 50% of the maximum possible. R0 is calculated by Eq. 4 for a particular donor-acceptor pair:
| (4) |
The Foerster distance depends on K, the dipole orientation factor and it is usually assumed that K2 has a value of 2/3 corresponding to isotropic orientations of the chromophores with respect to each other. The refractive index of the medium is that of water (n =1.33), Qd is the fluorescence quantum yield of the donor in water (0.85) and J is the spectral overlap integral between donor emission and acceptor excitation spectra (J = 6.68 × 10¹³ M−1 cm−1 nm4 for the chromophores used here). Hence the value of R0 was calculated to be 32 Å for the chromophores used in this study (32).
Figure 2.
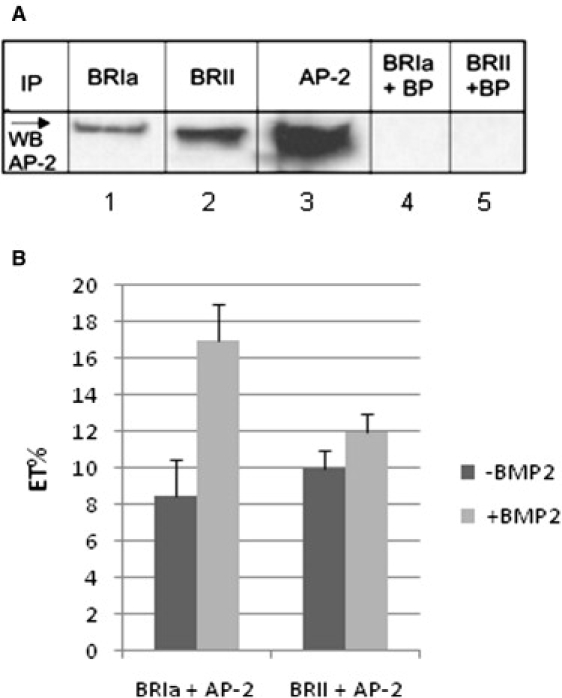
BRIa and BRII interact with AP2 at cell surface. (A) A431 cells were treated as described previously to upregulate BRII. Cells were lysed using a lysis buffer containing 1% Triton and BRIa or BRII immunoprecipitated using 10 ng/mL antibody for BRIa or BRII (lanes 1 and 2; Santa Cruz Biotechnology) followed by Western blot using an antibody against the β-subunit of AP2 according to manufacturers protocol. AP2 was detected at 106 kDa. Lane 3 shows the positive control (Immunoprecipitation and detection with the AP2 antibody). As controls blocking peptides (BP) for the IP antibody binding sites of BRIa or BRII were added to the lysis buffer at a 20x higher molar concentration (lanes 4 and 5). Bands were detected using ECL (Pierce, Rockford, IL). (B) BMP2 stimulated or unstimulated A431 cells were dual labeled with polyclonal goat anti BRIa and mouse anti adaptin β followed by a conjugated anti mouse Alexa 488 and donkey anti goat Alexa 546 red antibodies. Three ×40 high magnification images of flat regions of the cell membrane labeled for the β-subunit of AP2 and BRIa or BRII were collected. After bleaching of the acceptor chromophore (red), images were again collected and the increase in intensity in the donor (green) was calculated. From this, we calculated the energy transfer efficiency (ET), which is the difference in the intensity between the intensity of the donor before and after bleaching normalized to the intensity of the bleached donor image (p < 0.05).
Luciferase reporter assay
C2C12 cells grown in 60-mm dishes were transfected with 2 μg pSBE to measure the activity of the Smad pathway and 2 μg pRL-luc plasmids for normalization, whereas treated cells were transfected with 1 μg of plasmid encoding either EH29 or K44A to disrupt CCPs. Total amount of plasmid used was limited due to volumes used with transfection method. Cells were transfected with Lipofectamine 2000 from Invitrogen (Carlsbad, CA) according to the manufacturer's instructions; 4 h after transfection, cells where indicated were treated with potassium-free media and all cells were either stimulated with 40 nM BMP2 or mock stimulated. After 12 h of incubation, cells were washed with PBS, lysed and the luciferase activity was measured using a dual luciferase assay system (Promega, Madison, WI).
Alkaline phosphatase assay
C2C12 cells were transfected as indicated above with plasmids to disrupt CCPs. Control cells were either stimulated with 40 nM BMP2 or mock stimulated. The next day cells were lysed and scraped with 500 μL of a lysis buffer containing 0.1% Triton X-100 and 10 mM Tris pH 7.5. Samples were subjected three freeze/thaw cycles. Protein content was normalized before assays were carried out; 80 μL of sample and 180 μL of assay mixture (10% alkaline buffer solution, 4 μM MgCl2, and 18.5 mg/10 mL of p-nitrophenylphosphate (substrate)) were incubated together for 30 min at 37°C. Absorbances were measured at 405 nm.
Statistics
Standard error of the mean values was calculated from the raw data at the 95% confidence level. For both ICCS and FRET measurement, 40 images were taken per slide and experiments were carried out three times to ascertain reproducibility.
Results
BRIa and BRII colocalized with CCPs
CCPs are involved with regulating the Smad pathway via BMPRs, yet the mechanism is unknown. Colocalization studies of BMPRs (BRIa and BRII) to a marker for CCPs (AP2) were investigated in A431 cells. These cells are an established model for BMP signaling for primary mesenchymal cells isolated from primary limb mesenchymal cells at E11.25 or E11.75 (33). Labeling for AP2 will show two populations of the protein. One will be large clustering of proteins representing CCPs and the second is a smaller clustering of proteins displaying areas of nucleation sites, not yet formed CCPs as determined by ICS by Brown et al. (24). Whole cell (Fig. 1 A) and high magnification (Fig. 1 B) images of labeled BRIa, BRII, and AP2 at flat plasma membrane regions were taken with confocal microscopy. As expected both CCPs and AP2 nucleation sites were seen in the images (Fig. 1 B).We then used ICCS to calculate the extent of colocalization between AP2 and either BRIa or BRII (Fig. 1, C and D). Calculating the ratio of the density of clusters that contain both proteins as obtained from the cross-correlation function to the cluster density for one protein obtained from the autocorrelation function yields the fraction of clusters of one protein that also contain the other protein. Both BMPRs colocalized with AP2 in the absence of BMP; ∼45% of the AP2 clusters contained BRIa and 75% of the AP2 clusters contained BRII (Fig. 1 C). On BMP2 stimulation the extent of BRIa colocalization with AP2 increased from 45% to 70% whereas there was no significant effect of BMP2 stimulation on the colocalization of BRII with AP2. Correspondingly, 31% of BRIa clusters contained AP2 and 44% of BRII clusters contained AP2 in the absence of BMP. The stimulation by BMP2 led to an increase to 52% of AP2 colocalizing to BRIa clusters although there was no significant change in the amount of AP2 that colocalized to BRII clusters (Fig. 1 D). The observation is that the extent of colocalization of BRII and AP2 is constitutively greater than that of BRIa and AP2, but that the interaction of BRIa and AP2 was enhanced by exposure to BMP2 whereas the interaction of BRII and AP2 is unaffected.
Figure 1.
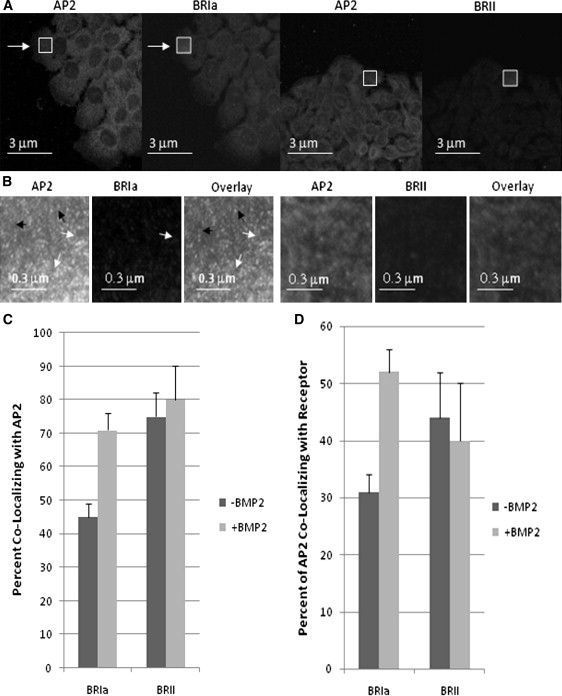
Immunofluorescence staining of A431 cells for BRIa and AP-2. A431 cells were labeled with an antibody against AP2 (β-subunit, green, Transduction Laboratories) and BRIa (Santa Cruz Biotechnology) followed by a conjugated anti-mouse Alexa 488 and Alexa 546 red X conjugated donkey anti-goat antibody (Santa Cruz Biotechnology). (A) Whole cell images, a onefold magnification of A431 cells labeled for AP2 (green), BRIa (red), or BRII (red). (B) High magnified (five times magnification at white box) images of flat regions of the cell membrane. AP2 exists in two populations; the large clusters in the images represent CCPs (white arrows), whereas the small clusters represent nucleation sites of AP2 (black arrows). BRIa is also found in two populations, colocalizing with AP2 (white arrows) or noncolocalizing with AP2 (black arrows). (C) Without BMP2 stimulation 45% of BRIa clusters colocalize with AP-2 clusters. BMP2 stimulation cause an aggregation of BRIa and an increase in the image also shows that AP2 as well as BRIa is present in two populations: one colocalizing with AP-2 and the other independent of AP2 colocalization; ∼75% of BRIa colocalizes AP-2 (p < 0.05). (D) AP2 colocalize with BRIa at 31% without BMP2 stimulation. With BMP2 stimulation it increases to 52%. The colocalization of AP2 to BRII is unchanged with stimulation, from 44% to 40% (p < 0.05).
BRIa and BRII both bound to AP2 in situ
The ICCS data suggested that BMPRs and AP2 colocalized in the same domains, but cannot provide evidence that they physically interacted at the molecular scale. However, lysates of A431 cells immunoprecipitated with antibodies against BRIa or BRII followed by blotting for adaptin β-subunit of AP2 in Western blots showed that they do in fact bind to each other (Fig. 2 A). Blocking peptides were used as a control to show the bands were not due to nonspecific binding. This binding of AP2 to BRIa and BRII is novel. Therefore, we used FRET measurements to further verify that these interactions between AP2 and BMPRs occurred at the cell surface in living cells (Fig. 2 B). Because FRET measures the proximity of two proteins labeled with different chromophores within a range comparable to the dimensions of biological macromolecules (10–100 Å) it can be used to differentiate between proteins that simply colocalize within a domain and those that bind to each other within the domain. The observed energy transfer efficiency was low, but significant at 8.5% for BRIa and AP2 and 10% for BRII and AP2 providing some evidence for direct binding. Significantly, on stimulation with BMP2, the energy transfer efficiency doubled to 17% (p < 0.05) for BRIa and AP2 but remained unaffected for BRII and AP2. This increase in energy transfer could arise from either of two effects—a decrease in the average separation of the chromophores (decrease in R) or an increase in the number of pairs of molecules that interact. The latter is consistent with the observation from ICCS that there was an increase in the number of BRIa and AP2 proteins that interacted in the domains and no change in the number of BRII and AP2 proteins that interacted.
Disruption of CCPs activated the Smad pathway
Because AP2 was functionally involved with the formation of CCPs and bound to the BMPRs, this binding interaction may have a role for BMPR function. Consequently, we used reporter gene assays to measure the effect on activation of Smad in C2C12 cells caused by different modes used to disrupt CCPs. Similar to mesenchymal stem cells, C2C12 cells are pluripotent and can be differentiated into osteoblasts, adipocytes, and myoblasts (34,35). The addition of BMP2 causes the C2C12 cells to differentiate into osteoblasts (36,37). Cells were transfected with pSBE (a plasmid for Smad binding element) and pRL-luc (a plasmid used to normalize the luminescence). Disruption of CCPs was carried out by depletion of potassium and by transfection with mutant plasmids of Eps15 (EH29) or dynamin (K44A). The depletion of intracellular potassium disrupts the coated pits on the surface (38,39). EH29 disrupts the assembly of CCPs and K44A inhibits the endocytosis of CCPs (4,10,19,20,40). All three treatments led to significant (p < 0.05) activation of the BMP pathway as measured by the pSBE activation assay in the absence of BMP2 (Fig. 3 A). Compared to the control, potassium- free medium and EH29 resulted in 2.5-fold increase and K44A led to a four-fold increase of activation of the Smad pathway. Addition of BMP2 led to further activation in most cases, but the effect of BMP2 was less in those cases where the coated pit disruption led to large levels of activation and BMP2 caused no additional activation in the K44A transfected system. The integrity of the CCPs seems to be an important mechanism for controlling the level of activation of this Smad pathway, and it is possible that the AP2 interactions with BRIa and BRII inhibit their constitutive levels of activation of Smad pathways.
Figure 3.
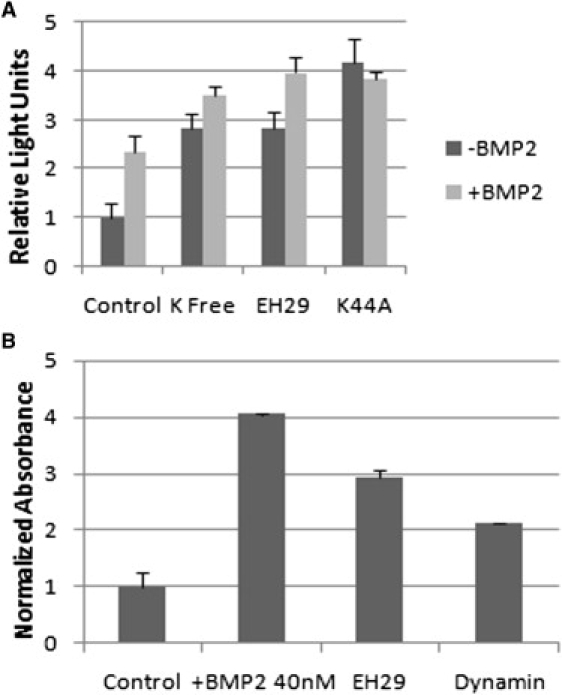
Disruption of CCPs induces BMP2-independent signaling and an early osteoblast marker. (A) C2C12 cells were transfected with the pSBE plasmid that is a reporter sensitive to the Smad signaling pathway, EH29, a mutation of Eps15 protein to prevent CCP formation, or K44A, a dominate negative dynamin to prevent endocytosis (4,10,19,20,40); 4 h after transfection cells were stimulated with or without BMP2 in DMEM, or potassium-free medium. As can be seen the disruption of the CCPs lead to the induction of signaling, even without BMP2 (p < 0.05). Addition of BMP2 after disruption of the CCPs led to a slight increase in signaling and no additional signal was seen with the K44A transfected system. (B) C2C12 cells were transfected either with the mutation of Eps15, EH29, or K44A, dominate negative dynamin, to prevent CCP formation and endocytosis. After 4 h, control cells were either mock or stimulated with BMP2. The ALP activity was increased for BMP2 stimulated cells as well as the cells transfected with plasmids encoding EH29 and K44A (p < 0.05). The data in this graph were verified by three independent experiments.
CCP disruption initiated osteoblast differentiation
Although the Smad pathway is activated with the disruption of CCPs, it is not clear if it could drive osteoblast differentiation. An early marker for osteoblast differentiation is ALP (37,41). Cells were transfected with either EH29 or K44A and the ALP assay was carried out with normalized samples. Alkaline phosphatase activity was increased significantly with the addition of BMP2 compared to control cells without BMP2, a fourfold increase (Fig. 3 B). The transfected cells with either EH29 or K44A to disrupt CCPs also expressed significantly higher ALP. EH29 showed a significantly higher ALP, and K44A showed a higher ALP, threefold and twofold, respectively (Fig. 3 B). The disruption of CCPs with EH29 initiated osteoblast differentiation.
Aggregation of BRIa with disruption of CCPs
The CCPs serve in part to recycle receptors from the cell surface. Disruption of CCPs could lead to an accumulation of expressed BRIa (or BRII) at the cell surface causing the higher level of activity. To address this, high resolution confocal images of the membrane surface were taken of C2C12 cells labeled for BRIa after treatment with potassium-free medium. Then ICS analysis was carried out to calculate the relative number of BRIa molecules at the membrane and their distribution. The relative expression levels, as measured by total fluorescence intensities, were unaffected by potassium depletion (Fig. 4 A). However, the distribution was altered significantly (Fig. 4 B) because the potassium depletion caused a threefold decrease in the cluster density. These observations showed that it is not the total number of BRIa proteins, but their distribution on the surface that is affected by the disruption of the CCPs. We concluded, therefore, that the BMP2-independent activation of Smad caused by disruption of the CCP was caused by a further aggregation of BRIa into a smaller number of larger clusters. It is possible that the AP2-BRIa interaction in the CCP serves to prevent BRIa-BRIa interactions that could lead to constitutively active receptors with no sensitivity to BMPs.
Figure 4.
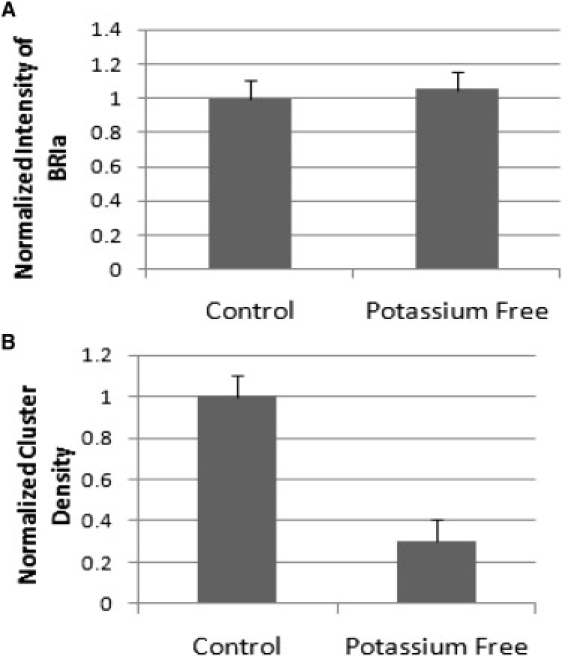
Surface BRIa aggregation altered due to disruption of CCPs. Unstimulated C2C12 cells were fixed and antibodies, polyclonal goat anti BRIa followed by Alexa 546, were used to label BRIa. Three ×40 images were collected after treatment as indicated. The images were subjected to ICS analysis. (A) No significant reduction or increase in the protein expression at the cell surface of BRIa compared to control was observed. (B) Normalized results to the control value indicated BRIa cluster density decreased with the treatment of potassium-free media.
Discussion
The mechanisms responsible for BMP activation at the membrane-receptor level are poorly understood. It seems that BMPRs must move and rearrange on the membrane surface to transduce their signal. Previous studies showed that BRIa and BRII are partly localized in caveolae (16). The CAV-1 β-isoform was shown to inhibit BMP signaling, whereas the CAV-1 α-isoform did not affect signaling in A431 cells. Although 25% of BRII and 40% of BRIa shuttle between these different isoforms to transduce a signal (16), there remains a high percentage of clustered BMPRs that are not present in caveolae domains. This raises the question of the involvement of other distinct domains such as CCPs in the activation, inactivation or silencing of the receptors.
Both BRIa and BRII colocalize with AP2 without BMP stimulation to the extent of 45% and 75%, respectively. These results indicate that these receptors are found within CCPs regardless of activation status. However, on BMP2 stimulation there is an increase of BRIa colocalization with AP2 to 70% suggesting a role for CCPs in BMP signaling. BMP2 stimulation had no effect on the colocalization of BRII with AP2.
Direct interactions of AP2 with BRIa and BRII were shown with immunoprecipitation studies followed by Western blots. FRET data confirmed that these interactions occur at the cell surface in the living cell. Because there is a change in the FRET efficiency that parallels the change in association, this provides evidence that the FRET occurs between molecules within the CCPs. The observation that the energy transfer increases for the AP2-BRIa but not for the AP2-BRII when BMP2 is added qualitatively similar to the observation that the extent of colocalization of AP2 and BRIa increases whereas that of AP2-BRII does not. This is consistent with the conclusion that the interactions between these molecules occur within the coated pit at the molecular level. The first step of clathrin-mediated endocytosis is formation of nucleation sites by AP2 to recruit receptors (21,22). Eps15 protein binds AP2 and is involved with the assembly mechanism and early steps of endocytosis of CCPs. Targeting of Eps15 to CCPs is due to the three EH (Eps15 homology) domains located at the N-terminal along with a still unknown domain. Mutant EH29 lacks both the EH-2 and EH-3 domains resulting in specific inhibition of CCP assembly and endocytosis. The second step is recruitment of clathrin to form pits. The final step is dynamin pinching of the membrane to form early endosomes (19–21). Overexpressing the mutant dynamin K44A inhibits the pinching off of the membrane therefore blocking endocytosis (4,10). Disrupting the assembly of CCPs by potassium-free media and EH29, and endocytosis with K44A caused a BMP-independent activation of the BMP pathway that leads to osteoblast differentiation. The osteoblast differentiation was measured with ALP. The transfected cells with plasmids EH29 and K44A had increased ALP activation. These data indicate that the nucleation sites and the endocytosis of BMPRs by CCPs are necessary for the silencing of BMP pathway and therefore affect the differentiation of osteoblasts.
There has been conflicting published results of the role of CCP with BMP signaling (4,17,18). In this study, we found CCPs negatively regulate the Smad pathway. Supporting this is the disruption of CCPs decreases the time it takes for Smad1 to translocate to the nucleus (17). Disparities between our results and other published results were a large concern of ours and needed to be addressed. Disruption of CCPs of SHED cells did not show a BMP independent signal, and furthermore decreased ID1 expression (a marker for osteoblasts) (18). The differences of results are likely due to the use of different cell lines and BMPs. The various BMPs do elicit dissimilar effects of ALP, another marker for osteoblasts (42). A second study measured Smad phosphorylation with CCP disruption. It was unaltered, but the transcriptional effect was decreased. We used more specific methods of disruption compared to the other studies; it is possible this accounts for the differences. To make sure our methods did not increase the amount of BRIa at the cell surface, we quantified the intensity of BRIa. The intensities of BRIa were not significantly different compared with the control. Therefore, the signaling results expressed are not due to an increase amount of BRIa at the cell surface, but due to the disruption of CCPs.
Disruption of CCPs altered the state of aggregation of BRIa causing fewer and larger aggregates. It is possible the aggregation of BRIa is linked to BMP-independent signaling. The fact that there is a correlation between the extent of aggregation and the extent of activation (comparing control to potassium depletion) supports this linkage.
Our data indicate that BMP receptor aggregation and distribution is regulated on the cell surface. This aggregation is crucial for the activation of downstream signaling. Additionally, the ability to elicit a signal depends on shuttling receptors between multiple membrane domains. Fig. 5 is a model of BMP2 induced receptor reorganization at the cell surface to achieve a proper Smad response. In the absence of BMP2, surface BRII are localized to membrane domains: caveolae αβ population (10%), β-population (15%), and CCPs (74%); ∼45% of BRIa colocalizes with CCPs. BRII recruits BRIa from Cav-1αβ to Cav-1β domains. Cav-1β binds to BRII inhibiting the phosphorylation of BRIa and activation of the Smad pathway. Addition of BMP2 and its binding to BRIa and BRII initiates the release of Cav-1β and BRII. The BRII is redistributed to Cav-1αβ and BRIa is shuttled to Cav-1αβ and CCPs. Although these data are specific for BMP2 signaling, it may represent a more general model system for receptor organization in the plasma membrane and contribute to our understanding of how receptor and membrane microdomain dynamics influence a specific response.
Figure 5.
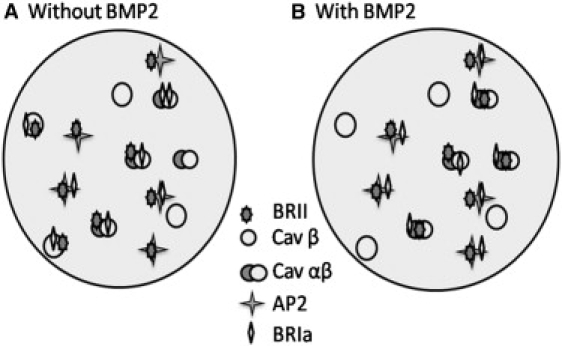
Signaling model for the reshuttling of BMRs. Diagram model characterizes the BMPRs, BRIa, and BRII, shuttling between membrane domains, caveolae and CCP. CCPs are represented by AP2 (four point star) and caveolae are differentiated by either caveolin α- and β-isoform (overlapping circles) or caveolin β-isoform only (one circle). (A) In absence of BMP2, BRII is localized to caveolae enriched in α- and β-isoforms (10%), caveolae enriched in the β-isoform only (15%), and the majority in CCPs (74%). BRIa localizes mostly to CCPs (55%). An overexpression of BRII caused BRIa to migrate from caveolae of α- and β-isoforms into caveolae of the β-isoform (18%). This prevents the activation of the Smad pathway. (B) On BMP2 stimulation a redistribution of receptors occurs. BRIa and BRII shuttle from caveolae enriched in β-isoforms into caveolae of the α- and β-isoforms for proper Smad signaling. Building on this previous model, BRIa does localize to CCPs (71%). No significant change was seen with localization between BRII and CCPs.
References
- 1.Singhatanadgit W., Mordan N., Salih V., Olsen I. Changes in bone morphogenetic protein receptor-IB localization regulate osteogenic responses of human bone cells to bone morphogenetic protein-2. Int. J. Biochem. Cell Biol. 2008;40:2854–2864. doi: 10.1016/j.biocel.2008.06.005. [DOI] [PubMed] [Google Scholar]
- 2.Itoh S., Itoh F., Goumans M.J., Ten Dijke P. Signaling of transforming growth factor-beta family members through Smad proteins. Eur. J. Biochem. 2000;267:6954–6967. doi: 10.1046/j.1432-1327.2000.01828.x. [DOI] [PubMed] [Google Scholar]
- 3.Wertz J.W., Bauer P.M. Caveolin-1 regulates BMPRII localization and signaling in vascular smooth muscle cells. Biochem. Biophys. Res. Commun. 2008;375:557–561. doi: 10.1016/j.bbrc.2008.08.066. [DOI] [PubMed] [Google Scholar]
- 4.Hartung A., Bitton-Worms K., Rechtman M.M., Wenzel V., Boergermann J.H. Different routes of bone morphogenic protein (BMP) receptor endocytosis influence BMP signaling. Mol. Cell. Biol. 2006;26:7791–7805. doi: 10.1128/MCB.00022-06. [DOI] [PMC free article] [PubMed] [Google Scholar]
- 5.Mishra L., Marshall B. Adaptor proteins and ubiquinators in TGF-beta signaling. Cytokine Growth Factor Rev. 2006;17:75–87. doi: 10.1016/j.cytogfr.2005.09.001. [DOI] [PubMed] [Google Scholar]
- 6.Chang H., Brown C.W., Matzuk M.M. Genetic analysis of the mammalian transforming growth factor-beta superfamily. Endocr. Rev. 2002;23:787–823. doi: 10.1210/er.2002-0003. [DOI] [PubMed] [Google Scholar]
- 7.Allendorph G.P., Isaacs M.J., Kawakami Y., Belmonte J.C., Choe S. BMP-3 and BMP-6 structures illuminate the nature of binding specificity with receptors. Biochemistry. 2007;46:12238–12247. doi: 10.1021/bi700907k. [DOI] [PubMed] [Google Scholar]
- 8.Murphy C. Endo-fin-ally a SARA for BMP receptors. J. Cell Sci. 2007;120:1153–1155. doi: 10.1242/jcs.008102. [DOI] [PubMed] [Google Scholar]
- 9.Gazzerro E., Canalis E. Bone morphogenetic proteins and their antagonists. Rev. Endocr. Metab. Disord. 2006;7:51–65. doi: 10.1007/s11154-006-9000-6. [DOI] [PubMed] [Google Scholar]
- 10.Sugimori K., Matsui K., Motomura H., Tokoro T., Wang J. BMP-2 prevents apoptosis of the N1511 chondrocytic cell line through PI3K/Akt-mediated NF-kappaB activation. J. Bone Miner. Metab. 2005;23:411–419. doi: 10.1007/s00774-005-0622-7. [DOI] [PubMed] [Google Scholar]
- 11.Lemonnier J., Ghayor C., Guicheux J., Caverzasio J. Protein kinase C-independent activation of protein kinase D is involved in BMP-2-induced activation of stress mitogen-activated protein kinases JNK and p38 and osteoblastic cell differentiation. J. Biol. Chem. 2004;279:259–264. doi: 10.1074/jbc.M308665200. [DOI] [PubMed] [Google Scholar]
- 12.Lou J., Tu Y., Li S., Manske P.R. Involvement of ERK in BMP-2 induced osteoblastic differentiation of mesenchymal progenitor cell line C3H10T1/2. Biochem. Biophys. Res. Commun. 2000;268:757–762. doi: 10.1006/bbrc.2000.2210. [DOI] [PubMed] [Google Scholar]
- 13.Kretzschmar M., Doody J., Massague J. Opposing BMP and EGF signaling pathways converge on the TGF-beta family mediator Smad1. Nature. 1997;389:618–622. doi: 10.1038/39348. [DOI] [PubMed] [Google Scholar]
- 14.Thomsen G.H. Antagonism within and around the organizer: BMP inhibitors in vertebrate body patterning. Trends Genet. 1997;13:209–211. doi: 10.1016/S0168-9525(97)01117-7. [DOI] [PubMed] [Google Scholar]
- 15.Thomas C.M., Smart E.J. Caveolae structure and function. J. Cell. Mol. Med. 2008;12:796–809. doi: 10.1111/j.1582-4934.2008.00295.x. [DOI] [PMC free article] [PubMed] [Google Scholar]
- 16.Nohe A., Keating E., Underhill T.M., Knaus P., Petersen N.O. Dynamics and interaction of caveolin-1 isoforms with BMP-receptors. J. Cell Sci. 2005;118:643–650. doi: 10.1242/jcs.01402. [DOI] [PubMed] [Google Scholar]
- 17.Rauch C., Brunet A.C., Deleule J., Farge E. C2C12 myoblast/osteoblast transdifferentiation steps enhanced by epigenetic inhibition of BMP2 endocytosis. Am. J. Physiol. Cell Physiol. 2002;283:C235–C243. doi: 10.1152/ajpcell.00234.2001. [DOI] [PubMed] [Google Scholar]
- 18.Billings P.C., Fiori J.L., Bentwood J.L., O'Connell M.P., Jiao X. Dysregulated BMP signaling and enhanced osteogenic differentiation of connective tissue progenitor cells from patients with fibrodysplasia ossificans progressiva (FOP) J. Bone Miner. Res. 2008;23:305–313. doi: 10.1359/JBMR.071030. [DOI] [PMC free article] [PubMed] [Google Scholar]
- 19.Benmerah A., Bayrou M., Cerf-Bensussan N., Dautry-Varsat A. Inhibition of clathrin-coated pit assembly by an Eps15 mutant. J. Cell Sci. 1999;112:1303–1311. doi: 10.1242/jcs.112.9.1303. [DOI] [PubMed] [Google Scholar]
- 20.Benmerah A., Poupon V., Cerf-Bensussan N., Dautry-Varsat A. Mapping of Eps15 domains involved in its targeting to clathrin-coated pits. J. Biol. Chem. 2000;275:3288–3295. doi: 10.1074/jbc.275.5.3288. [DOI] [PubMed] [Google Scholar]
- 21.Ungewickell E.J., Hinrichsen L. Endocytosis: clathrin-mediated membrane budding. Curr. Opin. Cell Biol. 2007;19:417–425. doi: 10.1016/j.ceb.2007.05.003. [DOI] [PubMed] [Google Scholar]
- 22.Le Roy C., Wrana J.L. Clathrin- and non-clathrin-mediated endocytic regulation of cell signaling. Nat. Rev. Mol. Cell Biol. 2005;6:112–126. doi: 10.1038/nrm1571. [DOI] [PubMed] [Google Scholar]
- 23.Cupers P., Jadhav A.P., Kirchhausen T. Assembly of clathrin coats disrupts the association between Eps15 and AP-2 adaptors. J. Biol. Chem. 1998;273:1847–1850. doi: 10.1074/jbc.273.4.1847. [DOI] [PubMed] [Google Scholar]
- 24.Brown C.M., Petersen N.O. An image correlation analysis of the distribution of clathrin associated adaptor protein (AP-2) at the plasma membrane. J. Cell Sci. 1998;111:271–281. doi: 10.1242/jcs.111.2.271. [DOI] [PubMed] [Google Scholar]
- 25.Nohe A., Petersen N.O. Image correlation spectroscopy. Sci. STKE. 2007 doi: 10.1126/stke.4172007pl7. 2007:pl7. [DOI] [PubMed] [Google Scholar]
- 26.Nohe A., Petersen N.O. Analyzing for colocalization of proteins at a cell membrane. Curr. Pharm. Biotechnol. 2004;5:213–220. doi: 10.2174/1389201043376931. [DOI] [PubMed] [Google Scholar]
- 27.Nohe A., Petersen N.O. Analyzing protein-protein interactions in cell membranes. Bioessays. 2004;26:196–203. doi: 10.1002/bies.10380. [DOI] [PubMed] [Google Scholar]
- 28.Nohe A., Keating E., Underhill T.M., Knaus P., Petersen N.O. Effect of the distribution and clustering of the type I A BMP receptor (ALK3) with the type II BMP receptor on the activation of signaling pathways. J. Cell Sci. 2003;116:3277–3284. doi: 10.1242/jcs.00519. [DOI] [PubMed] [Google Scholar]
- 29.Kenworthy A.K. Imaging protein-protein interactions using fluorescence resonance energy transfer microscopy. Methods. 2001;24:289–296. doi: 10.1006/meth.2001.1189. [DOI] [PubMed] [Google Scholar]
- 30.Sorkin A., McClure M., Huang F., Carter R. Interaction of EGF receptor and grb2 in living cells visualized by fluorescence resonance energy transfer (FRET) microscopy. Curr. Biol. 2000;10:1395–1398. doi: 10.1016/s0960-9822(00)00785-5. [DOI] [PubMed] [Google Scholar]
- 31.DiPilato L.M., Cheng X., Zhang J. Fluorescent indicators of cAMP and Epac activation reveal differential dynamics of cAMP signaling within discrete subcellular compartments. Proc. Natl. Acad. Sci. USA. 2004;101:16513–16518. doi: 10.1073/pnas.0405973101. [DOI] [PMC free article] [PubMed] [Google Scholar]
- 32.Westphal A.H., Matorin A., Hink M.A., Borst J.W., van Berkel W.J. Real-time enzyme dynamics illustrated with fluorescence spectroscopy of p-hydroxybenzoate hydroxylase. J. Biol. Chem. 2006;281:11074–11081. doi: 10.1074/jbc.M600609200. [DOI] [PubMed] [Google Scholar]
- 33.Weston A.D., Rosen V., Chandraratna R.A., Underhill T.M. Regulation of skeletal progenitor differentiation by the BMP and retinoid signaling pathways. J. Cell Biol. 2000;148:679–690. doi: 10.1083/jcb.148.4.679. [DOI] [PMC free article] [PubMed] [Google Scholar]
- 34.Pohl F., Hassel S., Nohe A., Flentje M., Knaus P. Radiation-induced suppression of the Bmp2 signal transduction pathway in the pluripotent mesenchymal cell line C2C12: an in vitro model for prevention of heterotopic ossification by radiotherapy. Radiat. Res. 2003;159:345–350. doi: 10.1667/0033-7587(2003)159[0345:risotb]2.0.co;2. [DOI] [PubMed] [Google Scholar]
- 35.Yanagisawa M., Suzuki N., Mitsui N., Koyama Y., Otsuka K. Effects of compressive force on the differentiation of pluripotent mesenchymal cells. Life Sci. 2007;81:405–412. doi: 10.1016/j.lfs.2007.06.004. [DOI] [PubMed] [Google Scholar]
- 36.Yamamoto N., Akiyama S., Katagiri T., Namiki M., Kurokawa T. Smad1 and smad5 act downstream of intracellular signalings of BMP-2 that inhibits myogenic differentiation and induces osteoblast differentiation in C2C12 myoblasts. Biochem. Biophys. Res. Commun. 1997;238:574–580. doi: 10.1006/bbrc.1997.7325. [DOI] [PubMed] [Google Scholar]
- 37.Katagiri T., Yamaguchi A., Komaki M., Abe E., Takahashi N. Bone morphogenetic protein-2 converts the differentiation pathway of C2C12 myoblasts into the osteoblast lineage. J. Cell Biol. 1994;127:1755–1766. doi: 10.1083/jcb.127.6.1755. [DOI] [PMC free article] [PubMed] [Google Scholar]
- 38.Altankov G., Grinnell F. Depletion of intracellular potassium disrupts coated pits and reversibly inhibits cell polarization during fibroblast spreading. J. Cell Biol. 1993;120:1449–1459. doi: 10.1083/jcb.120.6.1449. [DOI] [PMC free article] [PubMed] [Google Scholar]
- 39.Sieczkarski S.B., Whittaker G.R. Dissecting virus entry via endocytosis. J. Gen. Virol. 2002;83:1535–1545. doi: 10.1099/0022-1317-83-7-1535. [DOI] [PubMed] [Google Scholar]
- 40.Damke H., Baba T., Warnock D.E., Schmid S.L. Induction of mutant dynamin specifically blocks endocytic coated vesicle formation. J. Cell Biol. 1994;127:915–934. doi: 10.1083/jcb.127.4.915. [DOI] [PMC free article] [PubMed] [Google Scholar]
- 41.Bain G., Muller T., Wang X., Papkoff J. Activated beta-catenin induces osteoblast differentiation of C3H10T1/2 cells and participates in BMP2 mediated signal transduction. Biochem. Biophys. Res. Commun. 2003;301:84–91. doi: 10.1016/s0006-291x(02)02951-0. [DOI] [PubMed] [Google Scholar]
- 42.Kang Q., Sun M.H., Cheng H., Peng Y., Montag A.G. Characterization of the distinct orthotopic bone-forming activity of 14 BMPs using recombinant adenovirus-mediated gene delivery. Gene Ther. 2004;11:1312–1320. doi: 10.1038/sj.gt.3302298. [DOI] [PubMed] [Google Scholar]