Abstract
Purpose
To evaluate how spectral tilt changes in perceptual importance when formant information is degraded by sensorineural hearing loss.
Method
Eighteen listeners with mild to moderate hearing loss (HI listeners) and 20–23 listeners with normal hearing (NH listeners) identified synthesized stimuli that varied in second formant (F2) frequency and spectral tilt. Experiments 1 and 2 examined utterance-initial stops (/ba/ and /da/) and Experiments 3 and 4 examined medial stops (/aba/ and /ada/). Spectral tilt was manipulated at either consonant onset (Experiments 1 and 3), vowels (Experiments 2 and 4), or both (Experiment 5).
Results
Regression analysis revealed that HI listeners weighted F2 substantially less than NH listeners. There was no difference in absolute tilt weights between groups. However, HI listeners emphasized tilt as much as F2 for medial stops. NH listeners weighted tilt primarily when F2 was ambiguous, whereas HI listeners weighted tilt significantly more than NH listeners on unambiguous F2 endpoints.
Conclusions
Attenuating changes in spectral tilt can be as deleterious as taking away F2 information for HI listeners. Recordings through a wide-dynamic range compression hearing aid show compromised spectral tilt change, compressed in range by up to 50%.
I. INTRODUCTION
Limited available evidence suggests that the perceptual salience of spectrally local changes in formant frequency is diminished in listeners with sensorineural hearing loss (SNHL), but spectrally global attributes are better preserved, including duration of frication noise, duration of formant transitions, duration of silence intervals, spectral tilt (i.e., relative balance between the intensity of low- and high-frequency energy), and abruptness of frequency change Dorman et al., 1985; Lindholm et al., 1988). Relatively little is known about the role of spectrally global attributes in speech perception by listeners with normal hearing (NH), and even less is known about their role in speech perception by listeners with hearing impairment (HI). In comparison, the perceptual consequences of formant frequency manipulation, especially the first two formants (F1 and F2, respectively), have been the focus of most speech perception research since the invention of speech synthesizers. However, HI listeners have compromised access to frequency-specific information because spectral detail of formant peaks is often smeared by broadened auditory filters (e.g., Tyler et al., 1984; Glasberg and Moore, 1986; Dubno and Dirks, 1989; Peters and Moore, 1992; Leek and Summers, 1993; Sommers and Humes, 1993). Because only an abstract characterization of the spectrum is necessary to encode gross spectral properties, they likely take on greater importance in speech perception for HI listeners. The purpose of this report is to determine relative importance of spectrally local and global attributes, specifically formant frequency and spectral tilt, as cues to stop consonants differing in place of articulation the source of greatest confusion for HI listeners (e.g., Bilger and Wang, 1976; Turek et al., 1980; Dubno et al., 1982).
The importance of spectral tilt of vowels and consonants in normal-hearing perception has a long and conflicting history (for review, see Alexander and Kluender, 2008; Kiefte and Kluender, 2005; and Dubno et al., 1987). Differences in the spectral tilt of steady-state vowels (Ito et al., 2001; Kiefte and Kluender, 2005) and in the bursts and voicing onsets of syllable-initial stops (e.g., Blumstein and Stevens, 1979) have been shown to serve as cues for place of articulation. Stevens and Blumstein were among the first to advance strong claims for the importance of spectral tilt (e.g., 1978; 1981; Blumstein and Stevens, 1979; 1980). They advanced a strong argument that an invariant acoustic marker for place of articulation in stop consonants can be found by integrating the first 25 milliseconds of energy following onset of the stop burst. Stevens and Blumstein argued that the spectral shape of this onset spectrum determined perception of place of articulation. Specifically, in a pre-emphasized signal (+6 dB/oct.), a labial place of articulation is characterized by a “diffuse-falling spectrum” (i.e., negative spectral tilt), an alveolar place of articulation by a “diffuse-rising spectrum” (i.e., positive spectral tilt), and a velar place of articulation by a “prominent midfrequency spectral peak.” Claims of invariance were undermined in part by the failure of spectral shape to classify accurately stops in Malayalam and French (Lahiri et al., 1984) and by conflicting cue experiments demonstrating that onset frequencies of formant transitions influenced perception of stop consonants much more than absolute spectral tilt (Blumstein et al., 1982; Walley and Carrell, 1983). However, these negative findings do not diminish the importance of spectral tilt in speech perception. We hypothesize that the perceptual importance of a particular acoustic attribute of speech is at least related to 1) its reliability to distinguish phonemes across speech contexts, 2) listeners’ sensitivity to it, and 3) the presence of other acoustic attributes. Therefore, while spectral tilt information might be less reliable than formant information across contexts, HI listeners might rely more on tilt because they are relatively less sensitive to the differences in formant frequency, just as NH listeners rely on tilt when other cues are absent or neutral (Alexander and Kluender, 2008).
Important to this hypothesis, in a conflicting cue experiment Lindholm et al. (1988) crossed three levels of formant transitions and three levels of onset spectra tilt, each appropriate for [bæ], [dæ], and [gæ] (diffuse falling, diffuse rising, and mid-frequency peak, respectively). This matrix was crossed with two levels of frequency change, abrupt and non-abrupt, referring to the duration with which onset formant frequencies and spectral tilt were held constant before transitioning into the following vowel. Compared to NH listeners, HI listeners relied more on tilt of onset spectra and less on the frequencies of the formant transitions in the classification of voiced stop consonants.
Dubno et al. (1987) entertained another way in which SNHL might influence perception of stop consonants and other phonemes differing in spectral tilt. They noted that HI listeners with sloping, high-frequency hearing loss experience an acoustic environment skewed toward negative spectral tilt. They suggest that cues provided by spectral tilt in stop consonant onsets are distorted for listeners with a high-frequency hearing loss compared to NH listeners and to HI listeners with a flat audiometric configuration. Presumably, listeners with this configuration of hearing loss would be more likely to perceive stop consonants as having a labial place of articulation, which is associated with a negative spectral tilt.
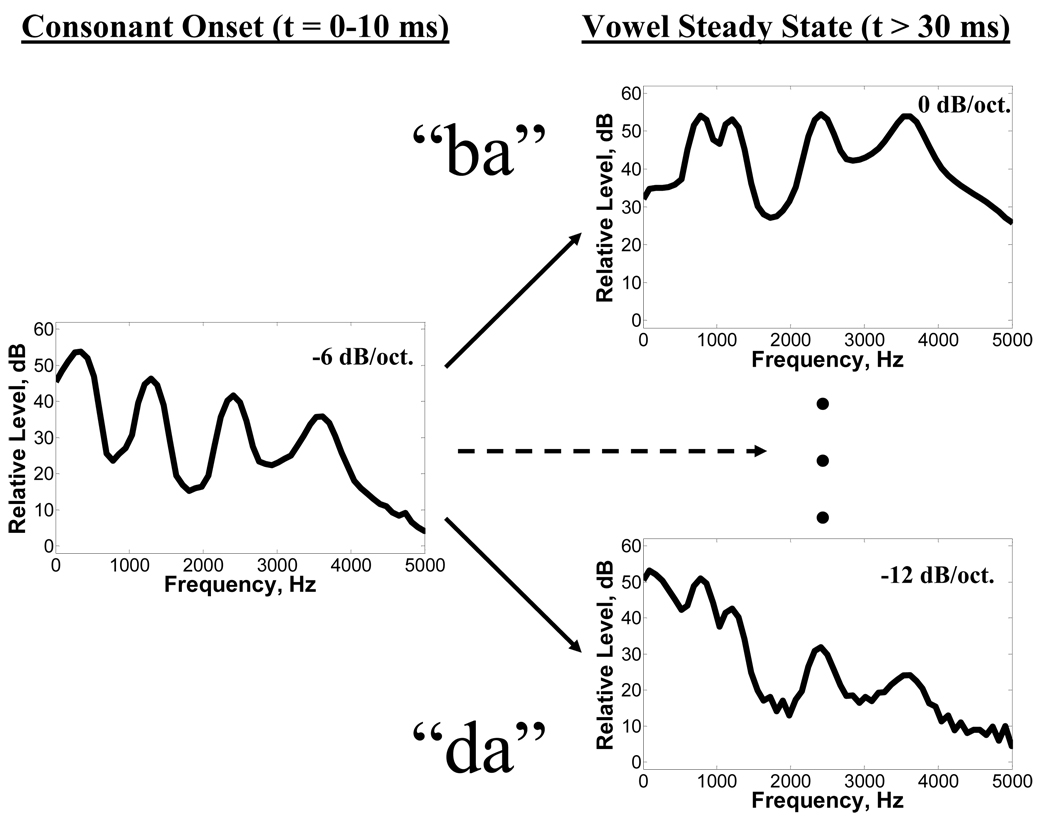
However, as Alexander and Kluender (2008) have shown, the important feature of spectral tilt is how it changes over time across speech segments. They synthesized a consonant vowel (CV) series that varied perceptually from /ba/ to /da/ and acoustically in onset frequency of the F2 transition.1 Spectral tilt was also manipulated along a series. In one experiment, consonant onset tilt was varied from −12 to 0 dB/oct., which transitioned over 30 ms to a common vowel tilt (−6 dB/oct.). In another experiment, the following vowel tilt was varied from −12 to 0 dB/oct. following a common onset tilt (−6 dB/oct.). Results of these experiments were complementary. A negative (steeper) onset tilt relative to vowel tilt encouraged perception of /ba/ and a positive (shallower) onset tilt relative to vowel tilt encouraged perception of /da/. They also found that relative spectral tilt change was only influential when formant information was ambiguous between /ba/ and /da/, when formant frequencies were intermediate between the endpoints. Moreover, cues provided by spectral tilt are not necessarily distorted by high-frequency SNHL as suggested by Dubno et al. (1987) because, as Alexander and Kluender (2008) clearly demonstrated, perception of tilt is relative, not absolute. When spectral tilt was held constant across each CV, but varied across trials over a wide range (−12 dB to +6 dB/oct), there was no effect of absolute tilt on identification by NH listeners. This makes ecological sense because absolute spectral tilt can vary as a function of a speaker’s vocal characteristics and emotional state as well as the transmission channel characteristics (e.g., room acoustics). Therefore, if the perceived change in tilt imposed by the hearing impairment is constant, HI listeners should maintain perceptual constancy as tilt relations are preserved. In much the same way, we expect that the high-frequency gain provided by a linear hearing aid should not alter perception because tilt differences remain across speech segments, albeit shifted up by several dB/oct.
HI listeners are expected to use spectral tilt to the extent that they can perceive a change in level across frequency. In a profile analysis experiment conducted by Lentz and Leek (2002) in which listeners compared the level of a target tone relative to a group of four background tones, all widely spaced in frequency, HI listeners had similar thresholds as NH listeners for increment detection. HI listeners also had similar thresholds (a few dB) as NH listeners when detecting an increment on the lower or upper half of a spectrum consisting of six widely spaced components (Lentz and Leek, 2003). These results suggest that HI listeners should have little difficulty detecting differences in tilt spanning 12 dB/oct., as found in natural speech. Because one only needs to compare the relative level of two spectral regions, changes in tilt should be more salient than changes in formant frequency, which require sensitivity to the pattern of level differences or spectral shape across a small group of harmonics. Profile analysis for closely spaced tones (e.g., harmonics with a fundamental frequency in the speech range) more closely approximates formant peak discrimination. Unlike findings of Lentz and Leek (2002, 2003), spectral smearing associated with broadened auditory filters has been shown to negatively influence HI listeners’ ability to discriminate the shapes of more spectrally dense stimuli (Summers and Leek, 1994; Leek and Summers, 1996).
Experiments in this report utilized HI listeners to replicate the experiments reported using NH listeners in Alexander and Kluender (2008). These experiments differed from previous investigations of effects of SNHL on the importance of formant frequency and gross spectral information in several important ways. First, unlike Lindholm et al. (1988) who tested only endpoint stimuli, we manipulated formant frequency and spectral tilt along a series with several intermediate values between the endpoints. This is important because, as Alexander and Kluender (2008) demonstrated, secondary cues like tilt are most influential when formant information is ambiguous. Unambiguous formant information is perhaps an exception more than a rule because fluent speech is imprecise and because competing sources reduce the signal-to-noise ratio of formant peaks. Second, unlike most other investigations, we manipulated spectral tilt outside the Klatt synthesizer because only a crude metric of relative tilt is possible given practical difficulties in generating different tilts via formant amplitude manipulation in the parallel branch of the Klatt synthesizer (Klatt, 1980). Because the skirts of the formant filters overlap, the amplitude of a particular formant peak is dependent on the changing frequencies and/or amplitudes of the other formants.2
In the following series of experiments, we evaluated the extent to which perceptual importance of spectral tilt is altered when formant information is degraded by SNHL. Given Alexander and Kluender’s (2008) findings, we hypothesized that tilt would be a more influential cue for HI listeners than NH listeners especially for stimuli in which F2 onset is intermediate between a labial and an alveolar place of articulation. We tested this using synthesized burstless /ba/ to /da/ and /aba/ to /ada/ matrices that varied acoustically in F2 onset frequency (the primary frequency-specific feature that distinguishes these pairs) and tilt of the formant transitions. In Experiment 1, F2 onset frequency manipulations were combined with manipulations of onset tilt, both of which transitioned to a common vowel F2 frequency and tilt. Steeper tilts at onset relative to vowel tilt (more negative) should encourage perception of /ba/ and shallower tilts at onset (more positive) should encourage perception of /da/. In Experiment 2, F2 onset frequency manipulations were combined with manipulations of the following vowel tilt, which originated from a common onset tilt. This time, steeper vowel tilts should encourage perception of /da/ and shallower vowel tilts should encourage perception of /ba/ because change in tilt is negative in the former case and positive in the latter case. Experiments 3 and 4 further explored the importance spectral tilt change in HI listeners using a VCV context that was created by preceding the stimuli in Experiments 1 and 2, respectively, with the same vowel [a] as the final vowel. We hypothesized that influence of spectral tilt change associated with consonant onset will be enhanced and that perception of /b/ and /d/ will follow. Finally, Experiment 5 tested whether HI listeners, because of long-standing high-frequency hearing loss, were influenced by differences in speech stimuli that varied in absolute tilt across trials (without any cues from tilt change).
II. EXPERIMENT 1: Effect of onset tilt on CV perception
A. Methods
1. Listeners
Eighteen HI listeners (nine male, nine female) 44–86 years old (median age of 74.5) participated in the study. Standard audiometric testing, including air and bone conduction was carried out for each listener using a Type II diagnostic audiometer with TDH 39 headphones (ANSI S3.6-1996) to verify that they had mild to moderate SNHL in their test ears and minimal conductive hearing loss (i.e., differences between air and bone conduction thresholds were 10 dB or less). When both ears fit the inclusion criteria for the HI group, the right ear was used as the test ear. Hearing thresholds were also obtained at octave and inter-octave frequencies for the test ear using the audiometer and the test earphone, a Beyerdynamic DT150. Hearing thresholds (re: mean threshold for 10 NH listeners, 20 ears) are shown for each listener in Table I.
Table I.
Listeners’ age, test ear, whether they were regular hearing aid users, and their thresholds for tone detection in dB HL (re: twenty ears with normal hearing) using the Beyerdynamic DT150 headphones.
| Threshold, dB (re: 20 ears with normal hearing) |
|||||||||||
|---|---|---|---|---|---|---|---|---|---|---|---|
| Listener | Age | Ear | Aid? | 250 | 500 | 750 | 1000 | 1500 | 2000 | 3000 | 4000 |
| HI 04 | 74 | L | Y | 18 | 16 | 17 | 53 | 58 | 60 | 60 | 68 |
| HI 05 | 86 | L | Y | 23 | 21 | 37 | 43 | 58 | 55 | 55 | 58 |
| HI 08 | 80 | L | Y | 33 | 26 | 27 | 43 | 43 | 45 | 55 | 58 |
| HI 12 | 59 | R | Y | 23 | 26 | 27 | 33 | 48 | 55 | 55 | 68 |
| HI 13 | 61 | R | N | 13 | 21 | 17 | 13 | 28 | 35 | 40 | 28 |
| HI 14 | 57 | R | N | 13 | 6 | 2 | 13 | 33 | 35 | 40 | 38 |
| HI 15 | 60 | R | Y | 13 | 26 | 27 | 33 | 48 | 45 | 45 | 53 |
| HI 16 | 81 | R | Y | 53 | 51 | 42 | 43 | 43 | 45 | 55 | 53 |
| HI 17 | 79 | R | N | 8 | 11 | 7 | 13 | 38 | 45 | 55 | 68 |
| HI 18 | 53 | R | Y | 23 | 36 | 52 | 58 | 73 | 65 | 60 | 73 |
| HI 19 | 77 | L | N | 18 | 11 | 17 | 23 | 43 | 45 | 40 | 23 |
| HI 20 | 78 | R | Y | 18 | 16 | 12 | 38 | 43 | 45 | 65 | 73 |
| HI 21 | 76 | R | N | 13 | 11 | 7 | 8 | 28 | 30 | 45 | 48 |
| HI 22 | 44 | L | N | 33 | 31 | 27 | 23 | 43 | 45 | 55 | 48 |
| HI 23 | 75 | L | N | 18 | 16 | 17 | 18 | 33 | 30 | 55 | 63 |
| HI 24 | 70 | R | N | 18 | 16 | 17 | 18 | 38 | 30 | 30 | 33 |
| HI 25 | 76 | R | N | 28 | 21 | 17 | 18 | 28 | 20 | 50 | 43 |
| HI 26 | 63 | R | N | 23 | 16 | 17 | 13 | 33 | 55 | 50 | 48 |
| Mean | 69.4 | 21.4 | 21.4 | 21.2 | 28.0 | 42.0 | 43.8 | 50.3 | 52.5 | ||
2. Stimuli
A burstless CV series varying from [ba] to [da] was synthesized at a sampling rate of 22,050 Hz with 16 bits of resolution and with a 5-ms update rate using the parallel branch of the Klatt synthesizer (Klatt and Klatt, 1990). The CV’s were 250 ms in total duration, including 30- ms formant transitions with a linear amplitude rise of 6 dB. Fundamental frequency was 100 Hz decreasing to 90 Hz during the final 50 ms. During the formant transitions, F1 increased from 300 Hz to 800 Hz while F2 increased or decreased from one of eight onset frequencies (1000, 1100, …, 1700 Hz) to 1200 Hz at vowel steady state. F3 and F4 were constant throughout the stimulus duration at 2400 and 3600 Hz, respectively. Formant amplitudes in the synthesizer were manipulated so that each CV had a reasonably constant spectral tilt of −3 dB/oct. throughout its duration (see Alexander and Kluender, 2008). Parametric manipulations of tilt were handled outside of the synthesizer using digital filters (see below). Formant frequency and amplitude values were linearly interpolated by the synthesizer between t=0 ms (consonant onset) and t=30 ms (beginning of vowel steady state). Spectra of the individual pitch pulses (every 10 ms) were used to confirm that spectral tilt for the four formants was reasonably constant.
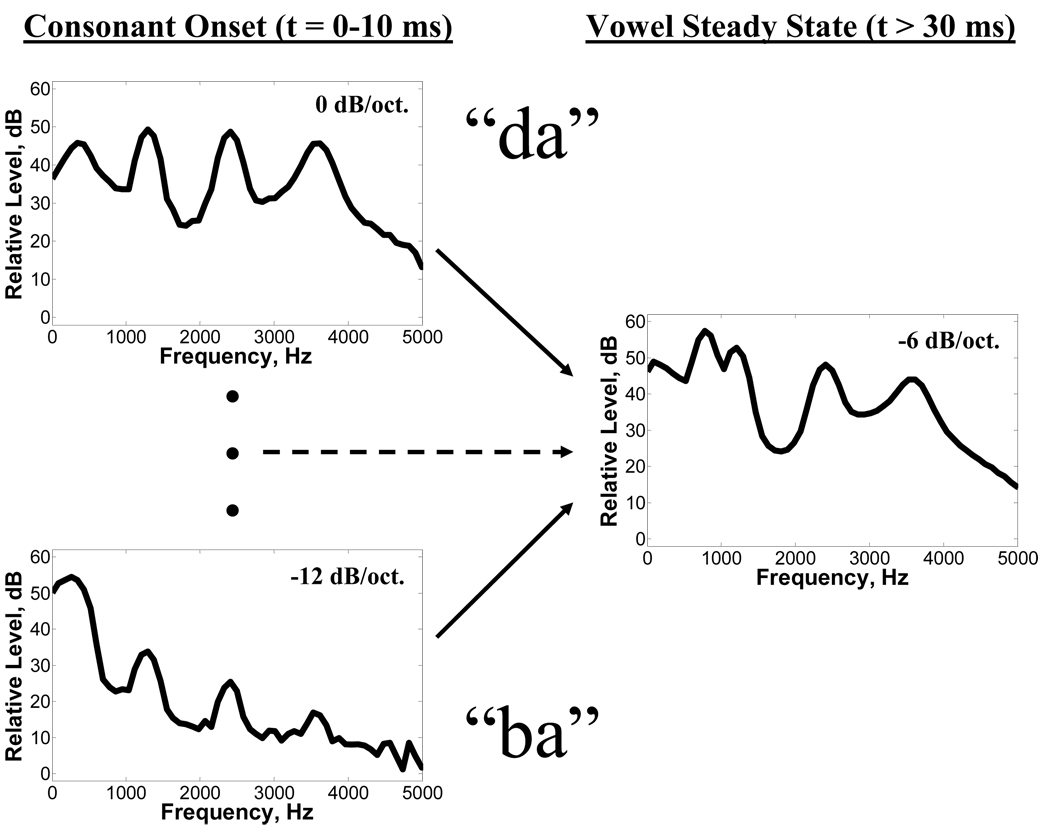
A hybrid matrix consisting of 40 CV’s varying from [ba] to [da] was created by varying both F2-onset frequency in eight steps (1000–1700 Hz) and spectral tilt at onset in five steps (−12 to 0 dB/oct.). Using the eight-step F2 series described above, parametric manipulations of spectral tilt between 212 and 4800 Hz during the formant transitions (t ≤ 30 ms) were made at zero-crossings corresponding to the midpoint and end of each pitch pulse (about every 5 ms) using 90-order finite impulse response (FIR) filters created in MATLAB. (Because stimuli already had a constant −3 dB/oct. tilt, actual slopes of the filters varied from −9 dB/oct. to +3 dB/oct.) During transitions, spectral tilt linearly converged to vowel steady state, which was filtered as a whole segment to a tilt of −6 dB/oct. (see Figure 1). Because initial portions of waveforms are not filtered accurately when the length of the impulse response approaches that of the waveform, each input waveform was concatenated several times and then convolved with the FIR filters. From the medial portion of this filtered waveform, the output waveform was extracted at zero-crossings corresponding to the original input waveform. The CV’s were upsampled to 48,828 Hz with 24 bits of resolution and low-pass filtered with an 86-order FIR filter with an upper cutoff at 4800 Hz and a stopband of −90 dB at 6400 Hz. The CV’s were then scaled to a constant root-mean-square amplitude.
Figure 1.
Short-term spectra representing change in tilt for stimuli in Experiment 1 in which different consonant onset tilts converged to a −6 dB/oct. vowel tilt. This example represents stimuli with an F2-onset frequency of 1400 Hz. Short-term spectra show the first (left) and fourth (right) pitch pulse (about 10 ms each) and were analyzed without pre-emphasis using a 256-point FFT with a 50% Hamming window overlap. Consonant onset tilts shallower than vowel tilt (top) are expected to result in more alveolar responses and consonant onset tilts steeper than vowel tilt (bottom) are expected to result in more labial responses.
3. Procedure
Participants listened to each of the 40 CV tokens once per trial block in randomized order. Following two warm-up blocks (80 trials), data were collected on eight subsequent blocks (320 trials). Stimuli were presented monaurally to participants through Beyerdynamic DT150 headphones at an average level of 92 dB SPL. In a two-alternative forced choice task, participants indicated their responses by using a mouse to click on one of two response boxes labeled “BA” and “DA.”
4. Normal-hearing controls
For comparison, data from NH participants in Alexander and Kluender (2008) were reanalyzed using the techniques outlined below. NH listeners for all experiments were undergraduate students from the University of Wisconsin- Madison and participated as part of course credit. No listener participated in more than one experiment. All reported that they were native speakers of American English and had normal hearing. Twenty-three listeners (3 male, 20 female) participated in Experiment 1. The only procedural differences worth noting are that stimuli were presented diotically at an average level of 75 dB SPL. While the level difference could contribute to greater upward spread of masking and reduced spectral resolution in HI listeners (Glasberg and Moore, 1986), the diotic (NH) vs. monaural (HI) presentation is unlikely to affect the pattern of results.3
B. Results and Discussion
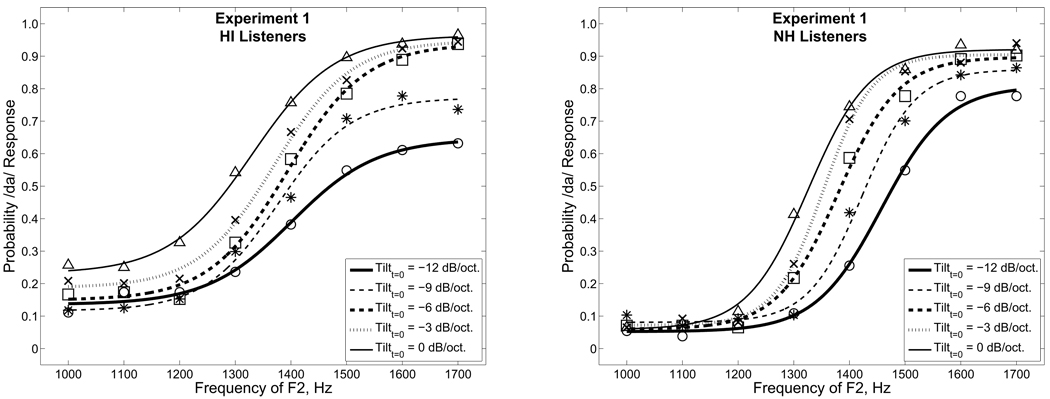
Left and right panels of Figure 2 display identification rates of mean data for HI and NH listeners, respectively. Probability of listeners responding /da/ is plotted as a function of F2 onset frequency (abscissa) for each consonant-onset tilt with circles, asterisks, squares, x’s, and triangles representing mean data for −12, −9, −6, −3, and 0 dB/oct., respectively. For display purposes, data points for each onset tilt were fit to a maximum likelihood psychometric function using the psignifit toolbox for MATLAB (Wichmann and Hill, 2001).4 Both groups of listeners are highly influenced by F2 with identification rates often approaching floor or ceiling near the F2 series endpoints. The influence of tilt is indicated by the systematic separation of functions for each onset tilt, with increasingly greater identification rates for /da/ (leftward shift of the functions along the abscissa) with shallower consonant onset tilts. Compared to NH listeners (right panel), identification functions of HI listeners (left panel) appear to be influenced more by tilt, especially near the F2 series endpoints.
Figure 2.
Identification rates for mean data of HI and NH listeners in Experiment 1 are plotted in the left and right panels, respectively. Probability of responding /da/ as a function of F2-onset frequency is plotted separately for each consonant onset tilt. Circles, asterisks, squares, x’s, and triangles represent mean data for consonant onset tilts of −12, −9, −6, −3, and 0 dB/oct., respectively. Maximum-likelihood fits of identification rates are displayed for mean data at each consonant onset tilt as different lines (see legend).
To test for group differences in the influence of F2 and tilt on stop consonant perception, listeners’ responses were coded as ‘0’ (/ba/) and ‘1’ (/da/) and were regressed against tilt and F2 of each stimulus using a logistic model (glmfit in MATLAB). For each listener, weights were obtained from standardized regression coefficients for tilt and F2. The first two columns in Table II list weights for each HI listener in Experiment 1. For each group, weights are given for the data pooled across all listeners (i.e., Figure 2) in addition to the mean of the individual weights and standard errors. A comparison of mean weights reveals that weights for F2 for HI listeners were significantly less than for NH listeners [t(39) = 2.0, p ≤ 0.05]. However, weights for tilt were not significantly different between groups [t(39) < 1.0, p > 0.05].
Table II.
Standardized logistic regression weights for F2 and tilt for each HI listener in Experiments 1–5. All weights are significantly different from 0, except the underlined entries. “HI pooled” and “NH pooled” are weights from regression analyses conducted on the pooled data from each group. “Mean HI” and “Mean NH” represent means of weights from the individuals in each group. SE is standard error of this mean.
| Experiment 1 |
Experiment 2 |
Experiment 3 |
Experiment 4 |
Experiment 5 |
||||||
|---|---|---|---|---|---|---|---|---|---|---|
| Listener | F2 | Tilt | F2 | Tilt | F2 | Tilt | F2 | Tilt | F2 | Tilt |
| HI 04 | 0.12 | 0.74 | 0.04 | 0.61 | 0.08 | 0.82 | 0.06 | 0.86 | 0.06 | −0.59 |
| HI 05 | 0.52 | 0.19 | 0.51 | 0.08 | 0.36 | 0.54 | 0.63 | 0.75 | 0.63 | 0.15 |
| HI 08 | 1.03 | 0.00 | 1.41 | 0.11 | 0.73 | 0.82 | 0.48 | 0.44 | 0.80 | 0.13 |
| HI 12 | 0.94 | 0.57 | 0.90 | −0.11 | 0.54 | 0.72 | 0.69 | 0.08 | 0.61 | 0.36 |
| HI 13 | 1.00 | 0.18 | 0.52 | −0.27 | 1.13 | 0.63 | 0.99 | 0.18 | 1.25 | 0.62 |
| HI 14 | 0.59 | 0.29 | 0.88 | −0.12 | 0.42 | 0.62 | 0.17 | 0.56 | 0.58 | −0.19 |
| HI 15 | 0.75 | 0.43 | 0.95 | 0.18 | 0.92 | 0.74 | 0.59 | 0.19 | 0.90 | 0.03 |
| HI 16 | 0.29 | 0.57 | 0.42 | 0.32 | 0.04 | 0.42 | −0.04 | 0.32 | 0.48 | 0.00 |
| HI 17 | 0.67 | 0.12 | 0.43 | 0.08 | 0.18 | 0.04 | 0.42 | 0.13 | 0.44 | −0.17 |
| HI 18 | 0.14 | 0.32 | 0.26 | −0.03 | 0.08 | 0.52 | 0.12 | 0.38 | 0.26 | 0.36 |
| HI 19 | 0.18 | −0.05 | 0.30 | 0.04 | 0.04 | −0.03 | 0.02 | 0.24 | 0.41 | −0.07 |
| HI 20 | 0.53 | 0.31 | 0.74 | −0.09 | 0.32 | 0.32 | 0.34 | 0.12 | 0.73 | 0.09 |
| HI 21 | 0.70 | 0.09 | 0.89 | −0.08 | 0.29 | 0.21 | 0.64 | 0.19 | 0.45 | 0.16 |
| HI 22 | 1.57 | 0.06 | 1.42 | 0.13 | 1.14 | 0.64 | 1.14 | 0.06 | 1.05 | −0.20 |
| HI 23 | 0.74 | 0.03 | 1.04 | 0.14 | 0.78 | 0.11 | 1.65 | 0.23 | 0.53 | −0.15 |
| HI 24 | 1.00 | 0.22 | 1.18 | 0.26 | 0.52 | 0.22 | 0.62 | 0.34 | 0.85 | −0.10 |
| HI 25 | 0.65 | 0.27 | 0.52 | −0.06 | 0.32 | 0.25 | 0.19 | 0.41 | 0.54 | 0.05 |
| HI 26 | 1.16 | 0.21 | 0.96 | 0.17 | 0.79 | 0.66 | 1.23 | 0.22 | 0.78 | −0.09 |
| HI pooled | 0.59 | 0.23 | 0.61 | 0.07 | 0.40 | 0.42 | 0.50 | 0.30 | 0.56 | 0.01 |
| Mean HI | 0.70 | 0.25 | 0.74 | 0.08 | 0.48 | 0.46 | 0.55 | 0.32 | 0.63 | 0.02 |
| SE | 0.093 | 0.052 | 0.095 | 0.049 | 0.087 | 0.066 | 0.113 | 0.054 | 0.069 | 0.065 |
| NH pooled | 0.72 | 0.17 | 0.87 | 0.14 | 0.85 | 0.27 | 0.84 | 0.25 | 0.69 | −0.01 |
| Mean NH | 0.97 | 0.24 | 1.09 | 0.16 | 1.13 | 0.36 | 1.06 | 0.29 | 0.86 | −0.02 |
| SE | 0.097 | 0.038 | 0.077 | 0.029 | 0.083 | 0.034 | 0.071 | 0.042 | 0.058 | 0.04 |
| t−test | 2.0* | < 1.0 | 2.9** | 1.7 | 5.4*** | 1.5 | 4.1*** | < 1.0 | 2.6** | < 1.0 |
The last row displays the results of t-tests for each estimate between NH and HI listeners
p ≤ 0.05).
p ≤ 0.01
p ≤ 0.001
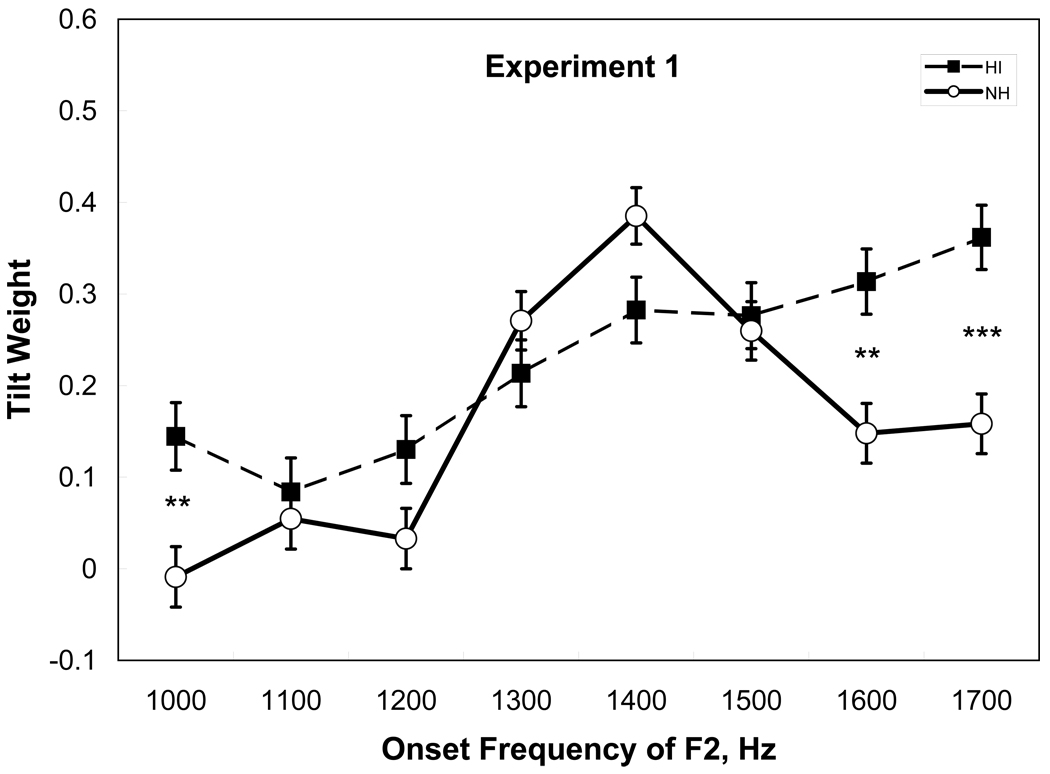
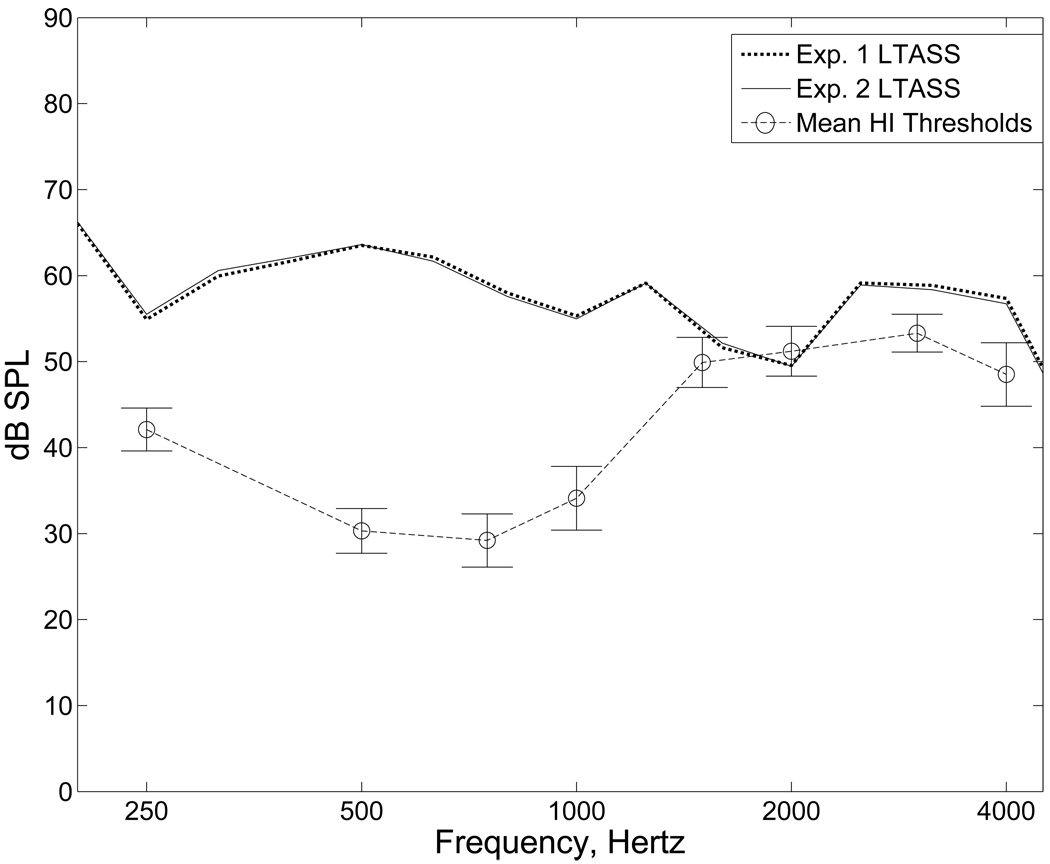
Alexander and Kluender (2008) suggested that for NH listeners, the influence of spectral tilt is greatest when F2 information is at an intermediate value in the series and perceptually ambiguous. To examine whether HI and NH listeners differ in how they use tilt information as a function of F2, weights for tilt were obtained for each value of F2 using standardized linear regression coefficients obtained from the pooled data.5 These weights are plotted in Figure 3 for HI and NH listeners (filled squares and open circles, respectively). Here and elsewhere, asterisks denote the level of statistical significance between groups at each frequency as determined by Bonferroni-adjusted t-tests comparing the regression coefficients obtained from the pooled data (see caption). Results for NH listeners quantify what was only broadly described by Alexander and Kluender (2008); the influence of spectral tilt is maximal at F2 frequencies that are intermediate between /ba/ and /da/ (i.e., 1300–1500 Hz). In contrast, the influence of spectral tilt for HI listeners gradually increases with increases in F2 frequency. One possible reason for this pattern is that hearing loss tends to increase with increasing frequency (in our sample, from 28 dB HL at 1000 Hz to 44 dB HL at 2000 Hz), and increased hearing loss is often associated with poorer spectral resolution and greater upward spread of masking, especially at greater presentation levels (Glasberg and Moore, 1986). Another related reason is that as F2 frequency increases, its amplitude decreases by an amount that is dependent on spectral tilt. For a −12 dB/oct. tilt, the amplitude of F2 is about 9 dB less when its frequency is 1700 Hz compared to 1000 Hz (a change of about ¾ oct.). Figure 4 plots HI listeners’ mean thresholds in dB SPL against the 1/3 octave band long-term average speech spectra (LTASS) for consonant onsets (t = 0–30 ms) of all speech tokens used in Experiments 1 and 2 (dotted and solid lines, respectively; which are essentially indistinguishable). On average, speech energy in the F2 region through 1700 Hz was audible for most listeners. Of course, this is expected to vary by individual and by token. Because the frequency peak of F2 varied during the first 30 ms, its actual energy was about 6 dB higher than the average shown in Figure 4.
Figure 3.
Standardized linear regression weights for tilt at each F2 frequency for HI and NH listeners (filled squares and open circles, respectively) in Experiment 1. Error bars represent standard error of the estimate. Bonferroni-adjusted levels of statistical significance between groups at each frequency are indicated by asterisks (***p ≤ 0.001; ** p ≤ 0.01).
Figure 4.
The 1/3 octave band long-term average speech spectra (LTASS) of consonant onsets (t = 0–30ms) for Experiments 1 and 2 (dotted and solid lines, respectively) plotted against mean thresholds in dB SPL of HI listeners (dashed line). Error bars represent standard error of the mean. Note that LTASS of onsets are essentially identical across the two experiments.
In summary, while the overall influence of spectral tilt is not statistically different between HI and NH listeners, the pattern of weights for tilt as function of F2 frequency does differ between the two groups. Compared to NH listeners, HI listeners are more likely to use spectral tilt onset when classifying stop consonants marked by unambiguous formant information, especially when the F2 frequency is high. Reasons for this difference are likely a combination of increased thresholds for hearing, decreased spectral resolution, greater upward spread of masking, and decreased formant amplitudes with increases in F2 frequency.
III. EXPERIMENT 2: Effect of following vowel tilt on CV perception
As discussed in Alexander and Kluender (2008), the critical feature of spectral tilt in identification of stop consonants is tilt of onset relative to tilt of the following vowel. A negative (steeper) consonant onset tilt relative to vowel tilt encourages perception of a labial place of articulation and a positive (shallower) consonant onset tilt relative to vowel tilt encourages perception of an alveolar place of articulation. Manipulations of consonant onset tilt and vowel tilt are complementary, and either is sufficient to influence perception. Based on the earlier discussion, it is expected that, like NH listeners, HI listeners will make use of relative change in tilt across speech segments rather than the absolute tilt at consonant onset. Experiment 2 tests this hypothesis by holding tilt of consonant onset constant while manipulating tilt of the following vowel.
A. Methods
HI listeners were the same group of listeners from Experiment 1. NH listeners consisted of a new group of twenty-one college students who reported normal hearing (6 male, 15 female). For this experiment, the [ba] to [da] matrix of 40 CVs varied in spectral tilt of the following vowel in five steps ranging from −12 to 0 dB/oct. and again varied in F2-onset frequency in eight steps (see Figure 5). Stimuli were filtered using the same techniques as described for Experiment 1, with different vowel tilts diverging from a common −6 dB/oct. onset tilt. Participants listened to each of the CV tokens once per trial block in randomized order. Following two warm-up blocks (80 trials), data were collected on eight subsequent blocks (320 trials). Stimuli were presented monaurally at an average level of 92 dB SPL for HI listeners and diotically at an average level of 75 dB SPL for NH listeners.
Figure 5.
Short-term spectra representing change in tilt for stimuli in Experiment 2 in which different vowel tilts diverged from a common −6 dB/oct. onset tilt. This example represents stimuli with an F2-onset frequency of 1400 Hz. Short-term spectra are represented as in Figure 1. When consonant onset tilt is steeper than vowel tilt (top) more labial responses are expected, and when consonant onset tilt is shallower than vowel tilt (bottom) more alveolar responses are expected.
B. Results and Discussion
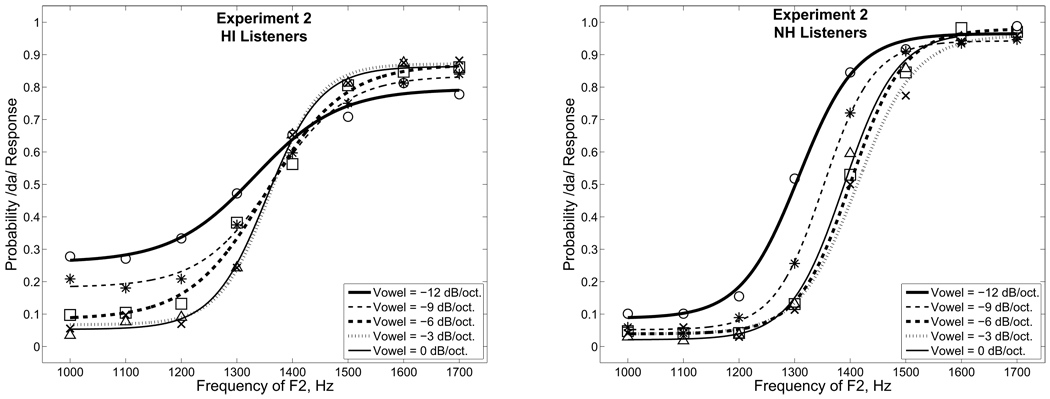
The second set of columns in Table II lists weights for F2 and tilt in Experiment 2. As with Experiment 1, mean weights for F2 were significantly less for HI listeners than for NH listeners [t(37) = 2.9, p ≤ 0.01], but were not significantly different for tilt between groups [t(37) = 1.7, p = 0.11]. Left and right panels of Figure 6 display identification rates and maximum likelihood fits of mean data for Experiment 2 for HI and NH listeners, respectively. Circles, asterisks, squares, x’s, and triangles represent mean data for vowel tilts of −12, −9, −6, −3, and 0 dB/oct., respectively. Compared to NH listeners (right panel), identification functions of HI listeners (left panel) show little divergence of the p=0.5 intercept along the abscissa, with effects of tilt largely confined to the lower F2 frequencies (< 1400 Hz).
Figure 6.
Identification rates for mean data of HI and NH listeners in Experiment 2 are plotted in the left and right panels, respectively. Probability of responding /da/ as a function of F2-onset frequency is plotted separately for each vowel tilt. Circles, asterisks, squares, x’s, and triangles represent mean data for vowel tilts of −12, −9, −6, −3, and 0 dB/oct., respectively. Maximum-likelihood fits of identification rates are displayed for mean data at each vowel tilt as different lines (see legend).
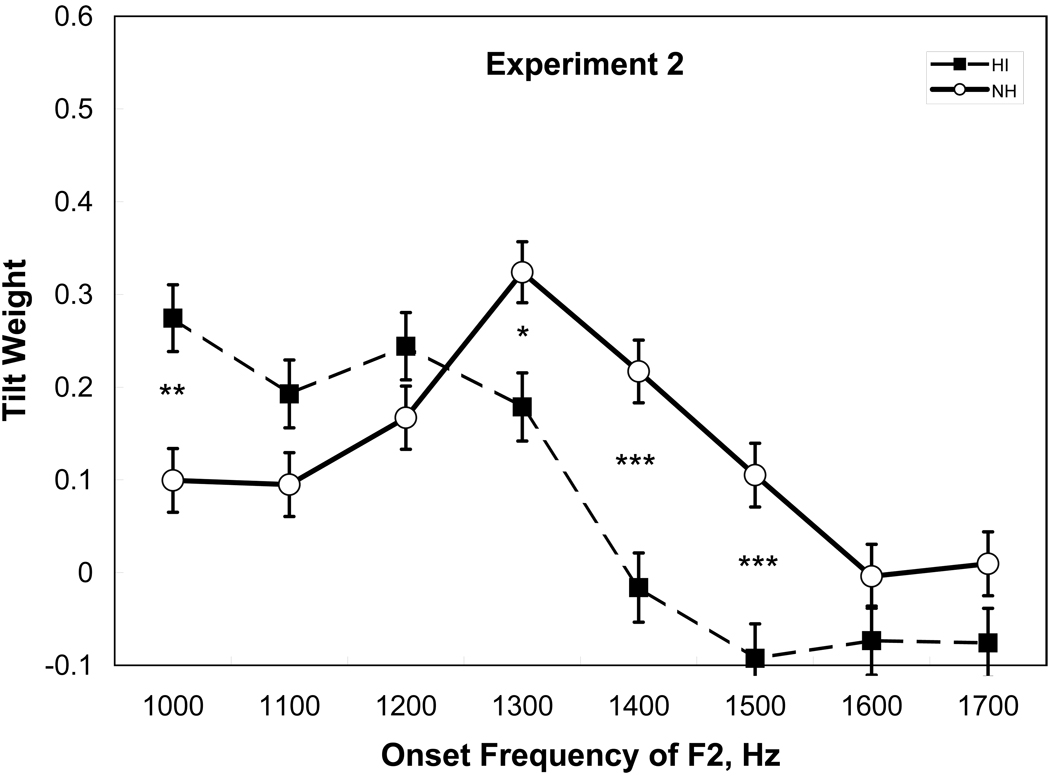
Another difference between HI and NH listeners is that the slopes of the identification functions for HI listeners decrease as spectral tilt of the vowel becomes more negative. The reciprocal of the slope of the psychometric function is equated to internal noise (σ) or greater uncertainty in the decision process. Thus, it appears that one effect of increasing the degree of spectral tilt of the following vowel on stop consonant identification is an increase in uncertainty. While there is an apparent decrease in the slopes of the identification functions with increasingly negative onset tilts for the HI listeners in Experiment 1, the difference is that the effect of spectral tilt is constant throughout the F2 series in Experiment 1 (Figure 2), but shows a crossing pattern in Experiment 2 (Figure 6). This is reflected in the pattern of tilt weights for HI listeners in Figure 7, which go from positive to negative in magnitude as F2 frequency increases. Again, this pattern of tilt weights for HI listeners differs from that for NH listeners, which shows that the influence of relative spectral tilt on NH listeners is greatest when F2 information is at an intermediate value in the series and perceptually ambiguous.
Figure 7.
Standardized linear regression weights for tilt at each F2 frequency for HI and NH listeners (filled squares and open circles, respectively) in Experiment 2. Error bars represent standard error of the estimate. Bonferroni-adjusted levels of statistical significance between groups at each frequency are indicated by asterisks (*** p ≤ 0.001; ** p ≤ 0.01; * p ≤ 0.05).
The pattern of tilt weights for HI listeners in Figure 7 is difficult to reconcile in terms of audibility of F2 onset. HI listeners still use F2 frequency to classify stop consonants in Experiment 2 and do so to the same extent as Experiment 1, with no statistical difference between the two experiments in mean F2 weights [t(17) = 0.8, p > 0.05]. Furthermore, the LTASS of the consonant onsets in Figure 4 show that average onset spectra and levels in Experiments 1 and 2 (dotted and solid lines, respectively) are essentially identical. One possible explanation is that a combination of reduced F2 amplitude, decreased spectral resolution, a greater upward spread of masking associated with steeply negative vowel tilts causes some listeners to lose their basis of comparison for judging relative onset frequency of F2, thereby resulting in a decreased slope in the psychometric function. Experiments 3 and 4 below partially address this problem by providing a second point of comparison for onset spectral tilt and F2 frequency in the form of a preceding vowel that is identical to the following vowel.
IV. EXPERIMENTS 3 and 4: Effect of relative tilt change on VCV perception
A. Rationale
Without preceding speech, stop consonants in Experiments 1 and 2 are more typical of speech that initiates an utterance. However, most sounds in fluent speech, including those in word-initial position are better characterized as being utterance-medial. In medial position, contrast is provided by both preceding and following speech sounds. The next set of experiments explores effects of relative spectral tilt change on perception of medial stop consonants. For NH listeners, Alexander and Kluender (2008) found that effects of tilt are enhanced in a VCV context in which preceding vowels share the same critical acoustic features as following vowels.
B. Methods
Experiments 3 and 4 were modifications of Experiments 1 and 2, respectively. For HI listeners, the same group from Experiments 1 and 2 was used, and for NH listeners, two new groups of college students were recruited; 25 (10 male, 15 female) and 22 (6 males, 16 females) in each group, respectively. Stimuli were created by introducing a 200-ms [a] followed by 50- ms of silence before the stimuli in Experiments 1 and 2. Formant frequencies and spectral tilt of the preceding [a] were matched to the following [a] to enhance perception of tilt and formant frequency change associated with consonant onset (both vowels in the VCV stimuli had the same spectral tilt that was −6 dB/octave in Experiment 3 and was varied in Experiment 4).
Participants listened to each of the VCV tokens once per trial block in randomized order. Following two warm-up blocks (80 trials), data were collected on eight subsequent blocks (320 trials). Stimuli were presented monaurally at an average level of about 92 dB SPL for HI listeners and diotically at an average level of about 75 dB SPL for NH listeners.
C. Results and Discussion
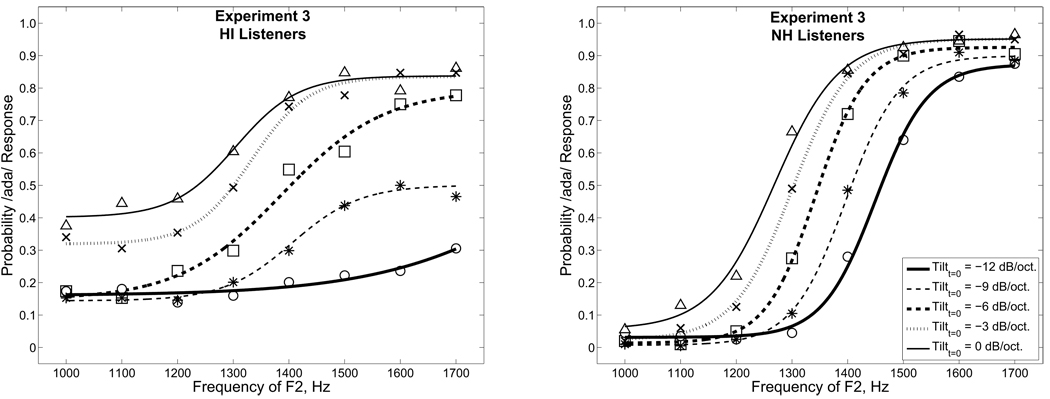
The third set of columns in Table II lists weights for F2 and tilt in Experiment 3. As with Experiments 1 and 2, mean weights for F2 were significantly less for HI listeners than for NH listeners [t(41) = 5.4, p ≤ 0.001], but were not significantly different for tilt between groups [t(41) = 1.5, p = 0.14]. Left and right panels of Figure 8 display identification rates and maximum likelihood fits of mean data for Experiment 3 for HI and NH listeners, respectively. For both groups of listeners, but especially for HI listeners, the influence of consonant onset tilt seems to be greater than for Experiment 1 as indicated by the increased separation of identification functions for each onset tilt. A paired-sample t-test for HI listeners revealed that providing an additional comparison for consonant onset tilt in the form of a preceding vowel (Experiment 3) resulted in significantly greater weight for tilt [t(17) = 3.4, p < 0.01] and significantly less weight for F2 [t(17) = 4.5, p < 0.01] compared to no preceding vowel (Experiment 1). A two-sample t-test for NH listeners also revealed a significant increase in weights for tilt [t(46) = 2.3, p < 0.05], but not a significant difference in weights for F2 [t(46) = 1.3, p > 0.05].
Figure 8.
Identification rates for mean data from HI and NH listeners in Experiment 3 are plotted in the left and right panels, respectively. Probability of responding /ada/ as a function of F2-onset frequency is plotted separately for each consonant onset tilt. Circles, asterisks, squares, x’s, and triangles represent mean data for onset tilts of −12, −9, −6, −3, and 0 dB/oct., respectively. Maximum-likelihood fits of identification rates are displayed for mean data at each consonant onset tilt as different lines (see legend).
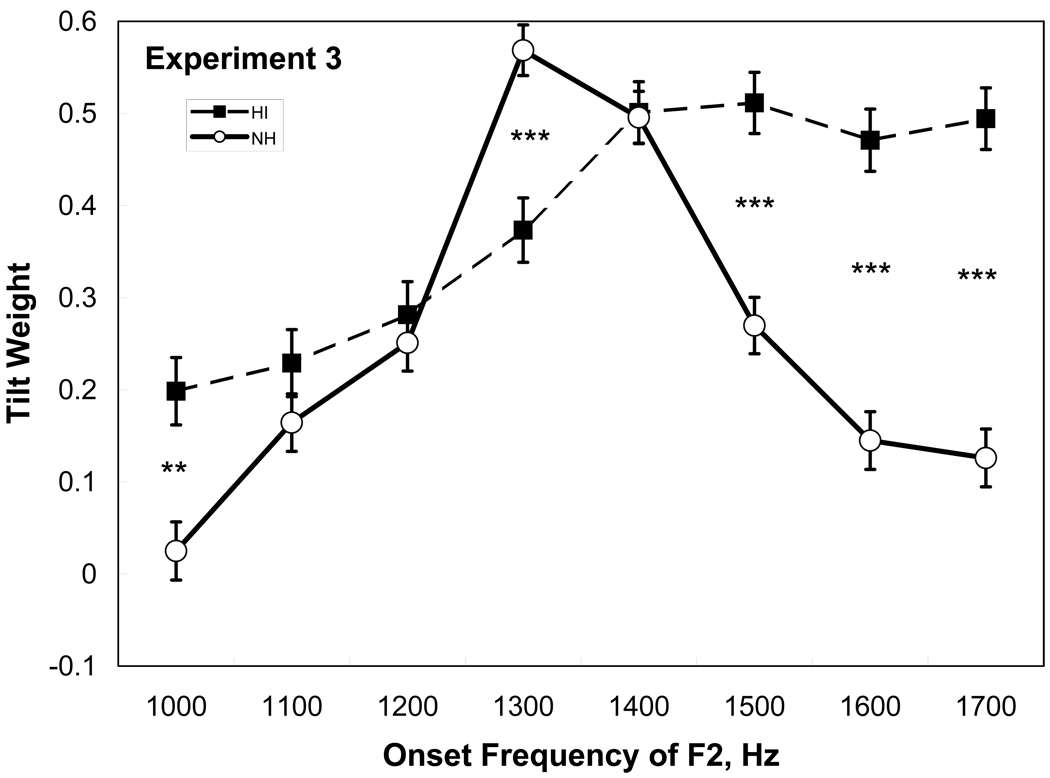
The pattern of tilt weights as a function of F2 onset frequency for Experiment 3 is plotted in Figure 9. Compared to Experiment 1, the difference in the pattern of weights between HI and NH listeners is the same, albeit shifted up toward greater tilt weights. For NH listeners, the influence of spectral tilt is maximal at F2 frequencies that are intermediate between /aba/ and /ada/, while the influence of spectral tilt for HI listeners gradually increases with increases in F2 frequency, with significantly greater weights than for NH listeners at the series endpoints, especially at higher F2 frequencies.
Figure 9.
Standardized linear regression weights for tilt at each F2 frequency for HI and NH listeners (filled squares and open circles, respectively) in Experiment 3. Error bars represent standard error of the estimate. Bonferroni-adjusted levels of statistical significance between groups at each frequency are indicated by asterisks (*** p ≤ 0.001; ** p ≤ 0.01).
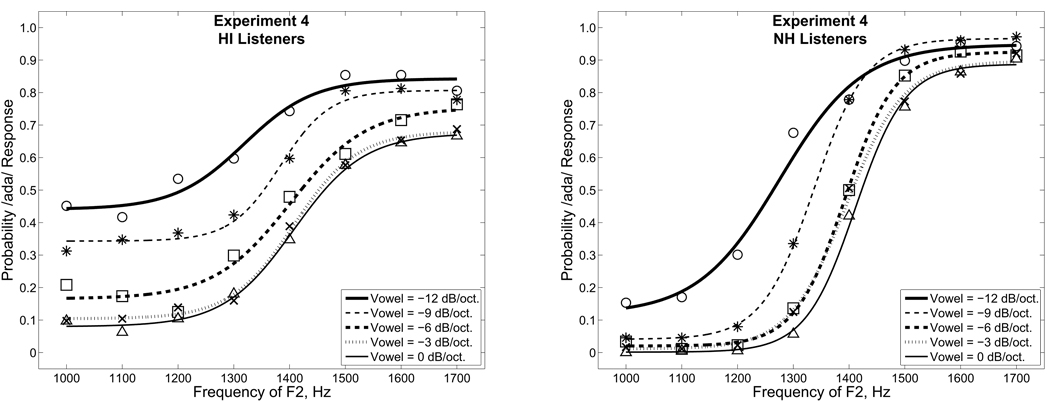
The fourth set of columns in Table II lists weights for F2 and tilt in Experiment 4. As with Experiments 1 – 3, mean weights for F2 were significantly less for HI listeners than for NH listeners [t(38) = 4.1, p ≤ 0.001], but were not significantly different for tilt between groups [t(38) = 0.4, p > 0.05]. Left and right panels of Figure 10 display identification rates and maximum likelihood fits of mean data for Experiment 4 for HI and NH listeners, respectively. Compared to Experiment 2 (Figure 6), identification functions for different vowel tilts for HI listeners do not show a crossing pattern, but rather show a systematic effect of tilt across F2 frequency. This might result from the additional source of comparison provided by the preceding vowel, not only for tilt, but also for F2 frequency. As with the comparison between Experiments 1 and 3, the influence of vowel tilt in Experiment 4 seems to be greater than for Experiment 2 for both groups of listeners. A paired-sample t-test for HI listeners revealed that providing an additional comparison for consonant onset tilt in the form of a preceding vowel (Experiment 4) resulted in significantly greater weight for tilt [t(17) = 4.6, p < 0.001] and marginally significantly less weight for F2 [t(17) = 2.1, p = 0.055] compared to without the preceding vowel (Experiment 2). A two-sample t-test for NH listeners also revealed a significant increase in weights for tilt [t(41) = 2.5, p < 0.05], but not a significant difference in weights for F2 [t(41) = 0.3, p > 0.05].
Figure 10.
Identification rates for mean data of HI and NH listeners in Experiment 4 are plotted in the left and right panels, respectively. Probability of responding /ada/ as a function of F2- onset frequency is plotted separately for each vowel tilt. Circles, asterisks, squares, x’s, and triangles represent mean data for vowel tilts of −12, −9, −6, −3, and 0 dB/oct., respectively. Maximum-likelihood fits of identification rates are displayed for mean data at each vowel tilt as different lines (see legend).
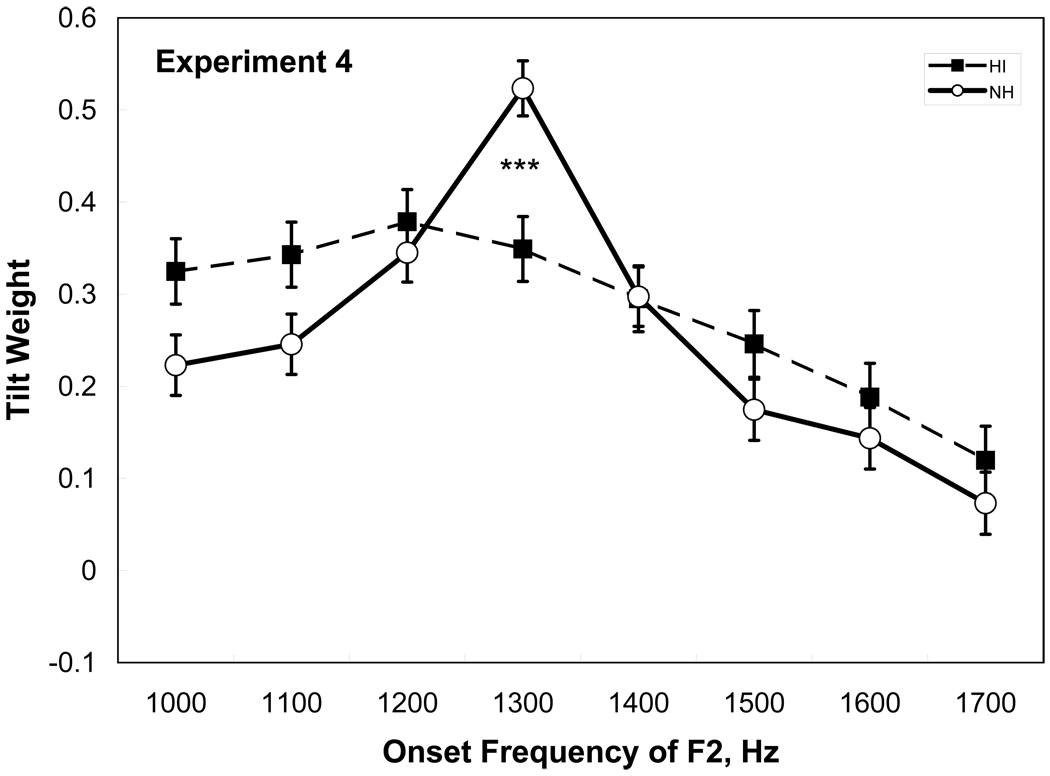
The pattern of tilt weights as a function of F2 onset frequency for Experiment 4 is plotted in Figure 11. As expected from identification functions in Figure 10, the pattern of tilt weights for HI listeners are greatest for lower F2 frequencies and gradually decrease with increases in F2 frequency, but do not become negative as in Experiment 2. As with Experiments 1 – 3, for NH listeners the influence of spectral tilt is maximal at F2 frequencies that are intermediate between /aba/ and /ada/.
Figure 11.
Standardized linear regression weights for tilt at each F2 frequency for HI and NH listeners (filled squares and open circles, respectively) in Experiment 4. Error bars represent standard error of the estimate. Bonferroni-adjusted levels of statistical significance between groups at each frequency are indicated by asterisks (*** p ≤ 0.001).
This pattern of decreasing tilt weights with increasing F2 frequency for HI listeners in Experiments 2 and 4 is opposite that of Experiments 1 and 3. We can only speculate why tilt weights are greatest for the lower F2 frequencies when vowel tilt changes. One explanation is that the pattern has less to do with absolute F2 frequency than it does with the amount of frequency change. That is, the F2 frequency of the vowel in these experiments was 1200 Hz, and tilt weights are greatest when change in F2 frequency from consonant onset is relatively small (e.g., +/− 200 Hz). Larger changes in F2 frequency associated with higher F2 onset frequencies are more salient and decrease the influence of spectral tilt.
V. EXPERIMENT 5: Effects of absolute tilt
A. Rationale
The above experiments demonstrate that HI listeners are sensitive to consonant differences cued by relative changes in spectral tilt, especially when preceding and following speech segments provide points of contrast in the spectrum. From the results of NH listeners in Alexander and Kluender (2008), in the absence of change in spectral tilt, we expect that HI listeners will not be influenced by speech stimuli that vary in absolute tilt across trials, but maintain constant tilt from consonant onset to vowel within trials.
B. Methods
HI listeners were the same group of listeners as for Experiments 1 – 4. NH listeners consisted of a new group of twenty-three college students who reported normal hearing (9 male, 14 female). Listeners identified a matrix of 56 CVs that varied from [ba] to [da] along both F2- onset frequency (eight steps) and absolute tilt (constant tilt throughout duration) in seven steps (−12 to +6 dB/oct.). Participants listened to every CV token once per trial block in randomized order. Due to an oversight, HI listeners had one block of practice (56 trials) and NH listeners had two blocks of practice (112 trials). We do not anticipate that this procedural difference had much impact as our experience indicates that our listeners, who have a lifetime of exposure to hearing these speech contrasts, develop stable listening patterns following exposure to a relatively small number of trials. Further, HI listeners had more previous experience with the general task (Experiments 1 – 4). Data were collected on eight subsequent blocks (448 trials). Stimuli were presented monaurally at an average level of 92 dB SPL for HI listeners and diotically at an average level of about 75 dB SPL for NH listeners.
C. Results and Discussion
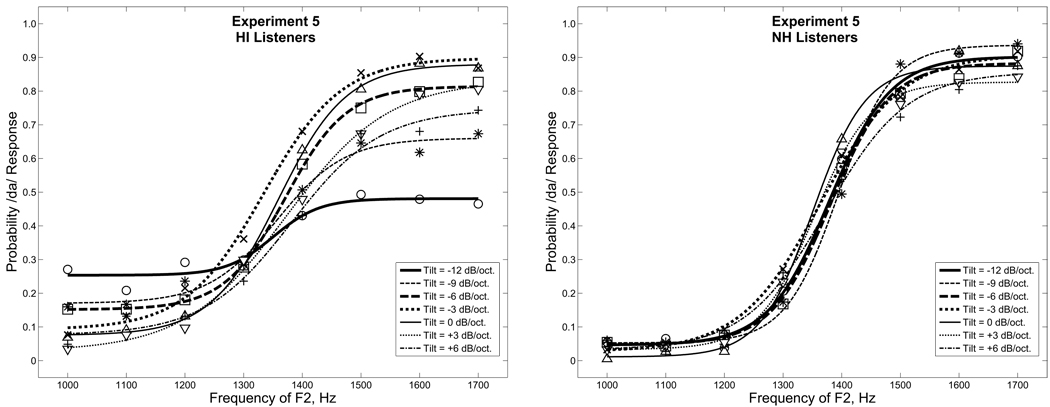
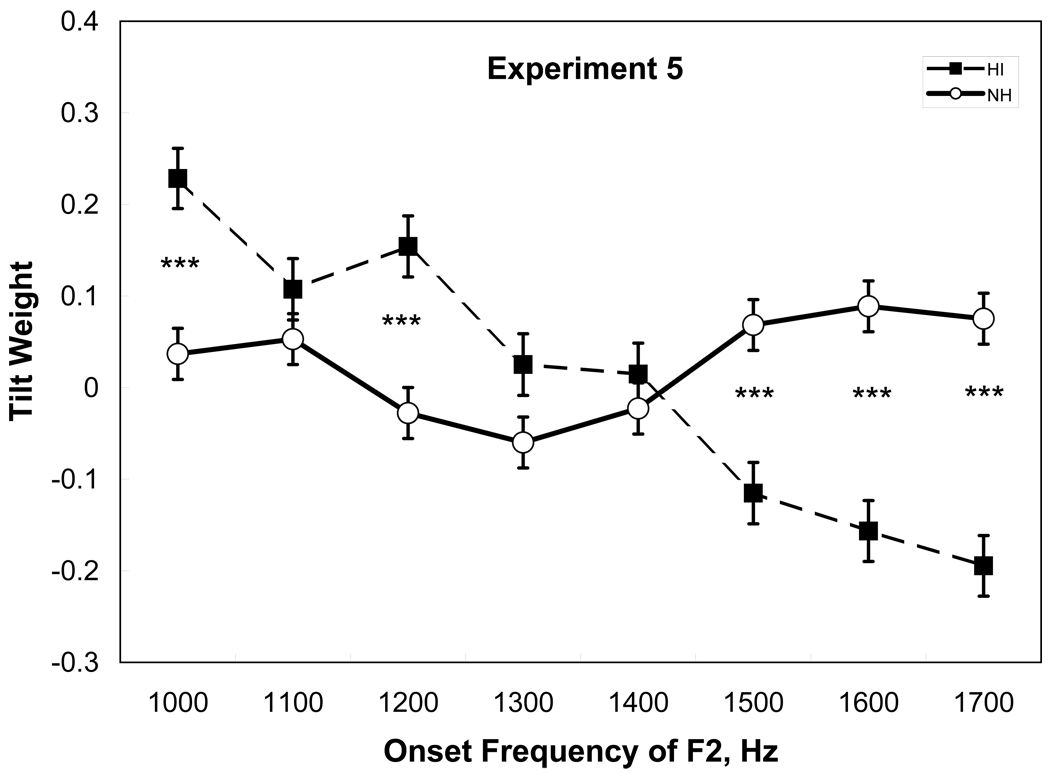
The fifth set of columns in Table II lists weights for F2 and tilt in Experiment 5. As with Experiments 1 – 4, mean weights for F2 were significantly less for HI listeners than for NH listeners [t(39) = 2.6, p ≤ 0.001], but were not significantly different for tilt between groups [t(39) = 0.6, p > 0.05]. Left and right panels of Figure 12 display identification rates and maximum likelihood fits of mean data for Experiment 5 for HI and NH listeners, respectively. For NH listeners, it is clear that differences in absolute tilt over a wide range have no influence on listeners’ categorization. For HI listeners, differences in absolute tilt are more apparent in slopes than in intercepts of the fitted functions. A similar pattern was observed for HI listeners in Experiment 2 (Figure 6) in response to CV stimuli that varied in tilt of the following vowel. Stimuli with the most negative tilts, −12 and −9 dB/oct., also have the shallowest psychometric function slopes. This is reflected in the pattern of tilt weights for HI listeners in Figure 13, which, like Figure 7, go from positive to negative in magnitude as F2 frequency increases. Again, a combination of reduced F2 amplitude, decreased spectral resolution, and greater upward spread of masking associated with steeply negative vowel tilts might cause some listeners to lose their basis of comparison for judging relative onset frequency of F2, thereby resulting in increased uncertainty. It is possible that this irregularity would resolve for stop consonants with unvarying spectral tilt in medial position.
Figure 12.
Identification rates for mean data of HI and NH listeners in Experiment 5 are plotted in the left and right panels, respectively. Probability of responding /da/ as a function of F2-onset frequency is plotted separately for each absolute spectral tilt. Circles, asterisks, squares, x’s, upward triangles, downward triangles, and +’s represent mean data for CVs with absolute tilts of −12, −9, −6, −3, 0, +3, and +6 dB/oct. respectively. Maximum-likelihood fits of identification rates are displayed for mean data at each vowel tilt as different lines (see legend).
Figure 13.
Standardized linear regression weights for tilt at each F2 frequency for HI and NH listeners (filled squares and open circles, respectively) in Experiment 5. Error bars represent standard error of the estimate. Bonferroni-adjusted levels of statistical significance between groups at each frequency are indicated by asterisks (*** p ≤ 0.001).
VI. GENERAL DISCUSSION
Experiments described in this report manipulated relative spectral tilt and second formant frequency (F2) at stop consonant onset as cues to perception of /ba/ (low F2, steep/negative onset tilt) versus /da/ (high F2, shallow/positive onset tilt). Experiments 1 and 2 examined utterance initial stops (/ba/ and /da/), and Experiments 3 and 4 examined utterance medial stops (/aba/ and /ada/), which are much more common in natural speech. Relative spectral tilt was manipulated either at consonant onset (Experiments 1 and 3) or at the vowels (Experiments 2 and 4). These manipulations were complementary, and either was sufficient to influence perception. Results of these experiments also establish that change in spectral tilt, not absolute tilt, is perceptually effective. When tilt varied over a wide range from trial to trial, but did not change within a stimulus, tilt had no systematic effect on perception (Experiment 5). Furthermore, perception of relative spectral tilt was enhanced when a preceding vowel tilt also contrasted with consonant onset tilt (Experiments 3 and 4).
The influence of F2 and relative spectral tilt on listeners’ categorizations was determined by regression weights. A comparison of weights for HI and NH listeners reveals a consistent pattern across all five experiments. Compared to NH listeners, HI listeners placed less weight on formant frequency information. This result is not surprising given that consequences of sensorineural hearing loss include reduced audibility and decreased resolution for spectral peaks. Unexpectedly, this difference in the use of spectrally local information did not result in an absolute increase in the use of spectrally global information because NH and HI listeners did not differ in weights for spectral tilt for any of the five experiments.
There was considerable variability in weights between listeners, especially for HI listeners. Some HI listeners showed a clear preference for spectral tilt (e.g., HI 04) across the five experiments; some showed mostly a preference for F2 (e.g., HI 22, HI 23, and HI 26); and, some showed a preference pattern that varied depending on whether onset tilt or vowel tilt was varied (e.g., HI 12). Correlations between the F2 and tilt weights and HI listeners’ age, average hearing loss for F2 (1000, 1500, and 2000 Hz), and slope of hearing loss in the frequency range of F2 (change in threshold from 1000 to 2000 Hz) revealed no significant correlations after correcting for multiple comparisons across the five experiments. Although for all five experiments, age, degree of hearing loss, and slope had a negative correlation with weights on F2 and tended to have a positive correlation with weights on tilt. Therefore, it is unclear at this time what listener factors influence a person’s relative reliance on spectral tilt compared to F2. One possibility is their history of hearing aid use, including the type of circuit technology, or the duration of their hearing loss. However, not enough information was gathered on this limited group of participants to explore these issues further. Finally, the extent to which differences in age (young 20 year olds compared to elderly 70 year olds) contributed to the observed differences between groups is simply unknown, especially considering the observed variability in HI listeners.
All this is not to say that we should not be concerned about how HI listeners use relative spectral tilt as a cue for perception. A comparison of the F2 and tilt weights for Experiments 3 and 4, in which the more common utterance-medial position was examined, reveals that about four times greater emphasis was placed on F2 relative to spectral tilt by NH listeners, whereas there was no statistical difference in the emphasis placed on F2 and spectral tilt by HI listeners ([(t(17) = 0.3, p > 0.05] and [(t(17) = 1.7, p > 0.05] for Experiments 3 and 4, respectively). In addition, consider the pattern of tilt weights as a function of F2 frequency. Across experiments in which relative spectral tilt was available as a cue (Experiments 1 – 4), NH listeners relied primarily on tilt when F2 frequency was intermediate in the series and most ambiguous between /ba/ and /da/. In contrast, HI listeners placed significantly greater weight than NH listeners did on the unambiguous endpoints where F2 information was clearly appropriate for either /ba/ or /da/.
As pointed out by Alexander and Kluender (2008), there are several reasons to believe that the demonstrated influence of spectral tilt in this report is conservative with respect to natural speech and to the wider inventory of speech sounds and acoustic contexts. First, as already mentioned, in fluent conversational speech there are very few instances of utterance-initial sounds compared to utterance-medial sounds which benefit from additional sources of contrast for spectral tilt. Furthermore, articulation is less precise (i.e., formant frequencies for different phonemes are less extreme) in connected speech. The addition of ambient sound sources further undermines resolution of spectral peaks. Finally, as outlined by Alexander and Kluender (2008), there is evidence that the present choice of stimuli may also have worked against stronger effects of spectral tilt. These include the lack of stop bursts and choice of vowel context.
The equal importance of F2 and spectral tilt for HI listeners for medial position stop consonants indicates that taking away changes in spectral tilt can be as deleterious as taking away F2 information. In view of fast-acting wide-dynamic range compression (WDRC) in hearing aids, it is important to understand the influence of relative spectral tilt change on speech perception in HI listeners. With compression, the frequency response of the hearing aid is dependent on the level of the incoming sounds. For single-channel compression schemes, the amount of high-frequency gain (the increase in spectral tilt) is greater for lower-level sounds, like burst onsets in stop consonants, compared to higher-level sounds, like vowels. Consequently, for an acoustically weak stop consonant followed by a strong vowel, the relative increase in onset spectral tilt caused by the activated compression circuit could skew perception toward an alveolar place of articulation compared to when the hearing aid is out of the ear or in linear mode. Indeed, Hedrick and Rice (2000) reported that for a series of CVs with formant transitions neutral between [pa] and [ta], both NH and HI listeners gave more alveolar responses (/ta/) to stimuli that had been processed with a WDRC hearing aid compared to stimuli not processed by the hearing aid.
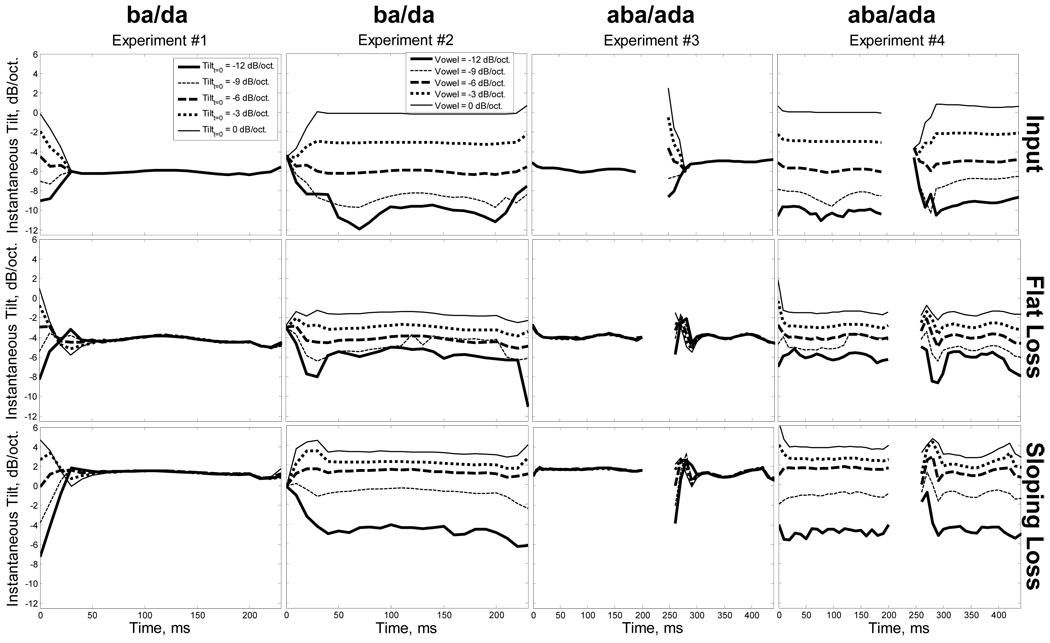
To assess how stimuli might be influenced by current hearing aid technology with multichannel compression, which tends toward a relatively flatter spectrum as different channels work to keep the intensity of different bands at a specific target level, we made recordings of the output of a Widex Inteo IN-9 behind-the-ear hearing aid in response to a sample of stimuli from Experiments 1 – 4 that varied only in their tilt history. The hearing aid was set for one of two configurations of hearing losses. For the flat loss, the hearing aid was programmed to accommodate a 50 dB HL hearing loss from 250 to 8000 Hz. For the sloping loss, the hearing aid was programmed to accommodate 15 dB/oct. sloping hearing loss starting at 20 dB HL at 250 Hz and ending at 95 dB HL at 8000 Hz. The purpose of using the two configurations of hearing loss was to simulate more or less uniform compression across channels (flat loss) and non-uniform compression (sloping loss). With non-uniform compression, we might expect greater flattening of the spectrum as low-level high-frequency components are amplified to a relatively greater intensity compared to the higher-level low-frequency components in order to accommodate the greater degree of hearing loss. All special features of the hearing aid were shut off, including directional, speech enhancement, noise reduction, and feedback cancellation modes. According to the programming software, both hearing loss configurations had the same parameters for high-level compression segments as defined broadly across four channels at 500, 1000, 2000, and 4000 Hz. For each of the respective channels, high-level compression ratios were 1.4 (that is, 1 dB increase in output for every 1.4 dB increase in input) with compression thresholds of 51, 53, 51, and 51 dB. For the flat loss, low-level compression ratios across the four respective channels were 2.3, 1.8, 2.2, and 2.4 with compression thresholds of 0, 0, 7, and 13 dB. For the sloping loss, low-level compression ratios across the four respective channels were 1.7, 1.8, 3.0, and 3.0 with compression thresholds of 2, 0, 15, and 29 dB.
Stimuli from Experiments 1 – 4 with F2 onset frequencies of 1300 Hz were played through the hearing aid at 65 dB SPL, representing average conversational speech level. Recordings were made synchronously with the playback using a two-channel CardDeluxe sound card (Digital Audio Labs). Signals were routed to the test chamber of a Fonix 6500-CX Hearing Aid Test System (Frye Electronics) and recorded with an ER-7C probe microphone. The speaker-microphone system was determined to have a reasonably flat frequency response at least through 10,000 Hz. Signals were checked to ensure no peak clipping took place. The hearing aid was directly connected a 2cc coupler using a short piece of standard #13 earmold tubing. The probe microphone was connected to the opposite coupler opening and acoustically sealed using putty.
Input and output stimuli were analyzed in 10-ms segments using a 512-point FFT. For each time segment, peaks in the FFT in the region of F1, F2, F3, and F4 were extracted from the magnitude spectrum and the average inter-formant tilt was computed. Results of these analyses are shown in Figure 14 with each column corresponding to each of the four experiments. The top row corresponds to the input stimuli, the middle row to the recordings for the flat loss configuration, and the bottom row to the recordings for the sloping loss configuration. First, note that these stimuli conservatively represent effects of compression because overall intensity from onset to vowel gradually increased by only 6 dB, with an average consonant to vowel difference of around −3 dB. In contrast, typical consonant-vowel differences are reported to be on average −10 to −12 dB and as large as −22 dB, with variation dependent on vowel and consonant context (e.g., Gordon-Salant, 1986). Therefore, our reported effects are confined primarily to input level differences across frequency arising from differences in spectral tilt, rather than overall level differences. The top row clearly demonstrates how spectral tilt was designed to vary across the four experiments. Different onset tilts converged to a common vowel tilt in Experiments 1 and 3 and a common onset tilt diverged to different vowel tilts in Experiments 2 and 4. Note that our crude metric seems to indicate that our nominal −12 dB/oct. tilt condition more closely approximated −10 dB/oct. Fluctuations over the time history for this condition in Experiment 2 reflect the inherent instability of algorithmically extracting formant peaks for steeply sloping spectra. The middle row, which corresponds to a flat loss, shows about a 50% reduction in degree of spectral tilt change for Experiments 2 and 4 and even more for Experiment 3 compared to the input stimuli. Compared to the flat loss and uniform compression ratios in the middle row, the sloping loss and non-uniform compression ratios as shown in the bottom row results in an overall +6 dB shift in spectral tilt, with approximately the same degree of compression in spectral tilt, except for the amplified −12 dB/oct. segments which remain at a relatively more negative spectral tilt.
Figure 14.
Analysis of spectral tilt for sample stimuli from Experiments 1 – 4 (columns). Top row corresponds to input stimuli, middle row to recordings from a hearing aid with more or less uniform compression ratios set for a flat hearing loss configuration, and bottom row to recordings from a hearing aid with non-uniform compression ratios set for a sloping hearing loss configuration.
While the above analysis is not representative of all the compression designs in use, it at least opens discussion about effects of compression on perception of information specified by relative spectral tilt. The results of the above analysis indicate that hearing aids with uniform and non-uniform compression characteristics can alter spectral tilt even for relatively steady state stimuli. The results of experiments in this report indicate that the observed compression in relative spectral tilt could alter perception by reducing the availability of spectral tilt information, which some HI listeners rely on to the same or greater extent as formant information. It is not known whether listeners can adjust to this compression. Because leaving relative spectral tilt uncompressed does not address the problem of making formant information audible, there appears to be a tradeoff between preserving spectral tilt information and preserving formant information for which an optimal compression design exists. Discussion of optimal compression schemes is beyond the scope of this paper, but has been the topic of numerous research papers for quite some time (see Hickson, 1994 for a review). It seems clear is that an adaptive mixture of fast and slow compression attack and release times to protect against intense transient impact noises and to accommodate gradual changes in speech level, respectively, is a minimum requirement to preserve relative (albeit, compressed) differences in spectral tilt across phonetic segments, which we now know is important to speech perception in HI listeners.
ACKNOWLEDGEMENTS
The authors thank Christian Stilp, Dr. Mark Hedrick, Dr. Marjorie Leek, and an anonymous reviewer for their helpful comments on an earlier version of this manuscript. The authors also thank Amanda Baum, Rebecca Edds, Tricia Nechodom, and Rebecca (“Hallie”) Strauss for their efforts during the data collection process. We also thank Dr. Patricia Stelmachowicz for access to the hearing aid and equipment used to make the recordings shown in Figure 14. This research was supported by a grant to the first author from The National Organization for Hearing Research Foundation (“The 2006 Graymer Foundation Grant in Auditory Science”) and a grant to the second author from the National Institutes of Health, NIDCD (R01DC04072). This manuscript was written while supported by NIDCD grant T32 DC000013 (BTNRH).
Footnotes
The term “onset” will be used generally to refer the 30-ms period over which F2 and spectral tilt transition from their initial values at the start of the consonant to their final steady state values at the start of the vowel. F2 and tilt manipulations will be nominally identified by their initial values at the start of the onset.
In Klatt’s synthesizers (1980, Klatt and Klatt, 1990), spectral tilt is increased or decreased by adjusting a single-pole filter such that the broad high-frequency skirt of the filter alters the overall shape of the spectrum.
One possibility is that because HI listeners participated in all five experiments (generally, in order from Experiment 1 to Experiment 5) that differences in performance could be due to learning effects. There seems to be no evidence for this in the data because there is no systematic trend in F2 and tilt weights going from Experiment 1 to Experiment 5, especially when compared to NH listeners.
Software version 2.5.41. See http://bootstrap-software.org/psignifit.
The reason for using linear fits on the pooled data is that logistic fits to the individual data could not be obtained in many cases due to the restricted range of response probabilities at several F2 values, especially near the endpoints.
REFERENCES
- Alexander JM, Kluender KK. Spectral tilt change in stop consonant perception. J. Acoust. Soc. Am. 2008;123:386–396. doi: 10.1121/1.2817617. [DOI] [PubMed] [Google Scholar]
- ANSI. ANSI S3.6-1996, American National Standards specification for audiometers. New York: American National Standards Institute; 1996. [Google Scholar]
- Bilger RC, Wang MD. Consonant confusions in patients with sensorineural hearing loss. J. Speech Hear. Res. 1976;19:718–748. doi: 10.1044/jshr.1904.718. [DOI] [PubMed] [Google Scholar]
- Blumstein SE, Isaacs E, Mertus J. The role of the gross spectral shape as a perceptual cue to place of articulation in initial stop consonants. J. Acoust. Soc. Am. 1982;72:43–50. doi: 10.1121/1.388023. [DOI] [PubMed] [Google Scholar]
- Blumstein SE, Stevens KN. Acoustic invariance in speech production: Evidence from measurements of the spectral characteristics of stop consonants. J. Acoust. Soc. Am. 1979;66:1001–1017. doi: 10.1121/1.383319. [DOI] [PubMed] [Google Scholar]
- Blumstein SE, Stevens KN. Perceptual invariance and onset spectra for stop consonants in different vowel environments. J. Acoust. Soc. Am. 1980;67:648–662. doi: 10.1121/1.383890. [DOI] [PubMed] [Google Scholar]
- Dorman MF, Marton K, Hannley MT, Lindholm JM. Phonetic identification by elderly normal and hearing-impaired listeners. J. Acoust. Soc. Am. 1985;77:664–670. doi: 10.1121/1.391885. [DOI] [PubMed] [Google Scholar]
- Dubno JR, Dirks DD. Auditory filter characteristics and consonant recognition for hearing-impaired listeners. J. Acoust. Soc. Am. 1989;85:1666–1675. doi: 10.1121/1.397955. [DOI] [PubMed] [Google Scholar]
- Dubno JR, Dirks DD, Langhofer L. Evaluation of hearing-impaired listeners using a nonsense-syllable test: II. Syllable recognition and consonant confusion patterns. J. Speech Hear. Res. 1982;25:141–148. doi: 10.1044/jshr.2501.141. [DOI] [PubMed] [Google Scholar]
- Dubno JR, Dirks DD, Schaefer AB. Effects of hearing loss on utilization of short-duration spectral cues in stop consonant recognition. J. Acoust. Soc. Am. 1987;81:1940–1947. doi: 10.1121/1.394758. [DOI] [PubMed] [Google Scholar]
- Glasberg BR, Moore BCJ. Auditory filter shapes in subjects with unilateral and bilateral cochlear impairments. J. Acoust. Soc. Am. 1986;79:1020–1033. doi: 10.1121/1.393374. [DOI] [PubMed] [Google Scholar]
- Gordon-Salant S. Recognition of natural and time/intensity altered CVs by young and elderly subjects with normal hearing. J. Acoust. Soc. Am. 1986;80:1599–1607. doi: 10.1121/1.394324. [DOI] [PubMed] [Google Scholar]
- Hedrick MS, Rice T. Effect of a single-channel wide dynamic range compression circuit on perception of stop consonant place of articulation. J. Speech Lang. Hear. Res. 2000;43:1174–1184. doi: 10.1044/jslhr.4305.1174. [DOI] [PubMed] [Google Scholar]
- Hickson LMH. Compression amplification in hearing aids. American Journal of Audiology. 1994;3:51–65. doi: 10.1044/1059-0889.0303.51. [DOI] [PubMed] [Google Scholar]
- Ito M, Tsuchida J, Yano M. On the effectiveness of whole spectral shape for vowel perception. J. Acoust. Soc. Am. 2001;110:1141–1149. doi: 10.1121/1.1384908. [DOI] [PubMed] [Google Scholar]
- Kiefte M, Kluender KR. The relative importance of spectral tilt in monophthongs and diphthongs. J. Acoust. Soc. Am. 2005;117:1395–1404. doi: 10.1121/1.1861158. [DOI] [PubMed] [Google Scholar]
- Klatt DH. Software for a cascade/parallel formant synthesizer. J. Acoust. Soc. Am. 1980;67:971–995. [Google Scholar]
- Klatt DH, Klatt LC. Analysis, synthesis, and perception of voice quality variations among female and male talkers. J. Acoust. Soc. Am. 1990;87:820–857. doi: 10.1121/1.398894. [DOI] [PubMed] [Google Scholar]
- Lahiri A, Gewirth L, Blumstein SE. A reconsideration of acoustic invariance for place of articulation in diffuse stop consonants: Evidence from a cross-language study. J. Acoust. Soc. Am. 1984;76:391–404. doi: 10.1121/1.391580. [DOI] [PubMed] [Google Scholar]
- Leek MR, Summers V. Auditory filter shapes of normal-hearing and hearing-impaired listeners in continuous broadband noise. J. Acoust. Soc. Am. 1993;94:3127–3137. doi: 10.1121/1.407218. [DOI] [PubMed] [Google Scholar]
- Leek MR, Summers V. Reduced frequency selectivity and the preservation of spectral contrast in noise. J. Acoust. Soc. Am. 1996;100:1796–1806. doi: 10.1121/1.415999. [DOI] [PubMed] [Google Scholar]
- Lentz JJ, Leek MR. Decision strategies of hearing-impaired listeners in spectral shape discrimination. J. Acoust. Soc. Am. 2002;111:1389–1398. doi: 10.1121/1.1451066. [DOI] [PubMed] [Google Scholar]
- Lentz JJ, Leek MR. Spectral shape discrimination by hearing-impaired and normal-hearing listeners. J. Acoust. Soc. Am. 2003;111:1389–1398. doi: 10.1121/1.1451066. [DOI] [PubMed] [Google Scholar]
- Lindholm JM, Dorman M, Taylor BE, Hannley MT. Stimulus factors influencing the identification of voiced stop consonants by normal-hearing and hearing impaired adults. J. Acoust. Soc. Am. 1988;83:1608–1614. doi: 10.1121/1.395915. [DOI] [PubMed] [Google Scholar]
- Peters RW, Moore BCJ. Auditory filter shapes at low center frequencies in young and elderly hearing-impaired subjects. J. Acoust. Soc. Am. 1992;91:256–266. doi: 10.1121/1.402769. [DOI] [PubMed] [Google Scholar]
- Sommers MS, Humes LE. Auditory filter shapes in normal-hearing, noise-masked normal, and elderly listeners. J. Acoust. Soc. Am. 1993;93:2903–2914. doi: 10.1121/1.405810. [DOI] [PubMed] [Google Scholar]
- Stevens KN, Blumstein SE. Invariant cues for place of articulation in stop consonants. J. Acoust. Soc. Am. 1978;64:1358–1368. doi: 10.1121/1.382102. [DOI] [PubMed] [Google Scholar]
- Stevens KN, Blumstein SE. The search for invariant acoustic correlates of phonetic features. In: Eimas PD, Miller JL, editors. Perspectives in the Study of Speech. New Jersey: Erlbaum, Hillsdale; 1981. pp. 1–38. [Google Scholar]
- Summers V, Leek MR. The internal representation of spectral contrast in hearing-impaired listeners. J. Acoust. Soc. Am. 1994;95:3518–3528. doi: 10.1121/1.409969. [DOI] [PubMed] [Google Scholar]
- Turek S, Dorman MF, Franks JR, Summerfield Q. Identification of synthetic/bdg/ by hearing-impaired listeners under monotic and dichotic formant presentation. J. Acoust. Soc. Am. 1980;67:1031–1040. doi: 10.1121/1.384070. [DOI] [PubMed] [Google Scholar]
- Tyler RS, Hall JW, Glasberg BR, Moore BCJ, Patterson RD. Auditory filter asymmetry in the hearing impaired. J. Acoust. Soc. Am. 1984;76:1363–1368. doi: 10.1121/1.391452. [DOI] [PubMed] [Google Scholar]
- Walley AC, Carrell TD. Onset spectra and formant transitions in the adult’s and child’s perception of place of articulation in stop consonants. J. Acoust. Soc. Am. 1983;73:1011–1022. doi: 10.1121/1.389149. [DOI] [PubMed] [Google Scholar]
- Wichmann FA, Hill NJ. The psychometric function: I. Fitting, sampling, and goodness of fit. Percept. and Psych. 2001;63:1293–1313. doi: 10.3758/bf03194544. [DOI] [PubMed] [Google Scholar]


