

Abstract
The interaction of urea and several naturally occurring protein stabilizing osmolytes, glycerol, sorbitol, glycine betaine, trimethylamine oxide (TMAO), and proline, with condensed arrays of a hydrophobically modified polysaccharide, hydroxypropylcellulose (HPC), has been inferred from the effect of these solutes on the forces acting between HPC polymers. Urea interacts only very weakly. The protein stabilizing osmolytes are strongly excluded. The observed energies indicate that the exclusion of the protein stabilizing osmolytes from protein hydrophobic side chains would add significantly to protein stability. The temperature dependence of exclusion indicates a significant enthalpy contribution to the interaction energy in contrast to expectations from ‘molecular crowding’ theories based on steric repulsion. The dependence of exclusion on the distance between HPC polymers rather indicates that perturbations of water structuring or hydration forces underlie exclusion.
Solutes are widely used to modulate the stability of native or folded conformations of proteins and nucleic acids (1–7). There are several naturally occurring osmolytes that cells synthesize to protect proteins in response to denaturing environmental conditions such as heat shock. Stabilization of compact structures typically results from an increased exclusion of solutes from the unfolded or more open conformations. There is an unfavorable interaction of solutes with exposed surfaces. The exclusion of osmolytes from surfaces necessarily means the inclusion of water and has quite naturally been termed a preferential hydration (6). Excluded, stabilizing osmolytes that are naturally occurring include glycerol, sorbitol, glycine betaine, proline, and trimethylamine oxide (TMAO) (8). Denaturation results when there are favorable interactions of solutes with exposed surface; more solutes are ‘bound’ or included with unfolded structures. Urea is probably the best known denaturant. The nature of the interaction between the solute and the macromolecule that results in exclusion or inclusion has not been satisfactorily characterized. Crowding theories that have been successful for the interaction of macromolecules (9) have been reformulated for small solute-macromolecule forces (10). This, however, does not explain the chemical specificity of the interaction. Bolen and coworkers, for example, have concluded (8, 11, 12) that the inclusion of urea and the exclusion of stabilizing osmolytes from proteins are dominated by the interaction of these small molecules with the peptide backbone with little contribution from the exclusion of these polar solutes from hydrophobic side chains. One method for elucidating the physics of the interaction is to measure the distance dependence of the force through either a radial distribution function of solutes surrounding a macromolecule or a change in solute concentration between two macromolecular surfaces as they approach each other.
For some time now we have been measuring intermolecular forces through the dependence of the distance between macromolecules in an ordered array measured by x-ray scattering on the osmotic pressure of a polymer that is excluded from the macromolecular phase and applies a force on it (13–21). The effect of solute exclusion on forces can be used to infer changes in solute concentration in the space between macromolecules as the distance between them changes. We have previously used this approach to measure the exclusion of nonpolar alcohols from ordered arrays of DNA (22, 23) and of salts and some polar solutes from hydroxypropylcellulose (HPC) (24). Here we use the osmotic stress technique coupled with x-ray scattering to investigate the inclusion or exclusion of urea and of several common protein stabilizers with the modified polysaccharide hydroxypropyl cellulose (HPC) as a model for the interaction with hydrophobic amino acid side chains. We find that urea interacts only weakly with HPC, but that the polar protein stabilizers are all significantly excluded from this hydrophobic polymer. The dependence of exclusion on the distance between HPC chains in the condensed phase is approximately exponential with ~ 3 Å decay length. The same functional form has been observed for the intermolecular force between many biomacromolecules, both charged, polar, and nonpolar, and for the exclusion of nonpolar osmolytes from the highly charged DNA surface and of salts from HPC. We have interpreted this distance dependence as due to a water structuring force. If the solute is within one or two hydration layers of the HPC polymer, the intervening water structuring is perturbed resulting in a repulsive force. Hydration energies become more unfavorable since water must accommodate both molecules simultaneously.
We also report that the exclusion of the polar solutes from HPC is significantly temperature dependent, unlike our previous observations for the exclusion of salt from HPC or of alcohols from highly charged DNA. Exclusion results from an enthalpy of interaction that is more unfavorable than the entropic contribution to the free energy, which is favorable. For both glycerol and sorbitol, in particular, ΔH and TΔS are much larger than the free energy of exclusion. This enthalpy-entropy compensation has often been attributed to hydration.
We test the estimate of the number of excess water molecules for each osmolyte determined by the osmotic stress/ x-ray scattering method by measuring the dependence of the precipitation temperature of dilute HPC on solute concentration. Not surprisingly, hydrophobically modified HPC precipitates from dilute aqueous solution as the temperature is raised. We compare the observed dependence of the transition temperature on osmolyte concentration with the value calculated from our measured solute exclusion from condensed HPC arrays. The measured values of excess water are in reasonably good agreement with measurements of the change in transition temperature. The discrepancies observed are consistent with the temperature dependence of the exclusion.
The insensitivity of HPC forces and precipitation temperature to urea is consistent with other measurements indicating that urea preferentially solvates the peptide bond and interacts very little with hydrophobic side chains (11, 25). The exclusion energies of the polar protein stabilizing osmolytes from the hydrophobic HPC chain, however, are comparable to the energies that have been ascribed to exclusion from the peptide backbone (8, 11, 26). This indicates that the exclusion of these osmolytes from nonpolar peptide side chains should significantly contribute to the stabilization of native protein structure. This is contrary to current assignment of exclusion energies of these osmolytes.
Methods and Materials
Hydroxypropylcellulose was purchased from Polysciences, Inc., and used without further purification. The average degree of hydroxypropyl substitution was 3/ glucose unit. Trimethylamine oxide (purum, >99%), sorbitol (ultra, >99.5%), l-proline (>99%), glycine betaine monohydrate (>99%), and 8000 MW poly(ethylene glycol), PEG, (Biochemika grade) were all purchased from Fluka Chemical Corp. Glycerol (ultrapure) was purchased from Gibco-BRL Life Technologies. All solutes were used without further purification.
Ordered HPC arrays were prepared by dialyzing HPC solutions against a solution of 30% PEG (20K MW) as described in Bonnet-Gonnet et al (13). Small pieces, 1 × 1 × 0.5 mm, were cut from the solid film and equilibrated against PEG or PEG/solute solutions. HPC pellets remain phase separated from PEG solutions for weight fractions > 0.2. HPC samples were transferred to fresh PEG/solute solutions after ~ 5 days initial equilibration. Osmotic pressures of PEG solutions and of PEG/solute mixtures were measured using a Wescor Vapro vapor pressure osmometer, model 5520XL. Osmotic pressures were additive to within 10% for urea and glycerol. Osmotic pressures were additive to only within 35% at the highest PEG concentration used for glycine betaine, TMAO, proline, and sorbitol. We assume that to within 10% this excess pressure results entirely from an increase in solute activity, due to an exclusion from PEG, as we observed for salt-PEG mixtures (24). Solute osmotic pressures were taken as the difference of the PEG/solute and PEG alone osmotic pressures. At fixed PEG concentration, the apparent osmotic coefficients of the solutes were insensitive to solute concentration over the range examined further indicating that the nonideality of the mixtures is due to solute exclusion from PEG.
X-ray scattering
An Enraf-Nonius Service Corp. (Bohemia, NY) fixed copper anode Diffractis 601 X-ray generator equipped with double focusing mirrors (Charles Supper Co.) was used for X-ray scattering measurements. HPC samples were sealed with a small amount of equilibrating solution in the sample cell and then mounted into a temperature-controlled holder. A helium filled Plexiglas cylinder with Mylar windows was between the sample cell and image plate, a distance of ~ 16 cm. Diffraction patterns were recorded by direct exposure of Fujifilm BAS image plates and digitized with a Fujifilm BAS 2500 scanner set for a 50 µ pixel size and 16 bit intensity. The images were analyzed using the FIT2D (copyright A.P. Hammersley, ESRF) and SigmaPlot 9.01 (SPSS Inc.) software programs. The sample to image plate distance was calibrated using powdered p-bromobenzoic acid. Mean pixel intensities between scattering radii r − 0.05 mm and r + 0.05 mm averaged over all angles of the powder pattern diffraction, <I(r)>, were used to calculate integrated radial intensity profiles, 2πr<I(r)>. The scattering peaks correspond to interaxial Bragg diffraction from HPC polymers that we correct for packing in a hexagonal array. X-ray scattering patterns were reproducible over at least several months of storage. No sample degradation was apparent. Duplicate samples were prepared for about 20% of the samples and showed that measured interaxial spacings were reproducible to within 0.2 Å
Critical Temperature of HPC Precipitation in Dilute Solution
The transition temperature of HPC was measured from the intensity of 90° scattered light at 500 nm using a Jobin-Yvon-Horiba Fluoromax-3 fluorospectrophotometer equipped with a Wavelength Electronics model LFI-3751 Peltier temperature controller. The HPC concentration was 100 µg/ mL. The temperature was increased in steps of 0.25°C and the sample allowed to equilibrium for 3 minutes at each step. Two-fold changes in concentration or temperature ramp rate did not change the transition temperature. Precipitation was reversible.
Thermodynamic Analysis
The thermodynamic analysis of the effects of solutes on the forces between macromolecules has been developed in more detail elsewhere (22–24). We only briefly outline the results here. A macroscopic phase of ordered HPC polymers is in equilibrium with the bulk solution of osmolyte and a polymer such as PEG that is excluded from the HPC phase. The osmolyte is free to equilibrate between the HPC and bulk solution phases. We consider that PEG simply applies an osmotic pressure, ΠPEG, on the HPC phase. A difference in solute concentration between the bulk solution and HPC phase can be equivalently analyzed as the solute contribution to the osmotic pressure, Πsolute, acting on an excess or deficit number of water molecules in the HPC phase per saccharide, Γw, or the solute chemical potential acting on an excess or deficit number of solute molecules, Γs, in the HPC phase. Since we observe that Γw is constant with changing solute concentration, we focus on the contribution of solute to osmotic pressure. The Gibbs-Duhem equation becomes
| (1) |
The chemical potential of HPC per glucose monomer is μHPC, Vw is the volume of water per glucose unit in the condensed phase, and is the molecular volume of water (assumed 30 Å3). The number of excess water molecules is given by the difference in solute concentration between the bulk solution and HPC phase. If the HPC phase contains Ns and Nw solute and water molecules per glucose unit, respectively, and the bulk solution contains a ratio ns/nw of solute-to-water molecules, then Γw per glucose unit is defined as,
| (2) |
This is the number of water molecules that would have to be removed or added to the HPC phase to result in the same solute concentration as in the bulk solution. The ratio (Ns/Nw)/(ns/nw) is the same as the solute partition coefficient defined in (27). If the solute is completely excluded, then .
Rearrangement of the Maxwell relation of equation (1) gives the change in the number of excess waters as helices move closer as a function of the change in PEG osmotic pressure needed to maintain constant Vw as the solute osmotic pressure is varied,
| (3) |
For hexagonal packing of polymers with spacing Dint, dVw = √3 L Dint dDint, where L is the length of a glucose monomer (assumed 5 Å). We have previously observed that ΠPEG and Πsolute are linearly interdependent at constant Vw for the exclusion of salts, glycerol, glycine betaine, and α-methyl glucoside from HPC arrays. For a linear interdependence, the slope ∂ΠPEG/∂Πsolute is simply given by the solute osmotic pressure, Π0, and the difference in PEG osmotic pressures at a constant interaxial spacing with and without added osmolyte, the apparent Πexcess. For a concentration m of solute
| (4) |
and
| (5) |
An overlap of Πexcess/Π0 for different solute concentrations means a linear interdependence of ΠPEG and Πsolute at constant Dint. The number of excess waters, Γw, can be calculated by integrating equation (3).
HPC precipitates from dilute solution as the temperature is increased to about 42°C in water. Since there is an energy associated with solute exclusion and HPC precipitation releases excess waters, the presence of excluded osmolytes will lower the transition temperature. As also developed previously (24), the dependence of the precipitation temperature, Tt, of HPC in dilute solution on the osmotic pressure of the excluded solute, Πs, is given by an analog of the Clapeyron equation,
| (6) |
ΔΓw and ΔS are the differences in the number of excess water molecules and in the entropy, respectively, between the condensed and extended states per glucose monomer. We have previously determined the transition entropy from the temperature dependence of forces between HPC polymers(13). ΔΓw can be calculated by integrating equation (3).
Results
Figure 1 shows a force curve for HPC at 20°C measured by the osmotic stress technique. The osmotic pressure of poly(ethylene glycol) (PEG) in the bulk solution that is excluded from a condensed macroscopic HPC phase is used to compact the HPC phase. The spacing between HPC chains is determined from the Bragg reflection peak of scattered x-rays. The spacing between HPC polymers dried at a very low relative humidity (< 10%) is 12.6 Å. Also shown in the figure is the effect of adding sorbitol and urea to the bulk solution on the spacing between HPC chains as a function of the PEG osmotic pressure. No change is seen with urea; whereas the spacing decreases with increasing sorbitol concentration. The partitioning of solute between the condensed HPC phase and the bulk solution can be inferred from the change in spacing between HPC macromolecules as the solute concentration is varied at constant PEG osmotic pressure as derived in equation (1) – equation (3). Essentially, the exclusion of solutes results in an extra pressure exerted on the HPC phase by the solutes as represented by the Πexcess arrow in the figure.
Figure 1.
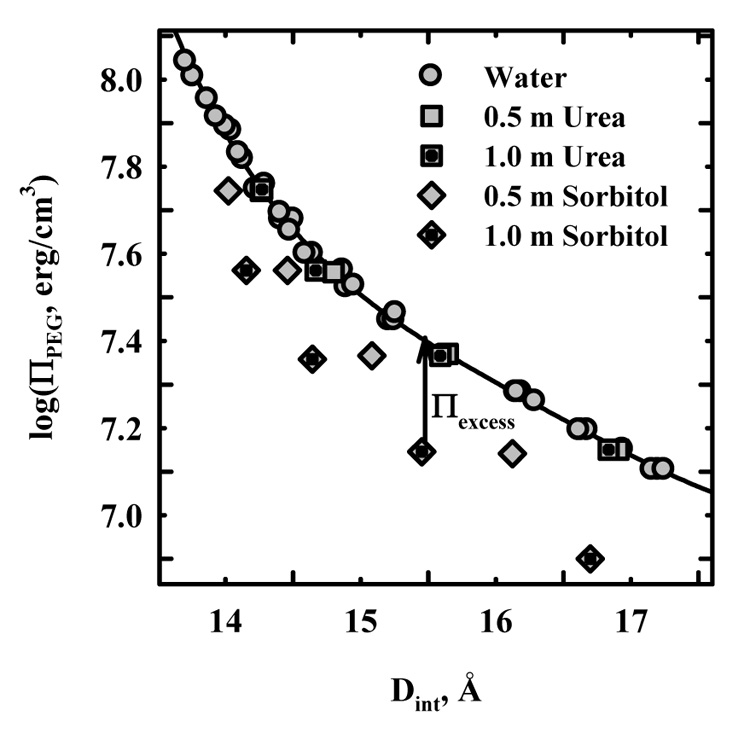
The effect of urea and sorbitol on HPC osmotic stress force curves at 20 °C. The PEG osmotic pressure dependence of the spacing between HPC chains determined from the Bragg scattering peak is shown for HPC in water, in 0.5 and 1 m urea, and in 0.5 and 1 m sorbitol. Urea has no effect on HPC forces, while intermolecular spacings are significantly closer in sorbitol at the same PEG osmotic pressure. The arrow illustrates the apparent excess osmotic pressure, Πexcess, exerted by 1 m sorbitol at ~ 15.5 Å.
Figure 2 shows the variation of Πexcess at 20 °C with the spacing between HPC polymers for several osmolytes commonly used to stabilize native protein structures: sorbitol, proline, glycine betaine, TMAO, and glycerol. The data for glycerol and glycine betaine have been reported previously, but are included here for completeness. At least two concentrations are shown for each solute. Πexcess has been normalized by the solute contribution to the bulk solution osmotic pressure, Π0, i.e., by the excess pressure if no solute was present in the HPC phase. Thus, Πexcess/Π0 = 1 means complete exclusion, while Πexcess/Π0 = 0 indicates no preferential interactions resulting in exclusion or inclusion. Πexcess/Π0 can be related to changes in preferential hydration of the HPC phase through equation (3) and equation (5). The exclusion of solute can be characterized by a number of water molecules, Γw, in excess of that expected if the concentration of solute in the bulk solution and HPC phase was the same. The overlap of the data for the different concentrations of each solute indicates that the number of waters associated with HPC that exclude solute at a fixed spacing is constant, independent of solute concentration. The curves for proline, sorbitol, and glycine betaine are virtually indistinguishable. Complete exclusion is attained at Dint ~ 14 Å. The exclusion of glycerol is only about half that of those three osmolytes. Πexcess/Π0 ratios can be adequately described by an exponential function with a decay length λ; Πexcess/Π0 ~ A exp(−Dint/λ). The decay lengths for glycerol, sorbitol, proline, and glycine betaine are all about 3 Å. This decay length is also characteristic of the exclusion of salts from HPC (24) and of nonpolar solutes from charged DNA (22, 23). TMAO shows a somewhat different behavior. As with the other osmolytes, the Πexcess/Π0 ratio is insensitive to TMAO concentration between 0.25 and 1.0 molal. The exponential decay length λ, however, is only ~ 2.2 Å. The exclusion of TMAO is complete at ~ 14 Å.
Figure 2.
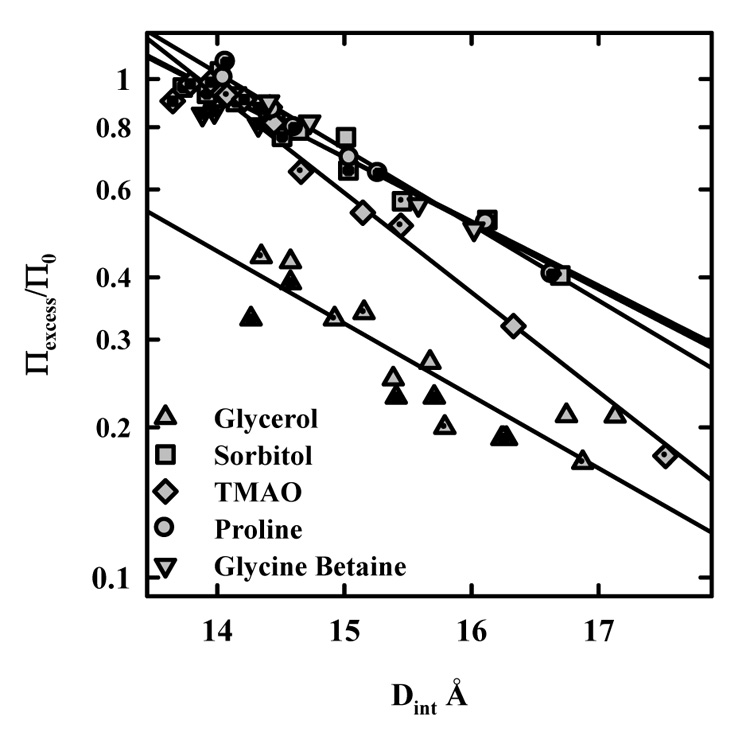
The dependence of osmolyte exclusion on the distance between HPC chains. The excess osmotic pressure as indicated in figure 1 normalized by the osmolyte contribution to the solution osmotic pressure is shown as a function of the interaxial spacing for several protein stabilizing solutes at two or three concentrations. Πexcess/Π0 = 1 corresponds to complete exclusion, while Πexcess/Π0 = 0 indicates no preferential inclusion or exclusion. The overlap of the different concentrations indicates an osmotic effect, i.e., that ΔNw is constant at a fixed Dint over the concentration range examined. The exclusion curves for sorbitol, glycine betaine, and proline are virtually identical. Glycerol is excluded more weakly. TMAO has a somewhat different exponential decay length compared with the others. The solute concentrations examined are: 0.4 and 0.8 m glycine betaine; 0.4, 0.8, and 1.2 m glycerol; 0.25, .05, and 1 m sorbitol, 0.25, 0.5, and 1 m TMAO; and 0.25 and 0.5 m proline. Plain symbols are for the lowest solute concentration, followed by dotted and crossed symbols. The different concentrations for each osmolyte overlap within experimental error indicating an osmotic effect, i.e., Γw is constant at a fixed HPC interaxial spacing insensitive to osmolyte concentration.
A total number of excess waters that can be released in pushing HPC polymers to touching can be estimated from integrating Πexcess/Π0 from ∞ to 12.6 Å (equation (3) and equation (5)). Table 1 gives this total number of excess water molecules per glucose unit and the observed decay length for the six osmolytes examined. Urea had no observable effect on the force curves and so is assigned ΔNw = 0.
Table 1.
Osmolyte exclusion from HPC at 5 and 20 °C
| Osmolyte | ΔNw,total 20 °C | λ, Å 20 °C | ΔNw,total 5 °C | λ, Å 5 °C |
|---|---|---|---|---|
| Urea | 0 | - | 0 | - |
| Glycerol | 9.7 | 3.25 | 20.3 | 3.45 |
| Sorbitol | 19.8 | 2.9 | 32.7 | 3.5 |
| TMAO | 14.7 | 2.2 | 17.5 | 1.95 |
| Proline | 19.9 | 2.9 | 27.1 | 3.3 |
| Glycine Betaine | 21.0 | 3.1 | 26.9 | 3.2 |
The total of excess water per glucose monomer is calculated by integrating the curves shown in Figure 2 from 12.6 Å to ∞ as prescribed in equation (3) assuming that Πexcess/Π0 = 1 is the maximum excess pressure. The error is ~10% for the decay length λ and ~15% for ΔNw.
The temperature dependence of exclusion
The free energy of solute exclusion can depend significantly on temperature (28, 29). This would indicate that the solute-surface interaction is more than a simple steric exclusion but that actual physical forces underlie exclusion. Figure 3 shows Πexcess/Π0 for sorbitol and proline at 5 and 20 °C. In both cases there is more exclusion at 5 °C. There are about 33 excess waters/ glucose monomer at 5 °C compared to ~20 at 20 °C for sorbitol. The exponential decay length λ, however, does not depend significantly on temperature. Decay lengths and total numbers of excess water calculated by integrating Πexcess/Π0 from ∞ to 12.6 Å for 5 °C are also given in Table 1 for the osmolytes examined.
Figure 3.
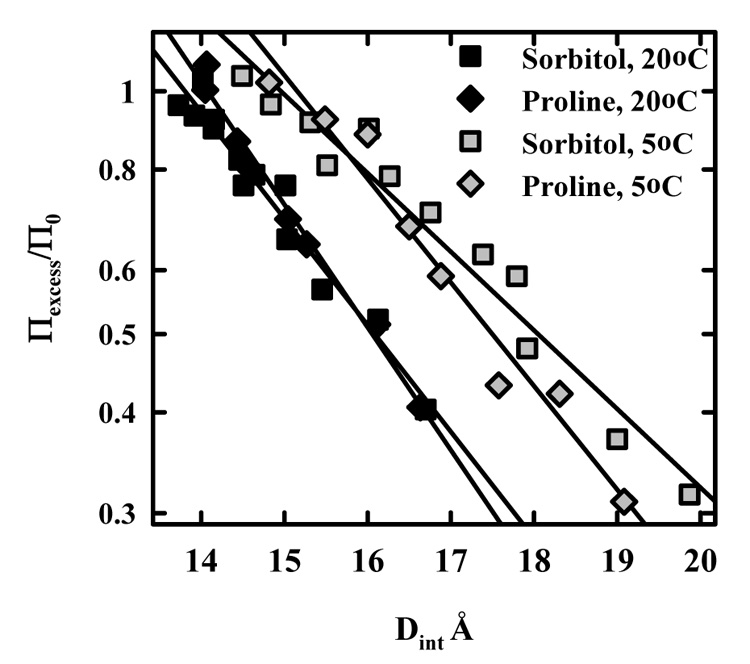
The temperature dependence of sorbitol and proline exclusion. The dependence of apparent excess osmotic pressure normalized by the osmolyte contribution to the solution osmotic pressure, Πexcess/Π0, on interaxial HPC spacing is shown for sorbitol and proline at 5 and 20 °C. The exclusion of both is significantly higher at 5 °C than at 20 °C.
The effect of osmolytes on HPC precipitation
Hydroxypropylcellulose will spontaneously precipitate from dilute solution as the temperature is increased due to favorable hydrophobic interactions. The exclusion of solutes from HPC must necessarily affect the transition temperature. Figure 4 shows the intensity of 90° scattered light as a function of temperature for dilute HPC (~100 µg/ml) in water and in 1 m proline. The midpoint transition without added osmolyte occurs at ~ 42 °C as has been observed by many others (13). Proline causes a significant decrease in the cloud-point temperature.
Figure 4.
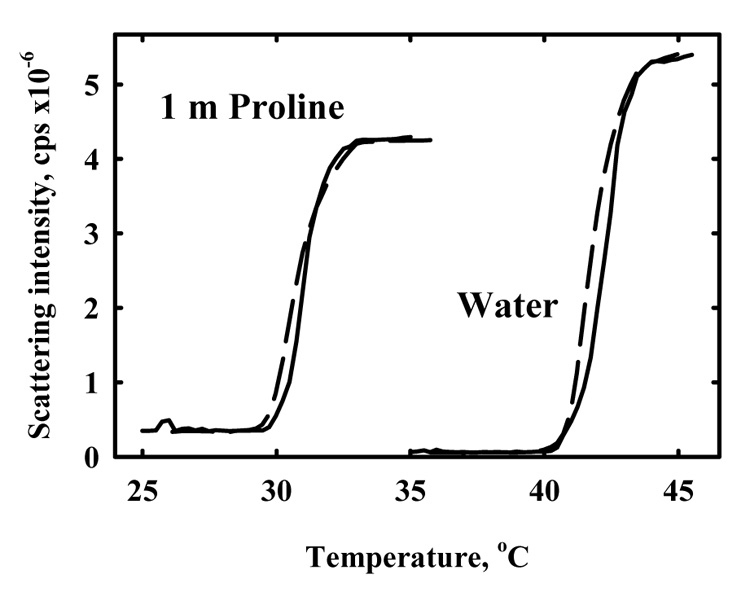
The effect of proline on the temperature favored precipitation of HPC. The temperature dependence of the 90° scattering intensity is shown for HPC in water and in 1 m proline. HPC concentration is 100 µg/mL. Heating curves are shown by the solid lines and cooling curves by the dashed lines. The transition is reversible to within 0.5 °C. Proline significantly reduces the transition temperature.
Figure 5 shows the dependence of the midpoint transition temperature, Tt, on solute concentration for TMAO, betaine glycine, sorbitol, proline, glycerol, and urea. Data for the strongly kosmotropic salt KF that was reported previously are also included for comparison. The osmolal concentration of KF is about twice the molal concentration (to within 10%). To a first order approximation, the dependence of Tt on solute concentration is linear. The correction of molal to osmotic pressure osmolal concentrations for the net neutral solutes is small in the range examined (<15%). Consistent with the x-ray osmotic stress measurements, urea has little effect on the transition. Indeed, the transition temperature actually increases slightly with increasing urea concentration. Of the other solutes, glycerol is the least effective also in agreement with the exclusion curves shown in figure 2. TMAO, betaine glycine, sorbitol, and proline are all comparable again in qualitative agreement with figure 2.
Figure 5.
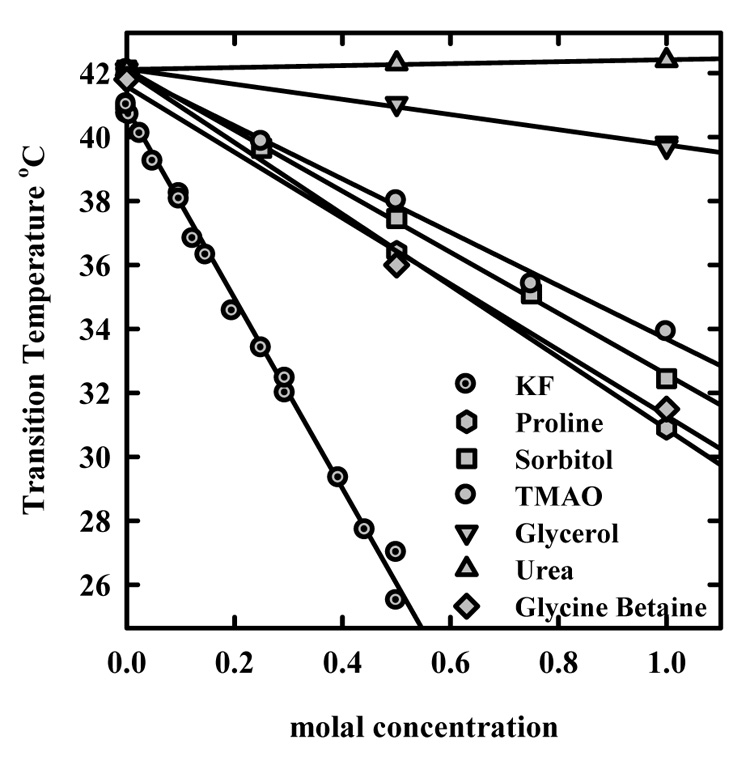
The dependence of the precipitation transition temperature on osmolyte concentration. The decrease in precipitation temperature with increasing concentration of the protein stabilizing osmolytes is consistent with exclusion. The slope depends both on the number of excess water molecules released and on the entropy change across the transition as indicated in equation (6).
As given in equation (6), the slopes, d Tt/d [osmolal], depend on the transition entropy and the change in the number of excess water molecules between the polymer in dilute solution and in the precipitated aggregate. We have previously determined the distance dependent entropy from the temperature dependence of the forces between HPC polymers in condensed arrays (13). The distance between polymers in the precipitate is assumed to be the same as the 13.9 Å spacing measured by x-ray scattering between polymers in ordered arrays at the 42 °C transition point between repulsion and attraction. Since both ΔNw and ΔS show similar 3 Å decay length exponential dependences on the distance between HPC chains, the exact spacing in the precipitated assembly is not critical. The observed slopes and slopes calculated using ΔS as previously determined and ΔNw values from integrating the solute exclusion curves at 20 °C shown in figure 2 are given in Table 2. A comparison of observed dTt/d[osm] values and calculated slopes is a sensitive test of the osmolyte concentration distribution curves shown in figure 2 and figure 3. The calculated slopes are always somewhat larger than observed. This is likely because exclusion is temperature dependent. ΔNw values for betaine glycine, TMAO, proline, sorbitol, and glycerol decrease as the temperature increases. The largest difference between calculated and observed slopes is for glycerol that also has the largest change in ΔNw between 5 and 20 °C. The smallest discrepancy (10%) is for TMAO that also has the smallest difference in ΔNw between 5 and 20 °C. The calculated and observed slopes for KF are also within 10%. We previously reported observing no significant difference in ΔNw between 5 and 20 °C for KF exclusion. The data in figure 5 are not sufficiently precise, however, to extract an accurate temperature dependence of exclusion. The exclusion of TMAO, glycine betaine, sorbitol, and proline is comparable to the strongly kosmotropic salt KF.
Table 2.
Observed and calculated dependences of HPC precipitation temperatures on osmolyte concentration.
| Osmolyte | ||
|---|---|---|
| Urea | +0.3 | 0 |
| Glycerol | −2.4 | −6.4 |
| Sorbitol | −9.55 | −13.6 |
| TMAO | −8.35 | −9.0 |
| Proline | −11.2 | −13.7 |
| Glycine Betaine | −9.7 | −13.4 |
| KF | −13.9 | −15.3 |
Observed slopes are determined from the data shown in figure 5 and have an error of 5%. The calculated slopes are determined from equation (6) with ΔS = 12 cal/°K/ mole glucose monomer as determined previously at 13.9 Å and with ΔNw determined at 20 °C integrating exclusion curves from 13.9 Å to ∞. Calculated slopes have an error of ~ 30%.
Discussion
There is now a vast literature on the interaction of small solutes and salts with macromolecules. Excluded osmolytes can stabilize native protein, RNA, and DNA structures, promote the assembly of macromolecular complexes, and strongly increase ligand affinity, see, for example, (4, 30, 31). The exclusion of small solutes and salts from macromolecular surfaces and cavities necessarily means that water is included, i.e., a preferential hydration. Different structures, conformations, or assemblies have different numbers of included or excess water molecules. Excluded osmolytes modulate the equilibrium between two states through their osmotic pressure acting on the difference in the numbers of included or excess water molecules (4, 32).
The outstanding problems are: (1) parsing the preferential hydration contributions from various chemical groups on macromolecules, e.g., the contributions from the peptide backbone, hydrophobic, hydrophilic and charged side chains to the overall exclusion from proteins and (2) understanding the physics underlying solute exclusion. Several groups have begun examining preferential hydration contributions from the dependence of exclusion on the chemical character of the exposed surface (33–35). Bolen and coworkers (11, 36), for example, have measured the dependence of the solubility of amino acids and amino acid derivatives on solute concentration in order to estimate the contributions from the peptide backbone and side chains. The Schellman model (37) is commonly taken as the physical basis for exclusion, combining steric exclusion or crowding and a relative solute-water binding constant for solvation interactions with the macromolecule. The Kirkwood-Buff formalism links radial distribution functions to the observed inclusion of water or exclusion of solute (2, 38, 39).
We have devised a method to measure changes in solute concentration in ordered condensed arrays of macromolecules. The distance between macromolecules depends on the net osmotic pressure exerted by the bulk solution. Large polymers such as PEG are completely excluded and apply their total osmotic pressure on the ordered array of macromolecules. Solutes that are partially excluded apply only a fraction of their total osmotic pressure. The apparent excess solute osmotic pressure due to exclusion can be determined by relating the change in spacing due to added osmolyte to the equivalent additional PEG pressure necessary to achieve the same spacing in the absence of solute. The change in the number of excess water molecules can then be calculated as a function of the distance between polymers using this excess pressure and equation (3) and equation (5). Other measurements of preferential hydration give a single number of excluded water molecules. The excess pressure measurements using the osmotic stress/x-ray scattering approach, in contrast, give a distance dependence of exclusion so that the underlying physics can be probed.
We have previously examined the exclusion of nonpolar alcohols from highly charged DNA arrays (22, 23) and of salts from nonpolar HPC arrays (24). The salts follow the Hofmeister series (40) with KF more excluded than KCl which is more excluded than KBr. Alcohols with a greater excess of alkyl carbons over hydroxyl oxygens were more excluded from DNA. The two systems showed common features. The total number of excess water molecules was ~ 9 per interacting KF - HPC hydroxypropyl group and ~ 10 water molecules per DNA NaPhosphate – isopropanol interaction. Both KF and NaPhosphate are strong kosmotropes (40). The dependence of the change in solute concentration on the distance between DNA helices or HPC polymers was also quite similar. Exclusion from both the DNA and HPC systems could be described by an exponential function with an approximate 3 Å decay length.
The results presented here extend our observations of a common mechanism for exclusion of small solutes from macromolecular surfaces. In agreement with the measurements of Bolen and coworkers (11) and with calculations (25), we see no interaction of urea with the hydrophobic groups on HPC at 5 or 20 °C. Urea increases slightly the precipitation transition temperature of HPC, suggesting that urea may be slightly included at elevated temperatures. This non-effect of urea could be due to a cancellation of steric exclusion balanced by specific binding but only if the distance dependence of these two is the same which seems unlikely.
The protein stabilizers, TMAO, glycine betaine, proline, and sorbitol, are all strongly excluded from HPC. The ~20 excess water molecules per saccharide unit for proline, glycine betaine, and sorbitol at 20 °C translates into a transfer energy from water to a 1 osmolal solution of solute of ~ 200 cal/ mole glucose monomer. If the interaction between these polar or zwitterionic solutes and HPC is dominated by exclusion from the 3 hydroxypropyl groups that cover the glucose monomer, then the transfer energy is ~ 65 cal per mole hydroxypropyl group. Exclusion is somewhat smaller for TMAO at 20 °C corresponding to 50 cal/mol at 1 osmolal. The transfer energy for a hydroxypropyl group into 1 osmolal glycerol is only 30 cal/mol at 20 °C. These energies are similar to those inferred from changes in solubility of glycylglycine by Auton and Bolen (41) for the same solutes and ascribed to exclusion from the peptide bond. Recalculating transfer energies for 1 osmolal rather than for 1 M solutions of solute, the peptide unit transfer energies reported by Auton and Bolen (41) are ~70 cal/mol/osm for TMAO, ~55 cal/mol/osm for glycine betaine, ~40 cal/mol/osm for proline, ~30 cal/mol/osm for sorbitol, and ~12 cal/mol/osm for glycerol. Only the exclusion energy for TMAO from the peptide unit is larger than for the hydroxypropyl group of HPC even though the peptide unit and a hydroxypropyl group are about the same size. Venkatesu et al. (42) estimate also from solubility measurements ~ 40 cal/mole for the transfer of a single methyl group (three apolar hydrogens) from water to 1 M TMAO or glycine betaine at 25 °C that corresponds to ~ 1.2 osmolal for both solutes.
Bolen and coworkers (8, 26, 41) have assigned the bulk of the transfer energy to the exclusion of these protein stabilizers from the peptide backbone rather than amino acid side chains. We find that exclusion of these polar osmolytes from HPC hydroxypropyl groups results in energies even larger than those estimated for the peptide bond. The exclusion of these polar osmolytes from hydrophobic amino acid side chains should contribute substantially to protein stability. The solubility method used by Bolen and coworkers to determine exclusion assumes that only monomers are present at the solubility limit or, more precisely, that the proportion of monomers compared with associated higher order species does not change with osmolyte concentration at the solubility limit. It is possible that different solutes, however, can promote to different extents the formation of dimers, for example. This will make interpretation of solubility changes problematic.
The dependence of exclusion on the distance between HPC polymers for these protein stabilizers is consistent with our other measurements of exclusion of salts from HPC and of alcohols from DNA. To a first order approximation, exclusion is characterized by an exponential function with an approximate 3 Å decay length. This functional form is widely observed for the forces at close distances, the last 10 to 15 Å separation, between many macromolecules from highly charged DNA to completely uncharged HPC and schizophyllan (13, 14, 21, 43). We have postulated that this common repulsive force is due to unfavorable restructuring of water between surfaces as they approach. The approximate 10–15 Å range corresponds to approximately two hydration layers on each surface. In contrast to the emphasis on the effect of isolated solutes on water structuring (44–46), the hydration force results from the inability of water to hydrate optimally two surfaces at close distances. The structuring of water around one surface affects the structuring around the other. In essence, the hydration force is a distance dependent measure of the preference of the osmolyte and surface for water. The 3 Å decay length is the water – water correlation length within the hydration force framework. There could, however, be an additional contribution to this decay length from the loss of configurational entropy of the osmolyte in the constricted space between HPC polymers. The amplitude of exclusion is a measure of the extent of disruption of water structuring between the two surfaces. This hydration framework gives a plausible rationale for the exclusion amplitude of salts in the Hofmeister series observed previously (24).
As seen in figure 2, the force amplitude for exclusion of sorbitol is two-fold larger than for the homologous polyol glycerol that is half the size. This is consistent with our previous observation on the interaction of nonpolar alcohols with DNA (22). Exclusion scaled linearly with number of alkyl carbons in excess of hydroxyl groups for chemically homologous solutes, not size directly. This dependence is not due to a steric exclusion, but rather the magnitude of solute exclusion seems to be a simple sum of the interaction energies of individual constituent chemical groups comprising the solute with the structurally repetitive macromolecular HPC and DNA surfaces. Sorbitol has twice the exclusion magnitude of glycerol because it has twice as many hydroxyl groups interacting with HPC.
If the structuring of the interacting water around either the solute or the macromolecular surface is temperature dependent, then exclusion will also be temperature dependent. The effect of excluded salts on the adamantane-cyclodextrin binding reaction has been shown to be primarily enthalpic with little contribution from entropy (28). This is in contrast to expectations from hard sphere steric exclusion or crowding that predicts exclusion is entropic. The protein stabilizers examined here have a significant temperature dependence of exclusion from HPC. At 1 osmolal solute concentration, the free energy change due to exclusion from Nw water molecules per mole saccharide is,
If we neglect heat capacity terms, then the enthalpy contribution can be crudely approximated as,
where ΔNw(T) is the difference in the number of excess water molecules between two temperatures, T and T + ΔT. Table 3 summarizes ΔG, ΔH, and −TΔS for the protein stabilizing osmolytes with HPC at 20 °C based on the difference between 5 and 20 °C. In general, the enthalpic and entropic contributions to ΔG are opposite in sign and much larger than the free energy. The net exclusion free energy is due to a larger enthalpy magnitude than entropy. These thermodynamic properties are quite similar to those reported for the effect of sucrose on the adamantine-cyclodextrin binding reaction (28) and of poly(ethylene glycol) on the guanylate kinase-GMP/ATP binding reaction (29). This general behavior has been termed entropy-enthalpy compensation (47, 48) and has often been attributed to changes in solvation which would be consistent with a hydration force rationale behind exclusion.
Table 3.
Free energies, enthalpies and entropies of osmolyte exclusion at 20 °C
| Osmolyte | ΔG, cal/mol/osm | ΔH, cal/mol/osm | −TΔS, cal/mol/osm |
|---|---|---|---|
| Glycerol | 100 | 2300 | −2200 |
| Sorbitol | 200 | 2650 | −2450 |
| TMAO | 150 | 600 | −350 |
| Proline | 200 | 1700 | −1500 |
| Glycine Betaine | 220 | 1400 | −1180 |
The thermodynamic parameters are calculated for 20 °C per mole glucose monomer. The error in ΔG is ~15%. The errors for ΔH and −TΔS values are ~30%
Conclusions
Urea interacts only weakly with the hydrophobic surface of HPC indicating that the interaction of urea with hydrophobic protein side chains will contribute little to denaturation. The exclusion of the protein stabilizing osmolytes examined from the hydrophobic side chains of HPC is as large as their suggested exclusion from the peptide backbone indicating a significant contribution to protein stabilization from the exclusion of these solutes from hydrophobic amino acid side chains. The dependence of exclusion on the spacing between HPC polymers in a condensed array is consistent with an interaction between solute and surface mediated by water structuring energetics, a hydration force. The exclusion of the polar, protein stabilizing osmolytes from HPC is temperature dependent suggesting that the energetics of water structuring between solute and surface is temperature sensitive.
Abbreviations
- HPC
hydroxypropylcellulose
- PEG
poly(ethylene glycol)
- TMAO
trimethylamine oxide
Footnotes
This research was supported by the Intramural Research Program of NIH and NICHD.
Contributor Information
Christopher Stanley, NIST Center for Neutron Research, National Institute of Standards and Technology, Gaithersburg, MD 20899 and LPSB, NICHD, National Institutes of Health, Bethesda, MD 20892.
Donald C. Rau, LPSB, NICHD, National Institutes of Health, Bethesda, MD 20892.
References
- 1.Somero GN. Protons, osmolytes, and fitness of internal milieu for protein function. Am. J. Physiol. 1986;251:R197–R123. doi: 10.1152/ajpregu.1986.251.2.R197. [DOI] [PubMed] [Google Scholar]
- 2.Rosgen J. Molecular basis of osmolyte effects on proteins and metabolites. Methods Enzymol. 2007;428:459–486. doi: 10.1016/S0076-6879(07)28026-7. [DOI] [PubMed] [Google Scholar]
- 3.Record J, M T, Zhang W, Anderson CF. Analysis of effects of salts and uncharged solutes on protein and nucleic acid equilibria and processes: A practical guide to recognizing and interpreting polyelectrolyte effects, Hofmeister effects, and osmotic effects of salts. Adv. Prot. Chem. 1998;51:281–353. doi: 10.1016/s0065-3233(08)60655-5. [DOI] [PubMed] [Google Scholar]
- 4.Parsegian VA, Rand RP, Rau DC. Macromolecules and water: Probing with osmotic stress. Methods Enzymol. 1995;259:43–94. doi: 10.1016/0076-6879(95)59039-0. [DOI] [PubMed] [Google Scholar]
- 5.Timasheff SN. Protein hydration, thermodynamic binding, and preferential hydration. Biochem. 2002;41:13473–13482. doi: 10.1021/bi020316e. [DOI] [PubMed] [Google Scholar]
- 6.Timasheff SN. Control of protein stability and reactions by weakly interacting cosolvents: The simplicity of the complicated. Adv. Prot. Chem. 1998;51:355–432. doi: 10.1016/s0065-3233(08)60656-7. [DOI] [PubMed] [Google Scholar]
- 7.Timasheff SN. The control of protein stability and association by weak interactions with water: How do solvents affect these processes? Annu. Rev. Biophys. Biomol. Struct. 1993;22:67–97. doi: 10.1146/annurev.bb.22.060193.000435. [DOI] [PubMed] [Google Scholar]
- 8.Bolen DW, Baskakov IV. The osmophobic effect: Natural selection of a thermodynamic force in protein folding. J. Mol. Biol. 2001;310:955–963. doi: 10.1006/jmbi.2001.4819. [DOI] [PubMed] [Google Scholar]
- 9.Minton AP. Implications of macromolecular crowding for protein assembly. Curr. Opin. Struct. Biol. 2000;10:34–39. doi: 10.1016/s0959-440x(99)00045-7. [DOI] [PubMed] [Google Scholar]
- 10.Davis-Searles PR, Saunders AJ, Erie DA, Winzor DJ, Pielak GJ. Interpreting the effects of small uncharged solutes on protein-folding equilibria. Annu. Rev. Biophys. Biomol. Struct. 2001;30:271–306. doi: 10.1146/annurev.biophys.30.1.271. [DOI] [PubMed] [Google Scholar]
- 11.Auton M, Holthauzen LMF, Bolen DW. Anatomy of energetic changes accompanying urea-induced protein denaturation. Proc. Natl. Acad. Sci. USA. 2007;104:15317–15322. doi: 10.1073/pnas.0706251104. [DOI] [PMC free article] [PubMed] [Google Scholar]
- 12.Auton M, Bolen DW. Predicting the energetics of osmolyte-induced protein folding/unfolding. Proc. Natl. Acad. Sci. USA. 2005;102:15065–15068. doi: 10.1073/pnas.0507053102. [DOI] [PMC free article] [PubMed] [Google Scholar]
- 13.Bonnet-Gonnet C, Leikin S, Chi S, Rau DC, Parsegian VA. Measurement of forces between hydroxypropylcellulose polymer: Temperature favored assembly and salt exclusion. J. Phys. Chem. B. 2001;105:1877–1886. [Google Scholar]
- 14.Leikin S, Parsegian VA, Rau DC, Rand RP. Hydration forces. Annu. Rev. Phys. Chem. 1993;44:369–395. doi: 10.1146/annurev.pc.44.100193.002101. [DOI] [PubMed] [Google Scholar]
- 15.Leikin S, Rau DC, Parsegian VA. Direct measurement of forces between self-assembled proteins: Temperature-dependent exponential forces between collagen triple helices. Proc. Natl. Acad. Sci. USA. 1994;91:276–280. doi: 10.1073/pnas.91.1.276. [DOI] [PMC free article] [PubMed] [Google Scholar]
- 16.Leikin S, Rau DC, Parsegian VA. Temperature-favoured assembly of collagen is driven by hydrophilic not hydrophobic interactions. Nature Struct. Biol. 1995;2:205–210. doi: 10.1038/nsb0395-205. [DOI] [PubMed] [Google Scholar]
- 17.Parsegian VA, Rand RP, Fuller NL, Rau DC. Osmotic stress for the direct measurement of intermolecular forces. Methods Enzymol. 1986;127:400–416. doi: 10.1016/0076-6879(86)27032-9. [DOI] [PubMed] [Google Scholar]
- 18.Podgornik R, Strey HH, Gawrisch K, Rau DC, Rupprecht A, Parsegian VA. Bond orientational order, molecular motion, and free energy of high-density DNA mesophases. Proc. Natl. Acad. Sci. USA. 1996;93:4261–4266. doi: 10.1073/pnas.93.9.4261. [DOI] [PMC free article] [PubMed] [Google Scholar]
- 19.Rau DC, Parsegian VA. Direct Measurement of forces between linear polysaccharides xanthan and schizophyllan. Science. 1990;249:1278–1281. doi: 10.1126/science.2144663. [DOI] [PubMed] [Google Scholar]
- 20.Rau DC, Parsegian VA. Direct measurement of the intermolecular forces between counterion-condensed DNA double helices: Evidence for long range attractive hydration forces. Biophys. J. 1992;61:246–259. doi: 10.1016/S0006-3495(92)81831-3. [DOI] [PMC free article] [PubMed] [Google Scholar]
- 21.Strey HH, Podgornik R, Rau DC, Parsegian VA. DNA-DNA interactions. Curr. Opin. Struct. Biol. 1998;8:309–313. doi: 10.1016/s0959-440x(98)80063-8. [DOI] [PubMed] [Google Scholar]
- 22.Stanley C, Rau DC. Preferential hydration of DNA: The magnitude and distance dependence of alcohol and polyol interactions. Biophys. J. 2006;91:912–920. doi: 10.1529/biophysj.106.086579. [DOI] [PMC free article] [PubMed] [Google Scholar]
- 23.Hultgren A, Rau DC. Exclusion of alcohols from spermidine-DNA assemblies: Probing the physical basis of preferential hydration. Biochem. 2004;43:8272–8280. doi: 10.1021/bi049559s. [DOI] [PubMed] [Google Scholar]
- 24.Chik J, Mizrahi S, Chi S, Parsegian VA, Rau DC. Hydration forces underlie the exclusion of salts and of neutral polar solutes from hydroxypropylcellulose. J. Phys. Chem. B. 2005;109:9111–9118. doi: 10.1021/jp046999k. [DOI] [PubMed] [Google Scholar]
- 25.O'Brien EP, Dima RI, Brooks B, Thirumalai D. Interactions between hydrophobic and ionic solutes in aqueous guanidinium chloride and urea solutions: Lessons for protein denaturation mechanism. J. Amer. Chem. Soc. 2007;129:7346–7353. doi: 10.1021/ja069232+. [DOI] [PubMed] [Google Scholar]
- 26.Liu Y, Bolen DW. The peptide backbone plays a dominant role in protein stabilization by naturally occurring osmolytes. Biochem. 1995;34:12884–12891. doi: 10.1021/bi00039a051. [DOI] [PubMed] [Google Scholar]
- 27.Felitsky DJ, Record MT., Jr Application of the local-bulk partitioning and competitive binding models to interpret preferential interactions of glycine betaine and urea with protein surface. Biochem. 2004;43:9276–9288. doi: 10.1021/bi049862t. [DOI] [PubMed] [Google Scholar]
- 28.Harries D, Rau DC, Parsegian VA. Solutes probe hydration in specific association of cyclodextrin and adamantane. J. Amer. Chem. Soc. 2005;127:2184–2190. doi: 10.1021/ja045541t. [DOI] [PubMed] [Google Scholar]
- 29.Stanley C, Rau DC. Protein structure and hydration probed by SANS and osmotic stress. Biophys. J. doi: 10.1529/biophysj.107.122697. (in press) [DOI] [PMC free article] [PubMed] [Google Scholar]
- 30.Harries D, Rosgen J. A practical guide on how osmolytes modulate macromolecular properties. Methods Cell Biol. 2008;84:679–735. doi: 10.1016/S0091-679X(07)84022-2. [DOI] [PubMed] [Google Scholar]
- 31.Auton M, Bolen DW. Application of the transfer model to understand how naturally occurring osmolytes affect protein stability. Methods Enzymol. 2007;428:397–418. doi: 10.1016/S0076-6879(07)28023-1. [DOI] [PubMed] [Google Scholar]
- 32.Parsegian VA, Rand RP, Rau DC. Osmotic stress, crowding, preferential hydration, and binding: A comparison of perspectives. Proc. Natl. Acad. Sci. USA. 2000;97:3987–3992. doi: 10.1073/pnas.97.8.3987. [DOI] [PMC free article] [PubMed] [Google Scholar]
- 33.Hong J, Capp MW, Anderson CF, Saecker RM, Felitsky DJ, Anderson MW, Record MT., Jr Preferential interactions of glycine betaine and of urea with DNA: Implications for DNA hydration and for effects of these solutes on DNA stability. Biochem. 2004;43:14744–14758. doi: 10.1021/bi049096q. [DOI] [PubMed] [Google Scholar]
- 34.Felitsky DJ, Cannon JG, Capp MW, Hong J, Van Wynsberghe AW, Anderson CF, Record MT., Jr The exclusion of glycine betaine from anionic biopolymer surface: Why glycine betaine is an effective osmoprotectant but also a compatible solute. Biochem. 2004;43:14732–14743. doi: 10.1021/bi049115w. [DOI] [PubMed] [Google Scholar]
- 35.Schwinefus JJ, Kuprian MJ, Lamppa JW, Merker WE, Dorn KN, Muth GW. Human telomerase RNA pseudoknot and hairpin thermal stability with glycine betaine and urea: Preferential interactions with RNA secondary and tertiary structures. Biochem. 2007;46:9068–9079. doi: 10.1021/bi602637v. [DOI] [PubMed] [Google Scholar]
- 36.Street TO, Bolen DW, Rose GD. A molecular mechanism for osmolyte-induced protein stability. Proc. Natl. Acad. Sci. USA. 2006;103:13997–14002. doi: 10.1073/pnas.0606236103. [DOI] [PMC free article] [PubMed] [Google Scholar]
- 37.Schellman JA. A simple model for solvation in mixed solvents: Applications to the stabilization and destabilization of macromolecular structures. Biophys. Chem. 1990;37:121–140. doi: 10.1016/0301-4622(90)88013-i. [DOI] [PubMed] [Google Scholar]
- 38.Schurr JM, Rangel DP, Aragon SR. A contribution to the theory of preferential interaction coefficients. Biophys. J. 2005;89:2258–2276. doi: 10.1529/biophysj.104.057331. [DOI] [PMC free article] [PubMed] [Google Scholar]
- 39.Smith PE. Cosolvent interactions with biomolecules: Relating computer simulation data to experimental thermodynamic data. J. Phys. Chem. B. 2004;108:18716–18724. [Google Scholar]
- 40.Collins KD, Washabaugh MW. The Hofmeister effect and the behaviour of water at interfaces. Quart. Rev. Biophys. 1985;18:323–422. doi: 10.1017/s0033583500005369. [DOI] [PubMed] [Google Scholar]
- 41.Auton M, Bolen DW. Additive transfer free energies of the peptide backbone unit that are independent of the model compound and the choice of concentration scale. Biochem. 2004;43:1329–1342. doi: 10.1021/bi035908r. [DOI] [PubMed] [Google Scholar]
- 42.Venkatesu P, Lee M-J, Lin H-M. Thermodynamic characterization of the osmolyte effect on protein stability and the effect of GdnHCL on the protein denatured state. J. Phys. Chem. B. 2007;111:9045–9056. doi: 10.1021/jp0701901. [DOI] [PubMed] [Google Scholar]
- 43.McIntosh TJ. Short-range interactions between lipid bilayers measured by X-ray diffraction. Curr. Opin. Struct. Biol. 2000;10:481–485. doi: 10.1016/s0959-440x(00)00118-4. [DOI] [PubMed] [Google Scholar]
- 44.Bennion BJ, Daggett V. Counteraction of urea-induced protein denaturation by trimethylamine N-oxide: A chemical chaperone at atomic resoution. Proc. Natl. Acad. Sci. USA. 2004;101:6433–6438. doi: 10.1073/pnas.0308633101. [DOI] [PMC free article] [PubMed] [Google Scholar]
- 45.Daggett V. Protein folding-simulation. Chem. Rev. 2006;106:1898–1916. doi: 10.1021/cr0404242. [DOI] [PubMed] [Google Scholar]
- 46.Batchelor JD, Olteanu A, Tripathy A, Pielak GJ. Impact of protein denaturants and stabilizers on water structure. J. Amer. Chem. Soc. 2004;126:1958–1961. doi: 10.1021/ja039335h. [DOI] [PubMed] [Google Scholar]
- 47.Grunwald E, Steel C. Solvent reorganization and thermodynamic enthalpy-entropy compensation. J. Amer. Chem. Soc. 1995;117:5687–5692. [Google Scholar]
- 48.Qian H, Hopfield JJ. Entropy-enthalpy compensation: Perturbation and relaxation in thermodynamic systems. J. Chem. Phys. 1996;105:9292–9298. [Google Scholar]