Abstract
We investigate if known extrinsic and intrinsic factors fully account for the complex features observed in recordings of human activity as measured from forearm motion in subjects undergoing their regular daily routine. We demonstrate that the apparently random forearm motion possesses dynamic patterns characterized by robust scale-invariant and nonlinear features. These patterns remain stable from one subject to another and are unaffected by changes in the average activity level that occur within individual subjects throughout the day and on different days of the week, since they persist during daily routine and when the same subjects undergo time-isolation laboratory experiments designed to account for the circadian phase and to control the known extrinsic factors. Further, by modeling the scheduled events imposed throughout the laboratory protocols, we demonstrate that they cannot account for the observed scaling patterns in activity fluctuations. We attribute these patterns to a previously unrecognized intrinsic nonlinear multi-scale control mechanism of human activity that is independent of known extrinsic factors such as random and scheduled events, as well as the known intrinsic factors which possess a single characteristic time scale such as circadian and ultradian rhythms.
Keywords: Activity, Circadian rhythm, Multi-scale regulation, Self-similar, Fractal
1. Introduction
Control of human activity is complex, being influenced by many factors both extrinsic (work, recreation, reactions to unforeseen random events) and intrinsic (the circadian pacemaker that influences our sleep/wake cycle [1, 2] and ultradian oscillators with shorter time scales [3, 4]). The extrinsic factors may account for the apparently random fluctuations in human motion observed over short-time scales while the intrinsic rhythms may account for the underlying regularity in average activity level over longer periods of up to 24 h. Further, human activity correlates with important physiological functions including whole body oxygen consumption and heart rate [5–8].
2. Methods
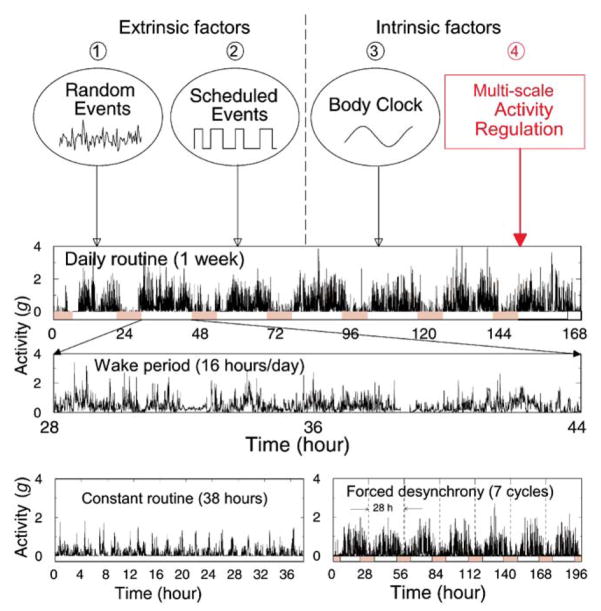
Actiwatch devices are traditionally used to demarcate sleep versus wakefulness based on average activity levels, or to observe the mean pattern of activity as it changes across the day and night according to disease state (Fig. 1) [9–12]. The subject wears a wristwatch-sized Actiwatch recorder (Mini-Mitter Co., OR, USA) that unobtrusively measures changes in forearm acceleration in any plane (sensitive to 0.01g, where g is the acceleration due to gravity) [12]. Each data point recorded in the device’s internal memory represents the value of changes in acceleration sampled at 32 Hz and integrated over a 15-s epoch length. Recordings are made continuously for different experimental protocols over several weeks, yielding approximately 105 data points for each subject. Inhomogeneity of recording sensitivity across the range of activities is accounted for in the analyses.
Fig. 1.
Independent contributors to the complex dynamics of human activity, depicted at the top of the figure, include: ➀ reaction to extrinsic random events, ➁ scheduled activities and, ➂ intrinsic factors, notably the endogenous circadian pacemaker which influences the sleep/wake cycle. Our findings of scale-invariant activity patterns (Figs. 2–7) indicate a heretofore-unidentified intrinsic multi-scale control of human activity ➃, which is independent of other extrinsic and intrinsic factors such as ➀, [➁, and ➂. The second panel illustrates an actual one-week recording of human activity [12] during the daily routine protocol. Data structure highlights a 24-h sleep/wake periodic change in the mean activity—lowest during sleep (filled bars). The third panel, expanding a 16-h section of wakefulness, also shows patches of high and low average activity levels with apparent erratic fluctuations at various time scales. The bottom left panel is an activity recording from the same subject during the constant routine protocol with much lower average activity values compared to daily routine. The clear 2-h cycle is a result of scheduled laboratory events. The bottom right panel shows activity levels in the same subject during the forced desynchrony protocol, characterized by a 28-h sleep/wake cycle (as opposed to the 24-h rhythm in activity data during the daily routine).
Traditionally activity fluctuations are considered as random noise and have been ignored. We hypothesize that there are systematic patterns in the activity fluctuations that may be independent of known extrinsic and intrinsic factors. To test our hypotheses, we evaluate the structure of human activity during wakefulness, using: (i) probability distribution analysis; (ii) power spectrum analysis, and (iii) fractal scaling and nonlinear analysis. To elucidate the presence of an intrinsic activity control center independent of known circadian, ultradian, scheduled and random factors, we apply 3 complementary protocols.
Daily routine protocol: We record activity data throughout two consecutive weeks in 16 healthy ambulatory domiciliary subjects (8 males, 8 females, 19–44 years, mean 27 years) performing their routine daily activities. The only imposed constraints are that subjects go to bed and arise at the same time each day (8 h sleep opportunity) and that they are not permitted to have daytime naps (Fig. 1).
Constant routine protocol: To assess intrinsic activity controllers (i.e., circadian or other neural centers) independent of scheduled and random external influences, activity recordings are made in the laboratory throughout 38 h of constant posture (semi-recumbent), wakefulness, environment (21°C, dim light [< 8 lux]), dietary intake and scheduled events [13, 14]. This protocol is performed in a subset of subjects (7 males, 4 females) that participated in the daily routine protocol. These highly controlled and constant experimental conditions result in reduced average and variance of activity levels.
Forced desynchrony protocol: To test for the presence of heretofore unidentified intrinsic activity control centers, independent of known activity regulators (circadian pacemaker), while accounting for scheduled and random external influences, we employ the validated Forced desynchrony (FD) protocol [2]. Six (4 male, 2 female) of the 16 subjects that participated in the daily routine protocol completed the FD limb of the study. For 8 days subjects remain in constant dim light (to avoid “resetting” the body clock). Sleep periods are delayed by 4 h every day, such that subjects live on recurring 28 h “days”, while all scheduled activities become desynchronized from the endogenous circadian pacemaker. Thus, as measurements occur across all phases of the circadian clock, the effect of intrinsic circadian influences can be removed [2]. Average activity level and activity variance are also significantly reduced due to laboratory-imposed restrictions on the subjects activity (Fig. 1).
3. Results and discussion
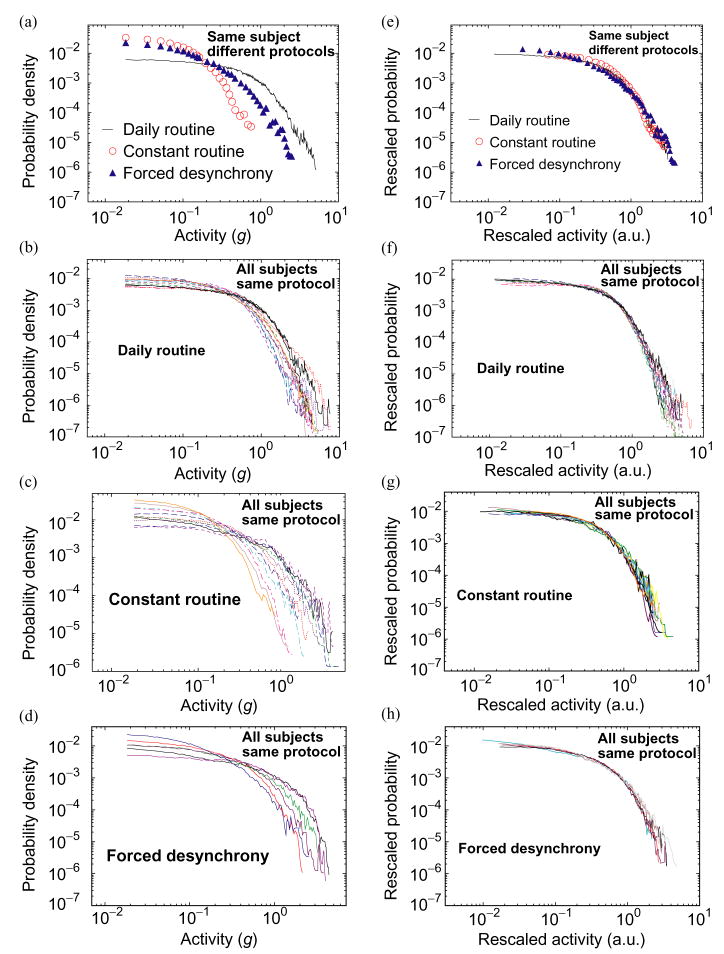
When the same subject is studied in different protocols, we find large differences in the probability distributions (Fig. 2). For example, during wakefulness greater values of activity occur most frequently during the daily routine, intermediate activity values occur during the forced desynchrony, and the highest frequency of low activity values is seen during the constant routine (Fig. 2a). Indeed, the largest activity values encountered during the constant routine protocol are approximately two orders of magnitude less frequent than similar activity values encountered in the daily routine protocol. We find major differences between individuals in the distribution of activity values during the daily routine protocol (Fig. 2b). Such differences are expected given the different daily schedules, environments, and reactions to random events.
Fig. 2.
Common functional form for the probability distributions of activity values. (a) Probability distributions of activity values during wakefulness for an individual subject during 14 consecutive days of daily routine, 38 h of constant routine and 8 days of the forced desynchrony protocol. Probability distributions for all subjects during (b) the daily routine protocol, (c) the constant routine, and (d) the forced desynchrony protocol, indicate large difference between individuals. (e)–(h) Same probability distributions as in (a)–(d), after appropriately rescaling both axes. Data points for all subjects and for all three protocols collapse onto a single curve.
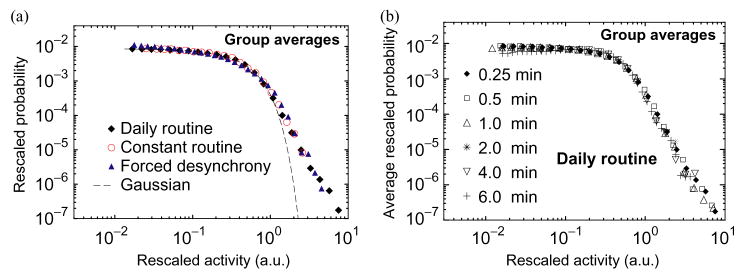
To test if the individual probability density curves follow a common functional form, we appropriately rescale the distributions of activity values on both axes to account for differences in average activity level and standard deviation while preserving the normalization to unit area. We divide the activity values by a constant, A0, and multiply the probability density function by the same constant, where A0 is the activity value before rescaling of each individual curve for which the cumulative probability (i.e., the area under the density function curve) is 60%. We find a remarkable similarity in the shapes of the probability distributions for each subject in all three protocols (Fig. 2e), and for all individuals when in the same protocol (Fig. 2f–h). The existence of a universal form of the probability distribution, independent of activity level in all individuals and in all protocols (Fig. 3a), suggests that a common underlying mechanism may account for the overall distribution of activity.
Fig. 3.
(a) Group average of the rescaled distributions during all three protocols. All distributions collapse onto a single curve, suggesting a common underlying mechanism of activity regulation. The same rescaling procedure as in Fig. 2 is used. (b) Group average of all individual distributions rescaled as in (a) obtained for varied time windows during the daily routine.
This probability distribution when plotted on a log–log scale reveals different characteristics above and below a distinct crossover point (Fig. 3a). At scales above the crossover activity level there is pronounced non-Gaussian tail (Fig. 3a). This tail on the log–log plot represents a power-law form, indicating an intrinsic self-similar structure for a range of activity values. Moreover, we find that the observed shape of the rescaled probability distribution remains unchanged when the data series are reanalyzed using a variety of observation windows ranging from 15 s to 6 min (Fig. 3b). This stability of the probability distribution over a range of time scales indicates that the underlying dynamic mechanisms controlling the activity have similar statistical properties on different time scales. Statistical self-similarity is a defining characteristic of fractal objects [15–17] and is reminiscent of a wide class of physical systems with universal scaling properties [15, 18]. Our finding of a universal form of the probability distribution raises the possibility of an intrinsic mechanism that influences activity values in a self-similar “fractal” manner, that is unrelated to the individual’s daily and weekly schedules, reactions to the environment, the average level of activity, the phase of the circadian pacemaker, and the time scale of observation.
We next perform power spectral analyses for all three protocols to determine whether there exist any systematic intrinsic ultradian rhythms of activity with periods of less than 24 h duration [3, 19]. The data for each individual exhibit occasional peaks in the daily routine protocol for periods ranging from 30 min to 4 h. However, we find no systematic ultradian rhythms within individuals from week to week, and no systematic ultradian rhythms in the group average for the daily routine protocol (Fig. 4). The only systematic rhythms that are ostensibly in the ultradian range which emerge in the group data are at 4 h during the forced desynchrony protocol (with harmonics at 2 h and 80 min) and at 2 h during the constant routine protocol (with harmonics at 1 h and 30 min) (Figs. 1 and 4). These peaks are caused by the controlled scheduled activities in the laboratory and are extrinsic to the body as they also occur in simulated scheduled activity data that assumes specific activity values for each scheduled behavior imposed throughout the laboratory protocols (Fig. 4). Thus, we find no evidence of systematic intrinsic ultradian rhythms in our data.
Fig. 4.
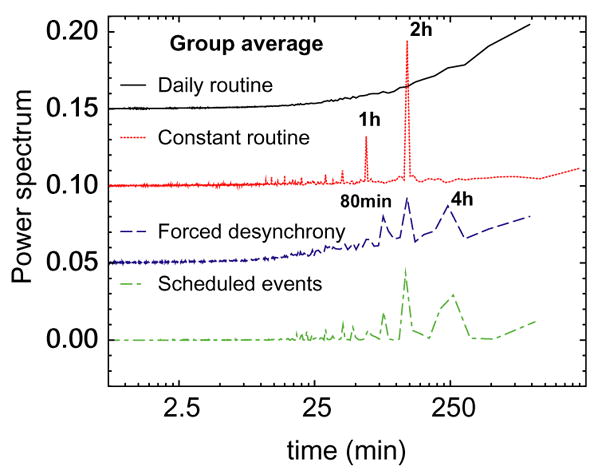
Group average power spectral densities for all three protocols. Curves are vertically offset. Power spectra are shown with decreasing frequency from left to right. Smooth behavior of the daily routine curve suggests absence of periodic rhythms in the ultradian range. The spectral density peaks for the simulated scheduled activity data representing controlled scheduled events during the protocol (bottom curve) match the peaks observed in the original human activity data recorded during the forced desynchrony protocol. Our analysis and simulation suggest that the observed peaks in the power spectrum are due to scheduled laboratory events and cannot be attributed to endogenous ultradian rhythms.
To provide further insight into the dynamic control of activity, we next examine the temporal organization in the fluctuations in activity values that is responsible for the stability of the distribution form at different time scales (Fig. 3b). We perform detrended fluctuation analysis (DFA) which quantifies correlations in the activity fluctuations after accounting for nonstationarity in the data by subtracting underlying polynomial trends [20–23]. The DFA method quantifies the root mean square fluctuations, F(n), of a signal at different time scales n. Power-law functional form, F(n) ~ nα, indicates self-similarity (fractal scaling). The parameter α, called the scaling exponent, quantifies the correlation properties in the signal: if α=0.5, there is no correlation (random noise); if α < 0.5, the signal is anticorrelated, where large activity values are more likely to be followed by small activity values; if α > 0.5, there are positive correlations, where large activity values are more likely to be followed by large activity values (and vice versa for small activity values).
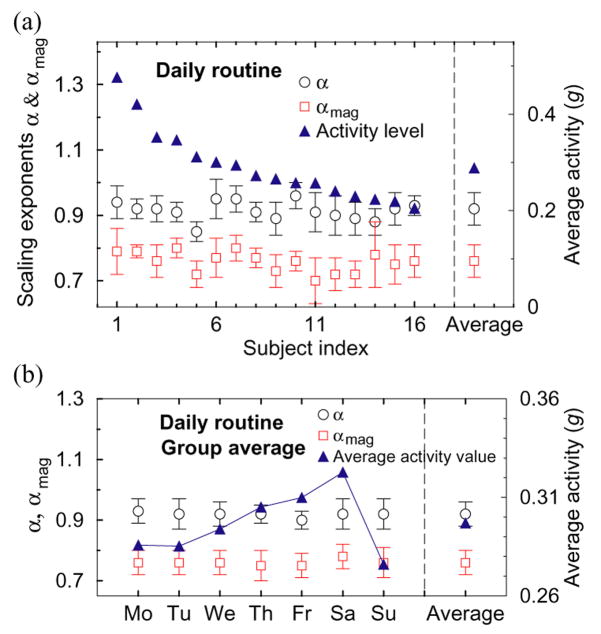
Fig. 5a shows that F(n) for a typical subject during wakefulness exhibits a power-law form over time scales from ≈1 min to ≈4 h. We find that the scaling exponent α is virtually identical for records obtained during the first week of daily routine (α = 0.92 ± 0.04, mean ± standard deviation among subjects), the second week (α = 0.92 ± 0.06) of the daily routine, the constant routine protocol (α = 0.88 ± 0.05), and the forced desynchrony protocol (α = 0.92 ± 0.03). The value of α ≈ 0.9 for all protocols and all individuals indicates that activity fluctuations are characterized by strong long-range positive correlations, and thus are not dominated by random factors. Furthermore, we find that this scaling behavior is not caused by the scheduled activities because simulated scheduled activity data that are generated by assigning a specific activity value for each scheduled event throughout the laboratory protocols yields an exponent of α=1.5 (Fig. 5a), which represents random-walk type behavior [24]. These results suggest that the activity fluctuations are not a consequence of random events (in which case α would be 0.5) or scheduled events, but rather relate to an underlying mechanism of activity control with stable fractal-like features over a wide range of time scales from minutes to hours. Since mean activity levels and the amplitude of the fluctuations are greatly reduced in the laboratory during the constant routine and forced desynchrony protocols (Fig. 1), we obtain smaller values of F(n) (downward shift of the lines in Fig. 5a). However, there is no change in the scaling exponent α. Similarly, the scaling exponents for the daily routine protocol are independent of the average activity levels of the different subjects (Fig. 6a), the mean activity level on different days of the week (Fig. 6b), and of the circadian phase, suggesting that this scaling pattern of activity fluctuations appears to be an intrinsic feature.
Fig. 5.
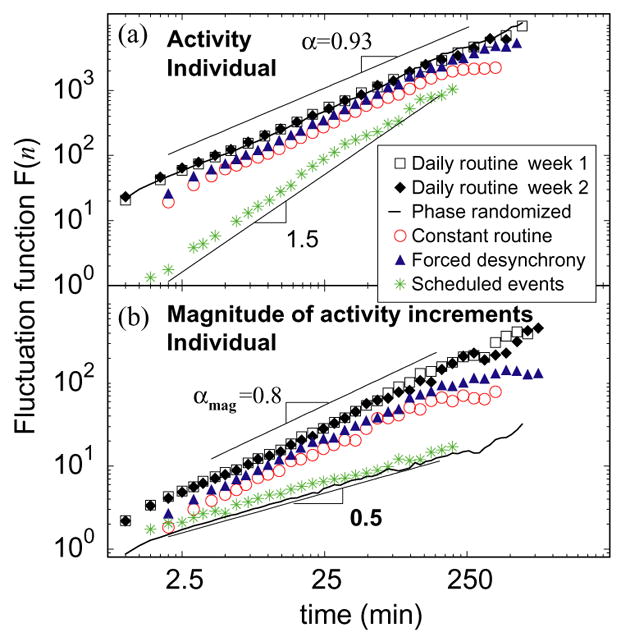
Long-range fractal correlations and nonlinearity in activity fluctuations. (a) DFA scaling of activity fluctuation for a subject during wakefulness, demonstrating strong positive correlations on time scales from seconds to hours. (b) DFA scaling of the magnitude series of activity increments for the same signals as in (a). A scaling exponent αmag ≈ 0.8 of similar value is observed for all three protocols, consistent with robust nonlinear dynamics.
Fig. 6.
Stability of scaling and nonlinear features: (a) Scaling exponents αand αmag (left scale), and average activity levels (right scale) for all 16 subjects obtained from a 14-day daily routine protocol. Although the average activity level between subjects changes considerably (from 0.2 to 0.5), both scaling exponents are consistent for all subjects, exhibiting a group average of α = 0.92 ± 0.05 and αmag = 0.77 ± 0.05. (b) Group average scaling exponents αand αmag calculated for different days of the week. While the average activity level progressively increases throughout the week (with a peak on Saturday and a minimum on Sunday), the group average scaling exponents α and αmag remain practically constant, consistent with a robust underlying mechanism of control characterized by fractal and nonlinear features which do not change with activity level.
To test for the presence of nonlinear properties of the data, we analyze the “magnitude series” formed by taking the absolute values of the increments between consecutive activity values [25, 26]. Again, from detrended fluctuation analysis of this series, we find practically identical scaling exponents, αmag, for all three protocols, despite large differences in mean activity levels between protocols (Fig. 5b). Moreover, all individuals have very similar values of the scaling exponent αmag (Fig. 6a), which are not systematically changed by the protocol. For the group, during the first week of daily routine, we find αmag = 0.78 ± 0.06 (mean ± standard deviation among subjects), during the second week αmag = 0.76 ± 0.05, during the constant routine protocol αmag =0.82 ± 0.05, and during the forced desynchrony protocol αmag =0.80 ± 0.04. Since αmag ≈ 0.8( > 0.5), there are positive long-range correlations in the magnitude series of activity increments, indicating the existence of nonlinear properties related to Fourier phase interactions (Fig. 5b) [26, 27]. To confirm that the observed positive correlations in the magnitude series indeed represent nonlinear features in the activity data, we do the following test: we generate a surrogate time series by performing a Fourier transform on the activity recording from the same subject during daily routine as in Fig. 5a, preserving the Fourier amplitudes but randomizing the phases, and then performing an inverse Fourier transform. This procedure eliminates nonlinearities, preserving only the linear features of the original activity recording such as the power spectrum and correlations. Thus, the new surrogate signal has the same scaling behavior with α = 0.93 (Fig. 5a) as the original activity recording; however, it exhibits uncorrelated behavior for the magnitude series (αmag = 0.5) (Fig. 5b). Our results show that the activity data contains important phase correlations which are canceled in the surrogate signal by the randomization of the Fourier phases, and that these correlations do not exist in the simulated scheduled activity. Further, our tests indicate that these nonlinear features are encoded in Fourier phase, suggesting an intrinsic nonlinear mechanism [27]. The similar value of αmag for all three protocols and all individuals, which is different from αmag = 0.5 obtained for the simulated scheduled activity and for the phase randomized data, confirms that the intrinsic dynamics possess nonlinear features that are independent of the daily and weekly schedules, reaction to the environment, the average level of activity, and the phase of the circadian pacemaker.
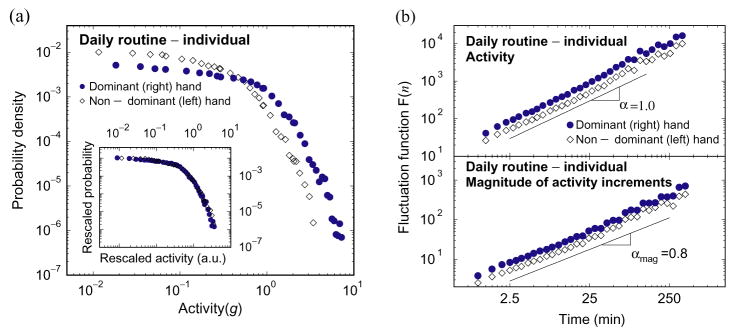
To determine whether or not there is any alteration of the intrinsic patterns for dominant and non-dominant (left and right) hands [28], we record 1 week of activity data of the left and right hands simultaneously for five additional subjects in the daily protocol. For all subjects, we find that the form of activity distribution (Fig. 7a) and the power-law correlations (Fig. 7b) are the same for dominant (more active) and non-dominant hands, confirming that the observed intrinsic patterns are independent of activity level.
Fig. 7.
Comparison of left and right wrist activity. In five additional subjects, we continuously measure both left and right wrist activity levels simultaneously for 1 week. (a) Distributions of left and right wrist activity for a typical subject. The subject is right-handed, and the activity level and variance of the right wrist is larger than that of the left wrist. As a result, compared to the left wrist, the right wrist has a smaller probability at small activity level, and a larger probability at large activity level. After the same rescaling as in Fig. 2(e)–(h), the distributions of the left wrist activity and the right wrist activity collapse onto the same curve. The functional form of this curve is the same as obtained in Fig. 2(e)–(h) and Fig. 3. (b) DFA results of left and right wrist activity fluctuations reveal practically identical power-law correlations—the same value of α. The smaller values of F(n) (vertical shift) for the left wrist are due to the smaller average activity level and variance of the left hand.
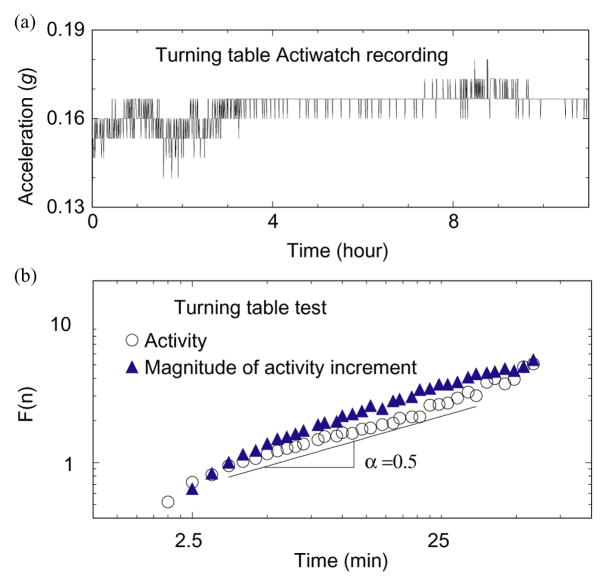
Finally, to ensure that the power-law correlations are not an artifact produced by the instrument, we obtain “test” activity data by attaching an Actiwatch to a 15 cm radius disk, turning at constant angular velocity of 45 rpm (Fig. 8a). The activity values of the Actiwatch fluctuate only slightly, and analysis of these random fluctuations reveals scaling exponents α ≈ 0.5 and αmag ≈ 0.5 (Fig. 8b), which indicate random linear behavior. Thus, the stable values of α and αmag observed in our subjects throughout the varied protocols do not depend on the recording device, but instead these exponents are inherent characteristics of the subjects, and that both hands have the same underlying dynamics of activity regulation.
Fig. 8.
Turning table test for the Actiwatch device suggests the observed scaling features in activity fluctuations are not an artifact of the device. (a) Data recorded from an Actiwatch placed on a disk rotating with constant angular velocity. (b) DFA correlation analysis of the fluctuations in (a) shows random noise behavior, in contrast to the strong positive correlations in activity fluctuations (Figs. 5 and 7).
In summary, the findings reported here offer insights into the mechanisms of human wrist activity control. Prior to our work, it has been a general belief, though never tested, that fluctuations in activity during wakefulness are somewhat random, influenced mainly by extrinsic factors such as reactions to unforeseen random events. Our findings of a stable form for the probability distribution, long-range power-law correlations and nonlinar Fourier-phase features on time scales from seconds to hours, and the consistency of our results among individuals and for different protocols, suggest that there exist previously unrecognized complex dynamic patterns of human activity that are unrelated to extrinsic factors or to the average level of activity. We also show these scale-invariant patterns to be independent of known intrinsic factors related to the circadian and to any ultradian rhythms. Notably, (i) these patterns are unchanged when obtained at different phases of the circadian pacemaker; (ii) we do not observe systematic intrinsic ultradian rhythms in activity among subjects in the daily routine experiment; (iii) imposing strong extrinsic ultradian rhythms at 4 and 2 h in the laboratory protocols did not change the fractal scaling exponents α or αmag or the form of the probability distribution; and (iv) we find consistent results over a wide range of time scales. Together, these findings strongly suggest that our results are not a reflection of the basic rest activity cycles or ultradian rhythms. We attribute these novel scale-invariant patterns to a robust intrinsic multi-scale mechanism of regulation (Fig. 1). Further, our findings suggest that activity control may be based on a multiple-component nonlinear feedback mechanism encompassing coupled neuronal nodes located both in the central and peripheral nervous systems, each acting in a specific range of time scales [29]. This insight provides key elements and guidance for future studies focused on modeling locomotor regulation [30, 31].
Acknowledgments
We are grateful to M. Casa, F. Ding, A. L. Goldberger, and A. White for helpful discussions. We also thank C. Arrabito and F. Bell from the Research and Development Department of Mini-Mitter Corporation for discussions on the technical specifications of the Actiwatch. This work was supported by NIH grants HL01016, HL64815 and HL071972, NIH/National Center for Research Resources and NSF.
References
- 1.Dijk DJ, Czeisler CA. Neurosci Lett. 1994;166:63. doi: 10.1016/0304-3940(94)90841-9. [DOI] [PubMed] [Google Scholar]
- 2.Czeisler CA, Duffy JF, Shanahan TL, Brown EN, Mitchell JF, Rimmer DW, Ronda JM, Silva EJ, Allan JS, Emens JS, Dijk DJ, Kronauer RE. Science. 1999;284:2177. doi: 10.1126/science.284.5423.2177. [DOI] [PubMed] [Google Scholar]
- 3.Kleitman N. Sleep. 1982;5:311. doi: 10.1093/sleep/5.4.311. [DOI] [PubMed] [Google Scholar]
- 4.Lavie P. Chronobiol Int. 1989;6:21. doi: 10.3109/07420528909059139. [DOI] [PubMed] [Google Scholar]
- 5.Patterson SM, Krantz DS, Montgomery LC, Deuster PA, Hedges SM, Nebel LE. Psychophysiology. 1993;30:296. doi: 10.1111/j.1469-8986.1993.tb03356.x. [DOI] [PubMed] [Google Scholar]
- 6.Ch Ivanov P, Bunde A, Amaral LAN, Havlin S, Fritsch-Yelle J, Baevsky RM, Stanley HE, Goldberger AL. Europhys Lett. 1999;48:594. doi: 10.1209/epl/i1999-00525-0. [DOI] [PubMed] [Google Scholar]
- 7.Aoyagi N, Ohashi K, Tomono S, Yamamoto Y. Am J Physiol Heart Circ Physiol. 2000;278:H1035. doi: 10.1152/ajpheart.2000.278.4.H1035. [DOI] [PubMed] [Google Scholar]
- 8.Leary AC, Donnan PT, MacDonald TM, Murphy MB. Am J Hypertens. 2000;13:1067. doi: 10.1016/s0895-7061(00)01186-9. [DOI] [PubMed] [Google Scholar]
- 9.AncoliIsrael S, Clopton P, Klauber MR, Fell R, Mason W. Sleep. 1997;20:24. doi: 10.1093/sleep/20.1.24. [DOI] [PMC free article] [PubMed] [Google Scholar]
- 10.Sadeh A, Hauri PJ, Kripke DF, Lavie P. Sleep. 1995;18:288. doi: 10.1093/sleep/18.4.288. [DOI] [PubMed] [Google Scholar]
- 11.Hening WA, Walters AS, Wagner M, Rosen R, Chen V, Kim S, Shah M, Thai O. Sleep. 1999;22:901. doi: 10.1093/sleep/22.7.901. [DOI] [PubMed] [Google Scholar]
- 12.Jean-Louis G, Mendlowicz MV, Gillin JC, Rapaport MH, Kelsoe JR, Zizi F, Landolt HP, Von Gizycki H. Physiol Behav. 2000;70:49. doi: 10.1016/s0031-9384(00)00228-6. [DOI] [PubMed] [Google Scholar]
- 13.Czeisler CA, Kronauer RE, Allan JS, Duffy JF, Jewett ME, Brown EN, Ronda JM. Science. 1989;244:1328. doi: 10.1126/science.2734611. [DOI] [PubMed] [Google Scholar]
- 14.Brown EN, Czeisler CA. J Biol Rhythm. 1992;7:177. doi: 10.1177/074873049200700301. [DOI] [PubMed] [Google Scholar]
- 15.Stanley HE. Introduction to phase transitions and critical phenomena. Oxford University Press; New York: 1971. [Google Scholar]
- 16.Vicsek T. Fractal growth phenomena. 2. World Scientific; Singapore: 1992. [Google Scholar]
- 17.Bunde A, Havlin S. Fractals in science. Springer-Verlag; Berlin: 1994. [Google Scholar]
- 18.Stanley HE, Meakin P. Nature. 1988;335:405. [Google Scholar]
- 19.Lewis BD, Kripke DF, Bowden DM. Physiol Behav. 1977;18:283. doi: 10.1016/0031-9384(77)90134-2. [DOI] [PubMed] [Google Scholar]
- 20.Buldyrev SV, Goldberger AL, Havlin S, Peng CK, Stanley HE, Simons M. Biophys J. 1993;65:2673. doi: 10.1016/S0006-3495(93)81290-6. [DOI] [PMC free article] [PubMed] [Google Scholar]
- 21.Peng CK, Buldyrev SV, Havlin S, Simons M, Stanley HE, Goldberger AL. Phys Rev E. 1994;49:1685. doi: 10.1103/physreve.49.1685. [DOI] [PubMed] [Google Scholar]
- 22.Hu K, Ch Ivanov P, Chen Z, Carpena P, Stanley HE. Phys Rev E. 2001;64:011114. doi: 10.1103/PhysRevE.64.011114. [DOI] [PubMed] [Google Scholar]
- 23.Chen Z, Ch Ivanov P, Hu K, Stanley HE. Phys Rev E. 2002;65:041107. doi: 10.1103/PhysRevE.65.041107. [DOI] [PubMed] [Google Scholar]
- 24.Shlesinger MF, West BJ. Random Fluctuations and Pattern Growth: Experiments and Models. Kluwer Academic; Boston: 1988. [Google Scholar]
- 25.Liu Y, Gopikrishnan P, Cizeau P, Meyer M, Peng CK, Stanley HE. Statistical properties of the volatility of price fluctuations. Phys Rev E. 1999;60:1390. doi: 10.1103/physreve.60.1390. [DOI] [PubMed] [Google Scholar]
- 26.Ashkenazy Y, Ch Ivanov P, Havlin S, Peng CKCK, Goldberger AL, Stanley HE. Phys Rev Lett. 2001;86:1900. doi: 10.1103/PhysRevLett.86.1900. [DOI] [PubMed] [Google Scholar]
- 27.Ch Ivanov P, Amaral LAN, Goldberger AL, Havlin S, Rosenblum MG, Struzik ZR, Stanley HE. Nature. 1999;399:461. doi: 10.1038/20924. [DOI] [PubMed] [Google Scholar]
- 28.Nagels G, Marion P, Pickut BA, Timmermans L, DeDeyn PP. Electromyogr Motor control-electroencephalography. Clin Neurophysiol. 1996;101:226. doi: 10.1016/0924-980x(96)95566-6. [DOI] [PubMed] [Google Scholar]
- 29.Winters JM, Loeb G. In: Biomechanics and Neural Control of Posture and Movement. Winters JM, Crago PE, editors. Springer; New York: 2000. [Google Scholar]
- 30.Haudsdorff JM, Peng CK, Ladin Z, Wei JY, Goldberger AL. J Appl Physiol. 1995;78:349. doi: 10.1152/jappl.1995.78.1.349. [DOI] [PubMed] [Google Scholar]
- 31.Chen YQ, Ding MZ, Kelso JAS. Phys Rev Lett. 1997;79:4501. [Google Scholar]


