Abstract
Human behaviors can be more powerfully influenced by conditioned reinforcers, such as money, than by primary reinforcers. Moreover, people often change their behaviors to avoid monetary losses. However, the effect of removing conditioned reinforcers on choices has not been explored in animals, and the neural mechanisms mediating the behavioral effects of gains and losses are not well understood. To investigate the behavioral and neural effects of gaining and losing a conditioned reinforcer, we trained rhesus monkeys for a matching pennies task in which the positive and negative values of its payoff matrix were realized by the delivery and removal of a conditioned reinforcer. Consistent with the findings previously obtained with non-negative payoffs and primary rewards, the animal's choice behavior during this task was nearly optimal. Nevertheless, the gain and loss of a conditioned reinforcer significantly increased and decreased, respectively, the tendency for the animal to choose the same target in subsequent trials. We also found that the neurons in the dorsomedial frontal cortex, dorsal anterior cingulate cortex, and dorsolateral prefrontal cortex often changed their activity according to whether the animal earned or lost a conditioned reinforcer in the current or previous trial. Moreover, many neurons in the dorsomedial frontal cortex also signaled the gain or loss occurring as a result of choosing a particular action as well as changes in the animal's behaviors resulting from such gains or losses. Thus, primate medial frontal cortex might mediate the behavioral effects of conditioned reinforcers and their losses.
Introduction
Behaviors are seldom rewarded immediately by primary reinforcers, such as food. Instead, strengths of many behaviors are enhanced or diminished by conditioned reinforcers that have been previously associated with primary reinforcements or punishments (Wolfe, 1936; Kelleher and Gollub, 1962; Kazdin, 1977). In humans, the loss of conditioned reinforcers as a result of a particular behavior can subsequently suppress the same behavior. Namely, the loss of conditioned reinforcers, such as money, is punishing, and this is referred to as response cost (Weiner, 1962; Kazdin, 1972, 1977). Although reinforcing effects of conditioned reinforcers are well documented for many animal species, how choices are controlled by the loss of conditioned reinforcers has been rarely studied in animals (Nader and Morgan, 2001; Pietras and Hackenberg, 2005). In the present study, we characterized how the gains and losses of conditioned reinforcers influence the choice behaviors of rhesus monkeys.
Previous studies on neural activity related to gains and losses of conditioned reinforcers were exclusively performed in humans. For example, studies based on scalp recordings and neuroimaging have shown that information about monetary gains and losses is rapidly processed (Gehring and Willoughby, 2002; Holroyd et al., 2004) and influences neural activity in multiple brain areas (Elliott et al., 1997; Delgado et al., 2000; Knutson et al., 2000; O'Doherty et al., 2001, 2003; Remijnse et al., 2005; Kim et al., 2006; Liu et al., 2007; Seymour et al., 2007; Wrase et al., 2007). In contrast, animal studies have mostly investigated the neural activity related to aversive outcomes using a pavlovian conditioning procedure in which the aversive outcomes are delivered regardless of the animal's behavior (Paton et al., 2006; Joshua et al., 2008; Matsumoto and Hikosaka, 2009), or using an avoidance task in which aversive outcomes could be almost entirely avoided (Nishijo et al., 1988; Koyama et al., 2001; Kobayashi et al., 2006; Hosokawa et al., 2007). As a result, it has remained difficult to elucidate the neural mechanisms responsible for adjusting the animal's behavioral strategy based on the aversive outcomes of its previous choices. Similarly, how the neural signals related to positive and negative outcomes influence subsequent choices oppositely is not known.
In the present study, we trained rhesus monkeys in a token-based binary choice task, in which tokens exchangeable with juice reward could be gained or lost. During this task, gains and losses are expressed in the same currency, which is critical for the comparison of neural activity related to gains and losses. We found that neurons modulating their activity according to the gains and losses of conditioned reinforcers were common in multiple regions of the prefrontal cortex. Furthermore, neurons in the dorsomedial frontal cortex were more likely to change their activity related to the animal's upcoming choice differently according to the previous choice and its outcome than those in the dorsal anterior cingulate cortex and dorsolateral prefrontal cortex. Thus, the dorsomedial frontal cortex might play a unique role in adjusting the animal's decision-making strategy based on the gains and losses of conditioned reinforcers.
Materials and Methods
Animal preparations and data acquisition.
Two male (H and J; body weight, 9∼11 kg) and one female (K; body weight, 6 kg) rhesus monkeys were used. Their eye positions were monitored at a sampling rate of 225 Hz with a high-speed eye tracker (ET49; Thomas Recording). Single-neuron activity was recorded from the dorsomedial frontal cortex (DMFC), dorsal anterior cingulate cortex (ACCd), or dorsolateral prefrontal cortex (DLPFC), using a five-channel multielectrode recording system (Thomas Recording) and a multichannel acquisition processor (Plexon). DMFC neurons were located in the supplementary eye field or its immediately surrounding areas (Tehovnik et al., 2000), whereas ACCd neurons were recorded from the dorsal bank of the cingulate sulcus (area 24c). DLPFC neurons were recorded anterior to the frontal eye field, as identified by eye movements evoked by electrical stimulation (Bruce et al., 1985). All the neurons encountered during the recording sessions were tested for the behavioral task described below without any prescreening. All the procedures used in this study were approved by the University of Rochester Committee on Animal Research and the Institutional Animal Care and Use Committee at Yale University, and conformed to the Public Health Service Policy on Humane Care and Use of Laboratory Animals and Guide for the Care and Use of Laboratory Animals.
Behavioral task.
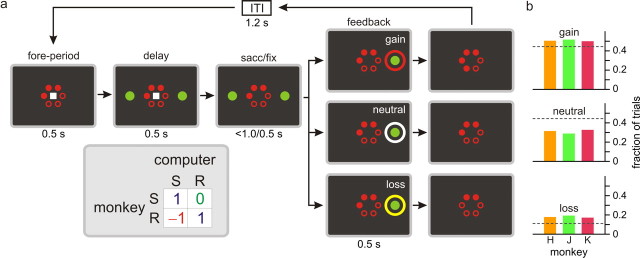
Animals were trained to perform a token-based binary choice task (Fig. 1a). After the animal fixated a central square during a 0.5 s foreperiod, two green peripheral targets were presented on a computer screen along the horizontal meridian. The animal was then required to shift its gaze toward one of the targets when the central square was extinguished at the end of a 0.5 s delay period. In addition, a series of red disks (“tokens”) were displayed throughout the trial in a circular array at the center of the computer screen, and served as conditioned reinforcements, because they were exchanged with six drops of juice reward when the animal accumulated six of them. Once the animal fixated its chosen peripheral target for 0.5 s, a feedback ring appeared around the chosen target and its color indicated whether the number of tokens would increase (gain: red in all monkeys), decrease (loss: gray in monkey H; yellow in J and K), or remain unchanged (neutral: blue in monkey H; white in J and K). At the end of this 0.5 s feedback period, the number of tokens displayed on the screen was adjusted after gain or loss outcomes, and any remaining tokens were displayed continuously during the subsequent intertrial interval. To test whether the activity seemingly related to gains and losses reflected the color selectivity of the neurons, a subset of neurons recorded in two animals (monkeys J and K) were further tested in separate blocks in which the gain, neutral, and loss outcomes were signaled by gray, blue, and orange feedback rings, respectively. After juice delivery, the animal received two to four free tokens at the onset of the next trial.
Figure 1.
Behavioral task. a, Spatiotemporal sequence of the task and payoff matrix used to determine the outcome of the animal's choice. S and R refer to safe and risky targets. b, Frequencies of gain, neutral, and loss outcomes. Dotted lines indicate the outcome probabilities expected for the optimal strategy.
The outcome of the animal's choice in a given trial was determined by the payoff matrix of a biased matching pennies game (Fig. 1a, inset) (Barraclough et al., 2004; Lee et al., 2004). During this game, the computer opponent simulated a rational decision maker who chooses its target so as to minimize the payoff of the animal, and the animal gained a token only when it chose the same target as the computer. When the animal's choice was different from that of the computer, its outcome was different for the two targets. For one target, referred to as “risky” target, the animal lost a token, whereas for the other target, referred to as “safe” target, the outcome was neutral, and the animal neither gained nor lost a token. The positions of the risky and safe targets were fixed in a block of trials, and their positions were changed without any cues with a 0.1 probability each trial after 40 trials. In game theory, a set of strategies from which none of the players can deviate individually to increase his or her payoff is referred to as a Nash equilibrium (Nash, 1950). The particular matching pennies game used in this study has a unique Nash equilibrium which corresponds to the animal and the computer opponent choosing the safe target with 2/3 and 1/3 probabilities, respectively. To show this, it should be noted that, at the equilibrium, the expected value of payoff should be equal for the two alternative targets. Denoting the probability of choosing the safe target for the animal and the computer opponent as p and q, this implies that the expected values of the animal's payoff from the safe and risky targets are q and (−1) q + (1 − q), respectively. Therefore, q = (−1) q + (1 − q), so q = 1/3 at the equilibrium. Similarly, p + (−1) (1 − p) = (1 − p), so p = 2/3, because the expected payoffs from the two targets should be equal for the computer opponent. This implies that when both players make their choices according to the equilibrium strategies, the probabilities that the animal's choice would lead to the gain, neutral, and loss outcomes would be 4/9, 4/9, and 1/9, respectively. This implies that, against the competitive computer opponent, the animal would obtain on average 1/3 token each trial when it chose the risky and safe targets with 1/3 and 2/3 probabilities. If the animal's strategy in a given block deviated significantly from the equilibrium strategy, this was exploited by the computer opponent and would decrease the expected payoff for the animal. For example, if the animal chose the safe target more frequently than with 2/3 probability, the computer opponent always chose the risky target. In game theory, a strategy is referred to as pure when it corresponds to choosing a particular action exclusively, whereas a mixed strategy refers to a case in which multiple actions are chosen stochastically. Therefore, the equilibrium strategy for the biased matching pennies task used in this study was mixed. An important advantage of using a game with a mixed equilibrium strategy is that it reduces the serial correlation between the successive choices of the animal and makes the outcome of each choice stochastic. This makes it possible to estimate the neural activity related to the animal's choice and its outcome in a given trial separately from those in the previous trial (Lee and Seo, 2007).
Analysis of behavioral data.
To test how the animal's choice was affected by the gains and losses of tokens in previous trials, the following logistic regression model was applied (Lee et al., 2004):
 |
where pt(right) and pt(left) refer to the probability of choosing the rightward and leftward targets in trial t, respectively; Ut = [Ct Gt Lt Rt] is a row vector consisting of four separate regressors corresponding to the animal's choice (Ct = 0 and 1 for leftward and rightward choices, respectively), gain outcome (Gt = −1 and 1 for gaining a token from leftward and rightward choices, respectively, and 0 otherwise), loss outcome (Lt = −1 and 1 for losing a token from leftward and rightward choices, respectively, and 0 otherwise), and reward delivery (Rt = −1 and 1 if the animal obtains the sixth token and receives juice reward after choosing leftward and rightward targets, respectively, and 0 otherwise) in trial t; and Abeh is a vector of regression coefficients. A positive (negative) coefficient in this logistic regression model indicates that a particular outcome resulting from the choice of a given target reinforces (punishes) the same behavior. This was evaluated separately for multiple lags of trials. For example, a positive coefficient for gain with a lag of two trials indicates that when the animal's choice in a given trial (trial t) results in the gain of a token, the animal is more likely to choose the same target two trials later (trial t + 2). This model was fit to the animal's behavioral data in each session, and the regression coefficients related to the same variable and trial lag (e.g., Gt − 4) were averaged separately.
Previous behavioral studies in humans and nonhuman primates have demonstrated that decision makers during competitive games might adjust their strategies dynamically according to a reinforcement learning algorithm (Sutton and Barto, 1998; Camerer, 2003; Lee et al., 2004, 2005). To test whether similar learning algorithms can account for the changes in the animal's choice behavior resulting from the gains and losses of tokens, we applied a reinforcement learning model, in which the value function was updated according to the following: Vt + 1(x) = Vt(x) + α{rt − Vt(x)}, where Vt(x) refers to the value function for choosing x in trial t, rt is the outcome in trial t (−1, 0, and 1 for loss, neutral, and gain outcomes, respectively), and α is the learning rate. The value function for the unchosen target was not updated. The probability that the animal would choose the rightward target was given by the logistic (also known as softmax) transformation of the value functions as follows:
 |
where β refers to the inverse temperature that controls the randomness of the animal's choice. The two parameters of this model (α and β) were estimated separately for each session according to a maximum-likelihood procedure (Pawitan, 2001; Seo and Lee, 2007).
To further test whether the neutral outcome was less reinforcing than the gain outcome and whether the loss outcome was more punishing than the neutral outcome, we also estimated the reward values of the neutral and loss outcomes as additional free parameters (rneutral and rloss) in the above reinforcement learning model, whereas the gain was still coded as +1. To avoid over-parametrization, the value of inverse temperature β was estimated and fixed for the entire dataset from each animal using the same reinforcement learning model described above in which the loss, neutral, and gain outcomes were coded as −1, 0, and +1, respectively.
To test whether the introduction of these additional parameters resulted in overfitting, we computed the Bayesian information criterion (BIC) for each model as follows (Burnham and Anderson, 2002): BIC = −2 log L + k log N, where L denotes the likelihood of a given model, k denotes the number of free parameters, and N denotes the number of trials. The second term in this formula penalizes the use of additional parameters, because the model with the smaller BIC is preferred.
Analysis of neural data.
To investigate how neural activity was influenced by the gains and losses of tokens as well as the animal's choices, we focused our analyses on the spike rates during the delay period (0.5 s after target onset) and feedback period (0.5 s after feedback onset). The spike rate yt during each of these intervals in trial t was then analyzed using the following multiple linear regression model:
 |
where Ct is the animal's choice in trial t (Ct = −1 and 1 for leftward and rightward choices, respectively), Gt is a dummy variable for the gain outcome (Gt = 1 for gain trials and 0 otherwise), Lt is a dummy variable for the loss outcome (Lt = 1 for loss trials and 0 otherwise), Rt is a dummy variable for the reward (Rt = 1 for rewarded trials and 0 otherwise), Assett is the number of tokens (0 to 5) possessed by the animal at the beginning of trial t, Riskt is a dummy variable indicating whether the animal chose the risky target or not (Riskt = 1 if the animal selects the risky target in trial t and 0 otherwise), Sacct is a dummy variable indicating the presence (Sacct = 1) or absence (Sacct = 0) of a saccade during the feedback period in trial t, and RTt is the saccadic reaction time in milliseconds relative to feedback onset for trials in which the animal made a saccade during the feedback period (RTt = 0, for the trials without saccades), and finally a0, aA, aR, aS, aRT, AC, AG, AL, and AR are regression coefficients. In addition to the variables related to the animal's choice and its outcome in the current trial t, this model included the corresponding variables from the previous trial t − 1, because it has been previously demonstrated that the neurons in some of the cortical areas tested in this present study often encode the signals related to the animal's choice and its outcome in the previous trial (Barraclough et al., 2004; Seo and Lee, 2007). We also tested whether the neural activity related to the gain and loss outcomes during the feedback period was influenced by the number of tokens owned by the animal. This was accomplished by adding to the above regression model (Eq. 3) the interaction term for gain and asset, Assett × Gt, and the interaction term for loss and asset, Assett × Lt.
Previous studies have found that reward-related activity of the neurons in the frontal cortex, such as the dorsolateral prefrontal cortex (Barraclough et al., 2004) and supplementary eye field (Uchida et al., 2007), might be influenced by the direction of the animal's eye movement. Such signals related to the conjunction of choice and outcome can be used to update the value function for a particular action (Seo et al., 2007; Seo and Lee, 2008). Therefore, to test whether the neural activity is influenced by specific conjunctions of the animal's choices and its outcomes, a set of interaction terms were added to the above regression model as follows:
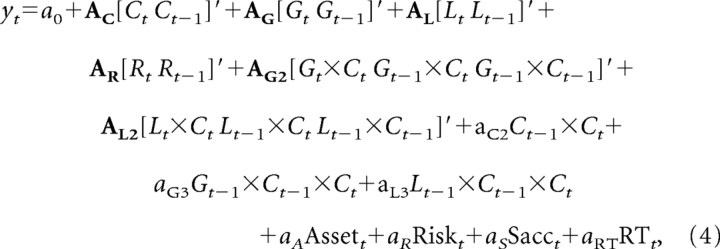 |
where aC2, AG2, and AL2 are the regression coefficients for the two-way interactions, and aG3 and aL3 are the regression coefficients for the three-way interactions that involve the gain or loss outcome in trial t − 1 as well as the animal's choices in trials t − 1 and t. It should be noted that, for the dummy variables used in the three-way interactions, their main effects and two-way interactions were also included in this model. Therefore, the regression coefficients for the three-way interactions estimated the conjunctive effects of three variables that were not accounted for by their main effects or two-way interactions (Aiken and West, 1991).
In the reinforcement learning model described above (Eq. 2), the probability of choosing a particular target is determined by the difference in the value functions for the two alternative targets. This suggests that neural activity related to the difference in the value functions, namely, Vt(right) − Vt(left), might influence the animal's choice. To investigate whether and how individual neurons contribute to the animal's upcoming choice according to the difference in the value functions, the following regression model was applied to the activity during the delay period.
 |
where Vt(x) is the value function for target x in trial t, and a0, aC, aA, aD, and aS are the regression coefficients. We included the animal's choice, the asset, and the sum of the value functions in this model to control for any changes in neural activity that might be related to these additional variables (Seo and Lee, 2008). The value functions of successive trials are correlated, because they are updated iteratively, and this violates the independence assumption in the regression model. Therefore, the statistical significance for the regression coefficients in this model was determined by a permutation test (Seo and Lee, 2008). For this, we shuffled the trials separately for the blocks in which the left target was the safe target and those in which the right target was the safe target. We then estimated the value functions from these shuffled trials using the same parameters of the reinforcement learning model obtained for the unshuffled trials. This shuffling procedure was repeated 1000 times, and the p value for a given independent variable was determined by the fraction of the shuffles in which the magnitude of the regression coefficient from the shuffled trials exceeded that of the original regression coefficient.
Results
Effects of tokens on choices
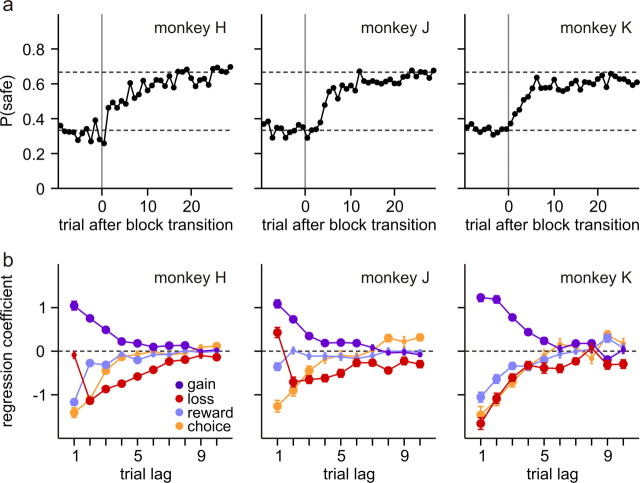
Given that the computer opponent simulated a rational player in a zero-sum game, the optimal strategy for the animal during the token-based binary choice used in the present study was to choose the safe and risky target with 2/3 and 1/3 probabilities, respectively. Indeed, the probability that the animal would choose the safe or risky target approached the value predicted for the optimal strategy of the game within ∼10 trials after the blocks switched (Fig. 2a). Nevertheless, the animal tended to choose the risky target significantly more frequently than predicted for the optimal strategy. Overall, the average fraction of trials in which the animal chose the risky target was 0.399, 0.403, 0.382 for monkeys H, J, and K, respectively, and this was significantly larger than 1/3 in all animals (t test, p < 0.001). The outcome of the animal's choice was a loss in 18.2% of the trials (Fig. 1b), which was also significantly higher than the value expected for the optimal strategy (1/9). The overall percentages of trials in which the animal's choice resulted in the neutral and gain outcomes were 31.1 and 50.8%, respectively (Fig. 1b).
Figure 2.
Behavioral performance in a token-based binary choice task. a, Changes in the animal's choice probability after block transitions. P(safe) refers to the probability that the animal would choose the safe target in the new block (the risky target in the previous block). The dotted lines indicate the choice probabilities for safe (2/3) and risky (1/3) targets that correspond to the Nash equilibrium. b, Average regression coefficients associated with gains, losses, choices, and juice rewards in 10 previous trials. The large circles indicate that they are significantly different from 0 (t test, p < 0.05). Error bars indicate SEM.
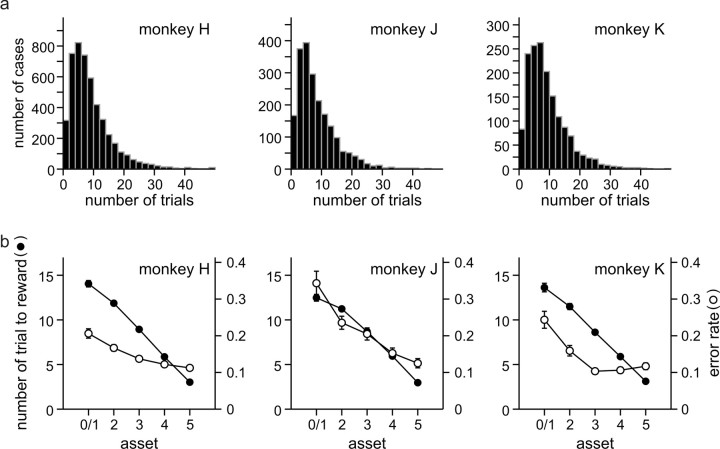
Because the animal was rewarded with juice only when it accumulated six tokens and the outcomes in individual trials were probabilistic, the number of trials between the two successive juice deliveries varied substantially (Fig. 3a). Averaged across all animals, the number of trials between the two successive juice deliveries was 9.5. As expected, the average number of trials before the next juice delivery decreased monotonically with the number of tokens (or assets) (Fig. 3b). Similarly, the frequency of error trials in which the animal broke their fixations prematurely decreased with the number of tokens possessed by the animal, presumably reflecting an increased level of motivation (Fig. 3b).
Figure 3.
Frequency of rewards. a, Frequency histograms for the number of trials between two successive reward delivery periods. b, Average number of trials necessary to acquire juice rewards (filled symbols) and error rates (empty circles) plotted as a function of the number of tokens (assets) possessed by the animal. Error bars (SEM) are often smaller than the symbols.
To test how the animal's choice was influenced by the outcomes of its previous choices, we applied a logistic regression model to the behavioral data (Eq. 1). The results showed that, in all three animals, the gain of a token from a particular choice increased the likelihood that the animal would choose the same target in the next trial, and this reinforcing effect decayed gradually over several trials (Fig. 2b; gain, blue). In contrast, the loss of a token from a particular choice decreased the likelihood that the same target would be chosen in subsequent trials (Fig. 2b; loss, red). The immediate effect of a token loss on the choice in the next trial varied across different animals, and this might be attributable to the fact that a strict “lose-switch” strategy could be exploited by the computer opponent and therefore was suboptimal. In addition, there was a significant tendency for the animals to avoid repeating the same choices in successive trials, as reflected in the negative coefficients associated with the animal's previous choices (Fig. 2b; choice, orange). Compared with the gains and losses of tokens, primary reinforcers had weaker effects on the animal's choice behavior and tended to counteract the reinforcing effects of tokens (Fig. 2b; reward, light blue).
In the logistic regression analysis, the effect of gaining or losing a conditioned reinforcer is modeled separately for each trial lag. Nevertheless, their weights decreased gradually with the number of intervening trials, suggesting that it might be more parsimonious to model the reinforcing and punishing effect of gains and losses, respectively, using a reinforcement learning model (Eq. 2). Indeed, according to the BIC, a simple reinforcement learning model performed better than the logistic regression model in almost all sessions (152 of 154 sessions) (Table 1). We also calculated the BIC for the logistic regression model after excluding the variables related to the previous choices and rewards. This reduced logistic regression model still performed more poorly than the reinforcement learning model, except for one session (Table 1).
Table 1.
Summary of model comparisons
| Models | Monkey |
||
|---|---|---|---|
| H | J | K | |
| Regression | 864.0 (2) | 794.7 (0) | 693.1 (0) |
| Regression − CR | 795.7 (1) | 710.7 (0) | 620.8 (0) |
| RL | 730.9 | 643.4 | 554.7 |
| RL + rneutral + rloss | 733.9 (11) | 646.9 (5) | 558.0 (4) |
| N sessions | 82 | 37 | 35 |
| N trials/session | 574.7 | 509.7 | 457.2 |
Average values of BIC for different models used to analyze the choice behavior of each animal. The numbers in the parentheses indicate the number of sessions in which the corresponding model performed better than the simple reinforcement learning model (RL). Regression refers to the logistic regression model, whereas Regression − CR refers to the model without the terms related to choice and reward.
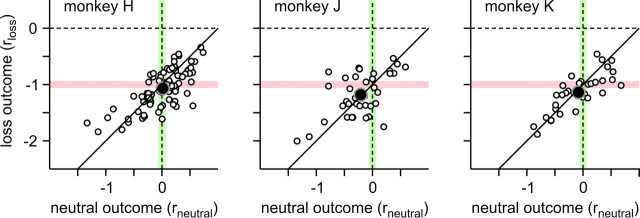
In the above reinforcement learning model, the loss, neutral, and gain outcomes were respectively coded as −1, 0, and 1, respectively. To test directly whether the neutral outcome was less reinforcing than the gain outcome and whether the loss outcome was more punishing than the neutral outcome, we tested a modified reinforcement learning model in which the loss and neutral outcomes were coded by two separate free parameters (rloss and rneutral). This analysis showed that the influence of the loss outcome on the animal's choices was approximately equal and opposite to that of the gain outcome, whereas the effect of the neutral outcome was intermediate compared with the effects of gain and loss outcomes. First, the average value of the parameter rloss was −1.07, −1.18, and −1.14 for monkeys H, J, and K, and therefore relatively close to −1, although for monkeys J and K, this was significantly more negative than −1 (t test, p < 0.05) (Fig. 4). Second, the average value of the parameter rneutral was significantly smaller than +1, and this was true for all animals (t test, p < 10−28) (Fig. 4). Third, the average value of rneutral was 0.01, −0.21, and −0.08 for monkeys H, J, and K, respectively, and therefore relatively close to 0 (Fig. 4). The null hypothesis that rneutral = 0 was rejected only for monkey J (p < 0.05). Finally, the average value of the parameter rneutral was significantly more positive than the average value of rloss, which was again true for all animals (t test, p < 10−16) (Fig. 4). Because the estimated values of loss and neutral outcomes were not substantially different from those used in the original reinforcement learning model, their use as free parameters might have resulted in the overfitting. Indeed, the BIC for this new reinforcement learning model was larger than the original reinforcement learning model in the majority of sessions (134 of 154 sessions) (Table 1). Therefore, it is parsimonious to assume that the effects of loss and gain outcomes are equal and opposite with the neutral outcomes having intermediate effects.
Figure 4.
Reward values for the loss (rloss) and neutral (rneutral) outcomes estimated as free parameters in a reinforcement learning model. The pink and green lines correspond to the default values used for the loss (−1) and neutral (0) outcomes in the original reinforcement learning model. The solid black line corresponds to rloss = rneutral − 1. The empty circles correspond to the values obtained for individual sessions, whereas the large filled symbols correspond to their means for individual animals.
Neural activity related to gains and losses
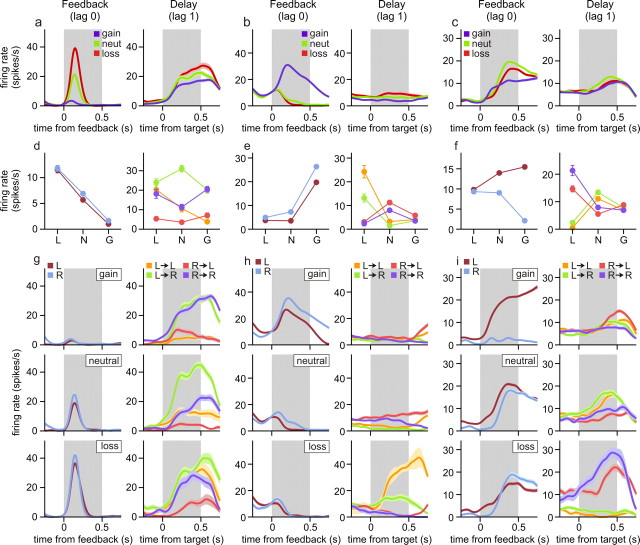
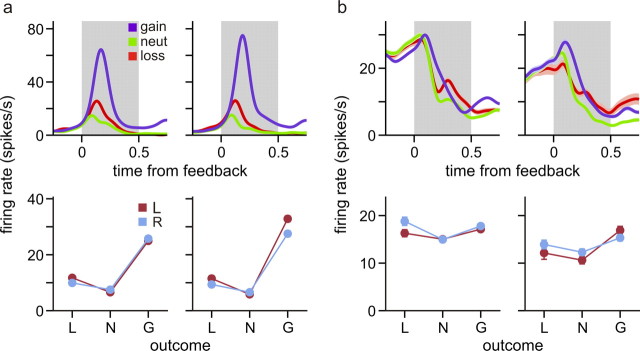
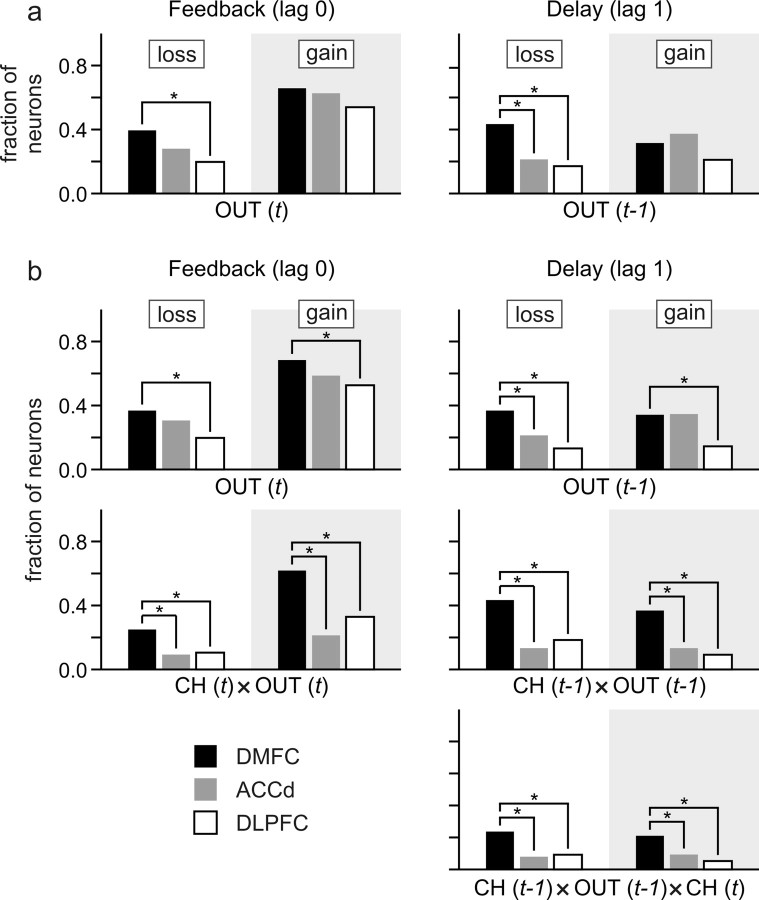
Single-neuron activity was recorded from the DMFC (76 neurons), the ACCd (75 neurons), and the DLPFC (76 neurons) (Fig. 5). During the 0.5 s time window immediately after feedback onset, many neurons in these three cortical areas changed their activity significantly when the animal acquired or lost a token in the same trial, compared with when the outcome of their choice was neutral. For example, two of the three DMFC neurons illustrated in Figure 6, a and b, changed their activity significantly during the feedback period according to the outcome of the animal's choice in the same trial. The neuron illustrated in Figure 6a significantly increased and decreased its activity during the feedback period of loss and gain trials, respectively, compared with the activity in the trials with neutral outcomes. In contrast, the neuron in Figure 6b increased its activity during the feedback period of gain trials compared with the activity in neutral trials, whereas it showed a modest but statistically significant decrease in its activity in loss trials (t test, p < 0.005). Neurons in the ACCd and DLPFC also commonly changed their activity during the feedback period according to the outcome of the animal's choice. For example, the ACCd neuron shown in Figure 7a significantly increased its activity during the feedback period of gain trials compared with the activity in neutral trials (Fig. 7a, top left). Similarly, the DLPFC neuron shown in Figure 7b significantly increased its activity during the feedback period of gain and loss trials compared with the activity in neutral trials (Fig. 7b, top left). Overall, the percentage of neurons showing significant activity changes during the feedback period in gain trials relative to the activity in neutral trials was 65.8, 62.7, and 54.0% for the DMFC, ACCd, and DLPFC, respectively, whereas the corresponding percentages for the loss trials was 39.5, 28.0, and 19.7% (Fig. 8a, left). To test whether the activity during the feedback period seemingly related to gains and losses resulted from the color selectivity of the neurons, a subset of neurons in each cortical area were tested with a different set of colors for the feedback rings. The results from this control experiment showed that the neural activity related to gains and losses were relatively unaffected by the colors of the feedback rings (Fig. 7; supplemental Fig. 1, available at www.jneurosci.org as supplemental material).
Figure 5.
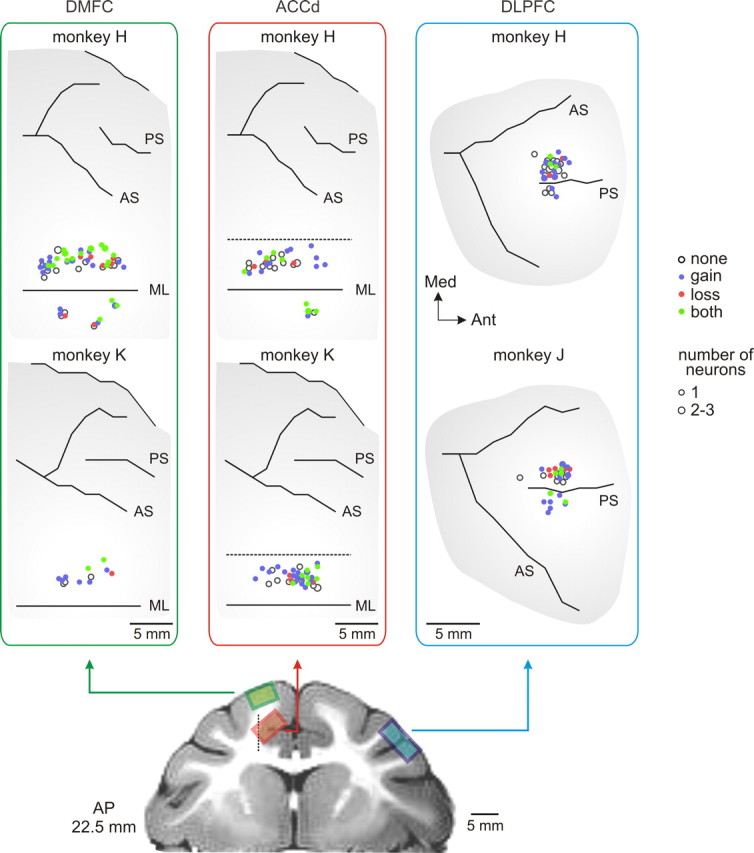
Anatomical distributions of the neurons in the DMFC, ACCd, and DLPFC. Neurons that showed significant effects for gain and/or loss are indicated in different colors. AS, Arcuate sulcus; ML, midline; PS, principal sulcus.
Figure 6.
Neural activity related to gains and losses in the DMFC. a–c, Spike density functions (SDFs) of three DMFC neurons during the feedback period (gray background, left) or delay period (gray background, right) in trial t sorted by the outcome of the current trial (t, left) or previous trial (t − 1, right). d–f, Left, Average spike rates during the feedback period of trial t sorted by the animal's choice and its outcome in the same trial (L, loss; N, neutral; G, gain). Right, Average spike rates during the delay period of trial t sorted by the animal's choice in the same trial in addition to the choice and its outcome in the previous trial (t − 1). The animal's choices in two successive trials are color coded. For example, the orange line indicates that the animal chose the leftward target in both trials (L→L). g–i, SDFs aligned to feedback onset (left) or target onset (right) sorted as in d–f. Error bars in d–f indicate SEM; the shaded areas in the SDF plots indicate mean ± SEM.
Figure 7.
Activity of example neurons in the ACCd (a) and DLPFC (b). Top, Spike density function aligned to feedback onset sorted by the outcome of the animal's choice. The shaded areas indicate mean ± SEM. Bottom, Average spike rates during the feedback period sorted by the animal's choice and its outcome in the same trials (L, loss; N, neutral; G, gain). The left and right columns in each panel correspond to the activity during the trials tested with two different sets of feedback ring colors. Error bars indicate SEM.
Figure 8.
Population summary of neural activity related to gains and losses during feedback (left) and delay (right) periods. a, Fraction of neurons showing significant effects of gains and losses, estimated with a regression model without interaction terms. b, Fraction of neurons showing significant effects of gains and losses estimated along with their interactions with the animal's choices. CH(t) refers to the animal's choice in trial t, and OUT(t) the gain or loss outcome in trial t. *p < 0.05, χ2 test.
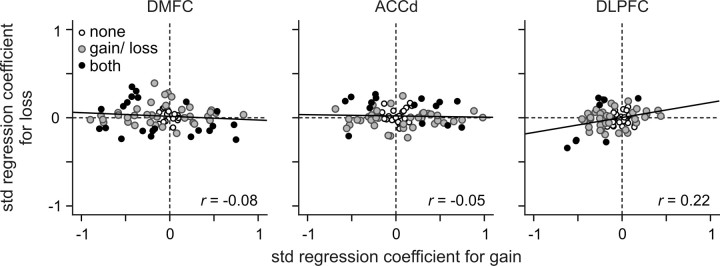
Whether the activity of individual neurons increased or decreased during the feedback period of gain and loss trials compared with the activity in neutral trials varied across neurons in each cortical area. In addition, whether the activity of a given neuron increased or decreased during the feedback period of gain trials compared with the activity in neutral trials was not systematically related to the activity related to the loss outcome. For example, compared with the activity in neutral trials, some neurons changed their activity during the feedback period oppositely for gain and loss outcomes (Fig. 6a,b). In contrast, some neurons changed their activity in response to either gains or losses compared with their activity in neutral trials (Fig. 7a), whereas others changed their activity similarly to both gains and losses (Fig. 7b). Accordingly, the regression coefficients related to gains were not significantly correlated with those related to losses in any of the cortical areas tested in this study (Fig. 9). Similarly, within each cortical area, whether a given neuron increased or decreased its activity significantly in gain and loss trials was not systematically related (χ2 test, p > 0.2) (Table 2).
Figure 9.
Population summary of activity related to gains and losses in different cortical areas. Standardized regression coefficients associated with gain outcomes are plotted against those associated with loss outcomes. The black symbols indicate the neurons that showed significant effects for both gain and loss, whereas the gray symbols indicate the neurons that showed significant effects for either gain or loss. The values within each plot show Spearman's rank correlation coefficient (r), and the solid line is the best-fitting regression line. The correlation was not significant for any of the cortical areas (p > 0.05).
Table 2.
Contingency tables for the number of neurons that displayed significant modulations in their activity related to gains and losses during the feedback period
| Gain − | Gain + | No gain | All | |
|---|---|---|---|---|
| DMFC (χ2 = 5.062, p = 0.2810) | ||||
| Loss − | 7 | 6 | 2 | 15 |
| Loss + | 7 | 2 | 6 | 15 |
| No loss | 16 | 12 | 18 | 46 |
| All | 30 | 20 | 26 | 76 |
| ACCd (χ2 = 4.5890, p = 0.3321) | ||||
| Loss − | 1 | 3 | 4 | 8 |
| Loss + | 6 | 5 | 2 | 13 |
| No loss | 14 | 18 | 22 | 54 |
| All | 21 | 26 | 28 | 75 |
| DLPFC (χ2 = 1.4254, p = 0.8398) | ||||
| Loss − | 4 | 0 | 4 | 8 |
| Loss + | 3 | 1 | 3 | 7 |
| No loss | 24 | 9 | 28 | 61 |
| All | 31 | 10 | 35 | 76 |
Gain −/+ (Loss −/+), The number of neurons significantly decreasing/increasing their activity in gain (loss) trials (t test, p < 0.05). No gain (loss), The number of neurons without significant effect of gain (loss).
We also found that the gain or loss of a token in a given trial influenced the activity of many neurons during the delay period of the next trial. For example, the DMFC neuron shown in Figure 6a increased its activity significantly during the delay period when the outcome in the previous trial was a loss compared with when the previous outcome was neutral. Overall, during the delay period, 31.6, 37.3, and 21.1% of the neurons in the DMFC, ACCd, and DLPFC, displayed significant modulations in their activity related to the gain of a token in the previous trial, whereas the corresponding percentages for the loss outcome in the previous trial were 43.4, 21.3, and 17.1%, respectively (Fig. 8a, right). Therefore, signals related to the gains and losses in a given trial were reflected in the activity of neurons in the frontal cortex during the delay period of the next trial.
Conjunctive coding of choices and outcomes
A particular outcome influences the animal's subsequent behaviors differently depending on the action responsible for that outcome. For example, the gain of a token after choosing the leftward and rightward target tends to increase and decrease, respectively, the probability of choosing the leftward target in subsequent trials (Fig. 2b). This suggests that neurons involved in updating the animal's decision-making strategy might encode the animal's previous choice and its resulting gain or loss conjunctively. Indeed, during the feedback period, activity of neurons in the DMFC often encoded the animal's choice in the same trial and its outcome conjunctively, whereas during the delay period, neural activity tended to reflect the conjunction of the animal's choice in the previous trial and its outcome. In addition, neurons encoded specific conjunctions of the animal's choice and its outcomes more frequently in the DMFC than in the DLPFC or ACCd (Fig. 8b), indicating that DMFC might play a key role in adaptively adjusting the animal's choice behaviors based on the gains and losses of conditioned reinforcers.
An example neuron in DMFC showing such conjunctive coding is illustrated in Figure 6c. The activity of this neuron during the feedback period of loss, neutral, and gain trials changed differently depending on the animal's choice in the same trial (Fig. 6f,i, left). In particular, when the animal chose the leftward target (Fig. 6f, purple), the activity of this neuron was higher during the feedback period of gain trials than in neutral or loss trials. In contrast, when the animal chose the rightward target (Fig. 6f, blue), the activity of the same neuron in the loss trials was higher than that in the gain or neutral trials. The results from the regression analysis with interaction terms (Eq. 4) confirmed that for the activity of this neuron during the feedback period, two-way interaction was significant both for the animal's choice and loss outcome and for the animal's choice and gain outcome in the same trial (t test, p < 0.0001). During the feedback period, 61.8 and 25.0% of the neurons in the DMFC showed significant interactions between the animal's choice and gain and between the choice and loss, respectively.
Similar to the activity during the feedback period, more than one-third of the neurons in the DMFC displayed significant interaction for the animal's choice in the previous trial and its outcome during the delay period (36.8 and 43.4% for gains and losses, respectively). Significant two-way interactions for choice and gain in the previous trial were found during the delay period for all three neurons shown in Figure 6, a–c, right, and two of these neurons also showed significant two-way interactions for choice and loss (Fig. 6b,c, right). Therefore, signals related to the conjunctions of the animal's choice and its outcome were still available in the DMFC, when the animal was ready to make its choice in the next trial (Fig. 8b, middle, choice × out). Compared with the neurons in the DMFC, the proportion of the neurons showing such conjunctive activity related to the animal's choice and its outcome in the previous trial was significantly lower in the ACCd and DLPFC (χ2 test, p < 0.05). For the ACCd, the percentages of neurons showing significant interactions for the animal's previous choice and gain outcome and for the previous choice and loss outcome was both 13.3%. For the DLPFC, these corresponding percentages were 9.2 and 18.4%, respectively.
Neurons mediating the effects of gains and losses on the animal's behavior must change their activity related to the animal's upcoming choice differently depending on the animal's previous choice and its outcome. For example, the neuron illustrated in Figure 6a showed a robust change in its activity during the delay period related to the animal's upcoming choice, but this differential activity was greatly reduced when the animal's leftward choice in the previous trial resulted in a loss (Fig. 6d,g, right; orange and green lines). For the neuron illustrated in Figure 6b, its activity reflected the animal's upcoming choice most robustly after the outcome of the leftward choice in the previous trial was a loss (Fig. 6e,h, right; orange and green lines). For both of these neurons, the activity during the delay period showed a significant three-way interaction between the animal's choice in the previous trial, the loss resulting from that choice, and the animal's choice in the current trial (t test, p < 0.05). The percentage of neurons in the DMFC with such significant three-way interactions was 21.1 and 23.7% for gains and losses (Fig. 8b, bottom), respectively, suggesting that some DMFC neurons encoded the animal's upcoming choice differently depending on its previous choice and outcome. As in the two-way interaction for the animal's choice and its outcome, the three-way interaction for the animal's choices in two successive trials and the previous outcome was observed more frequently in the DMFC than in the DLPFC or ACCd (Fig. 8b, bottom).
Coding of value functions
In the reinforcement learning models used to analyze the animal's choice behavior, the probability of choosing a particular target was a function of the difference in the value functions for the two alternative targets (Eq. 2). Therefore, neurons encoding the difference in the value functions might be involved in the selection of a particular target. Indeed, many neurons in the DMFC modulated their activity during the delay according to the difference in the value functions. For example, the activity of the neuron illustrated in Figure 6b increased its activity during the delay period as the value function for the rightward target increased relative to that for the leftward target (Fig. 10a). This was true regardless of whether the animal chose the leftward or rightward target. In contrast, the neuron shown in Figure 6c increased its activity as the value function for the leftward target increased relative to that for the rightward target (Fig. 10b). Similarly, some neurons in the ACCd changed their activity according to the difference in the value functions for the two targets (Fig. 10c). To evaluate the activity related to the value functions statistically, we applied a regression model that included the difference in the value functions as an independent variable in addition to the animal's choice, asset, and the sum of the value functions (Eq. 5). The results showed that 47.4, 22.7, and 7.9% of the neurons in the DMFC, ACCd, and DLPFC, respectively, modulated their activity significantly according to the difference in the value functions (permutation test, p < 0.05) (Fig. 11a). Whereas these percentages were significantly higher than the 5% significance level (binomial test, p < 0.05) for the DMFC and ACCd, this was not the case for the DLPFC.
Figure 10.
Example neurons in the DMFC (a, b) and ACCd (c) modulating their activity according to the difference in the value functions for the two targets. The empty and filled circles represent the average spike rates during the delay period of the trials in which the animal chose the leftward and rightward targets, respectively. Each symbol corresponds to a decile of trials sorted by the difference in the value functions. Error bars indicate SEM. The light and dark histograms show the distribution of the difference in the value functions for the trials in which the animal chose the leftward and rightward targets, respectively.
Figure 11.
Population summary for neural activity related to value functions. a, Fraction of neurons that significantly modulated their activity during the delay period according to the difference in the value functions. This is shown for all neurons in each cortical area (gray) and separately for a subset of neurons that showed (or did not show) significant interaction effects for the animal's choice in the previous trial and its outcome (gain or loss). b, Fraction of neurons in the DMFC that changed their activity significantly according to the difference in the value functions when the animal's choice in the previous trial led to the loss, neutral, or gain outcome. As in a, this was computed separately according to whether the neurons showed significant interaction between the animal's choice in the previous trial and its outcome (gain or loss). *χ2 test, p < 0.05.
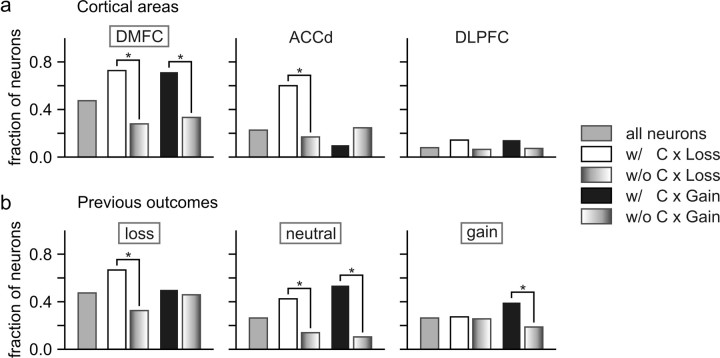
We hypothesized that the neurons encoding the conjunction of a particular choice and its outcome would signal the difference in the value functions. To test this, we compared the percentage of neurons that significantly changed their activity according to the difference in the value functions, separately for the neurons showing significant interaction effects for the animal's choice in the previous trial and gain outcome and the neurons without such interaction effects (Eq. 4). The same analysis was repeated separately for the loss outcome. The results mostly confirmed the hypothesis, especially for the DMFC. For example, among the DMFC neurons that showed significant interactions between the animal's choice and loss outcome, 72.7% of them modulated their activity significantly according to the difference in the value functions, whereas this percentage was reduced to 27.9% for the neurons that did not have such conjunctive coding (Fig. 11a). Neurons in the ACCd were also more likely to change their activity according to the difference in the value functions, when they showed significant conjunctive coding for choice and loss outcome compared with when they did not (Fig. 11a). Similarly, the neurons in the DMFC were more likely to encode the difference in the value functions when they showed significant conjunctive coding for choice and gain outcome (Fig. 11a). However, this was not true for the ACCd. The fact that the percentage of neurons encoding the difference in the value functions was affected consistently by the interactions between choice and outcome only for the DMFC is not surprising, because the overall percentage of neurons encoding the difference of value functions (Fig. 11a) or interactions between the animal's choice and outcome (Fig. 8b, middle) was relatively low for ACCd and DLPFC.
Conjunctive coding of the animal's choice and loss outcome, namely, the interaction between these two variables, was evaluated by comparing the activity during the delay period after the trials with loss and neutral outcomes. Therefore, for the neurons in the DMFC, we hypothesized that the neurons with such conjunctive coding might be more likely to encode the difference in the value functions when the outcome of the animal's choice in the previous trial was loss or neutral, compared with the previous outcome was gain. Similarly, because conjunctive coding of choice and gain outcome was evaluated by examining the activity related to the gain and neutral outcomes in the previous trials, we predicted that the DMFC neurons showing significant conjunction for choice and gain outcome in the previous trial would be more likely to encode the difference in the value functions when the previous outcome was gain or neutral compared with when the previous outcome was loss. To test these predictions, we computed the percentage of neurons that showed changes in their activity related to the difference in the value functions separately according to the outcome of the animal's choice in the previous trial. The results from this analysis mostly confirmed the predictions (Fig. 11b). For example, DMFC neurons that showed conjunctive coding of choice and loss outcome encoded the difference in the value functions more frequently than the neurons without such significant interactions, when the outcome in the previous trial was loss or neutral, but not when the previous outcome was gain. Similarly, DMFC neurons with significant conjunctive coding of choice and gain outcome changed their activity according to the difference in the value functions more frequently when the previous outcome was gain or neutral (Fig. 11b).
Neural activity related to assets and reward
The performance of the animals improved with the number of tokens owned by the animal, suggesting that the animal's motivation was systematically influenced by the number of tokens (Fig. 3b). Many neurons examined in this study also modulated their activity during the delay period according to the number of tokens. Neurons with such significant asset-related activity were found in all three cortical areas tested in this study, although they were more common in the DMFC (64.5%) and ACCd (57.3%) than in the DLPFC (23.7%). For example, ACCd neuron illustrated in Figure 12a increased its activity during the delay period gradually as the number of tokens increased, whereas the DMFC neuron in Figure 12b decreased its activity as the number of tokens increased. The estimates of this asset-related activity was relatively unaffected when a separate regressor was included to factor out the activity changes that might occur when the animal owned five tokens and therefore might have expected immediate reward. The regression coefficient for this new dummy variable was significant in 51.3, 45.3, and 11.0% of the neurons in the DMFC, ACCd, and DLPFC, respectively. Nevertheless, the percentage of neurons with significant asset-related activity in each of these areas was 44.7, 45.3, and 21.1%, with the addition of this dummy variable, and therefore relatively unaffected. This indicates that many neurons in the frontal cortex changed their activity gradually with the number of tokens.
Figure 12.
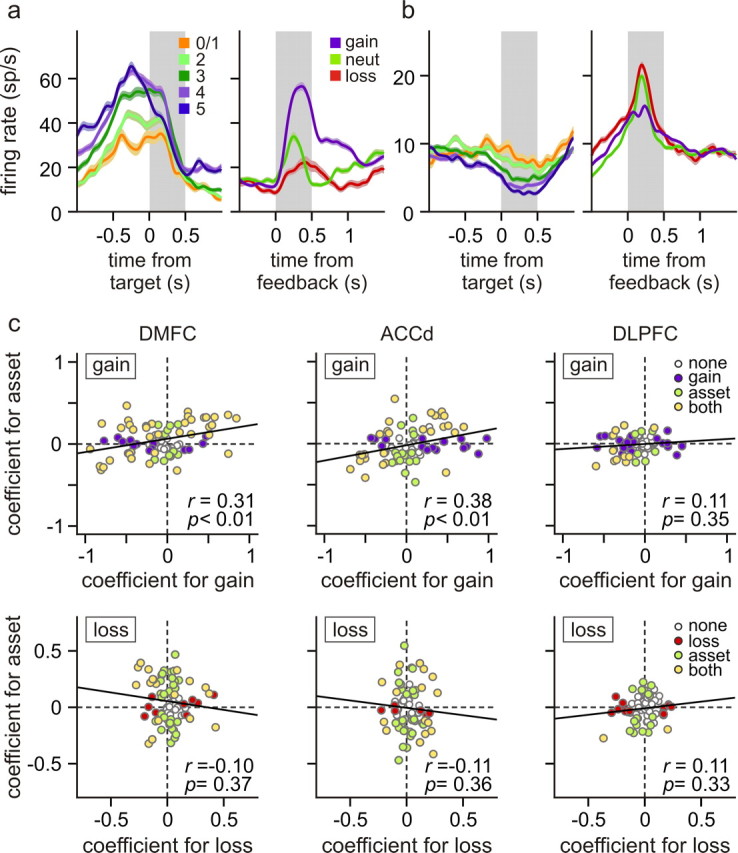
Example neurons in the ACCd (a) and DMFC (b) that significantly increase and decrease their activity with the number of tokens (assets) owned by the animal, respectively. The left panels show the activity aligned at the time of target onset separately for different levels of assets, whereas the right panels show the activity during the feedback period sorted by the outcomes. c, Standardized regression coefficients related to assets for activity during the delay period (gray background in the left panels in a and b) are plotted against the standardized regression coefficients related to the gains (top) and losses (bottom) for activity during the feedback period (gray background in the right panels in a and b). Neurons in which the effects of assets and outcome were statistically significant are indicated by different colors. The values within each plot show Spearman's rank correlation coefficient (r), and the solid line is the best-fitting regression line.
This asset-related activity was evaluated, using a multiple linear regression analysis that controlled for the effect of gains and losses in the previous trial (Eq. 3). Nevertheless, for the neurons in the DMFC and ACCd, there was a significant positive correlation between the asset-related activity during the delay period and the gain-related activity during the feedback period (Fig. 12c). This suggests that the signals related to the number of tokens might be conveyed, in a consistent manner, by the same population of neurons that initially registered the positive outcomes of the animal's actions. In contrast, the asset-related signals during the delay period were not significantly correlated with the loss-related activity during the feedback period in any of the cortical areas tested in the present study (Fig. 12c).
Conjunctive coding of assets and outcomes
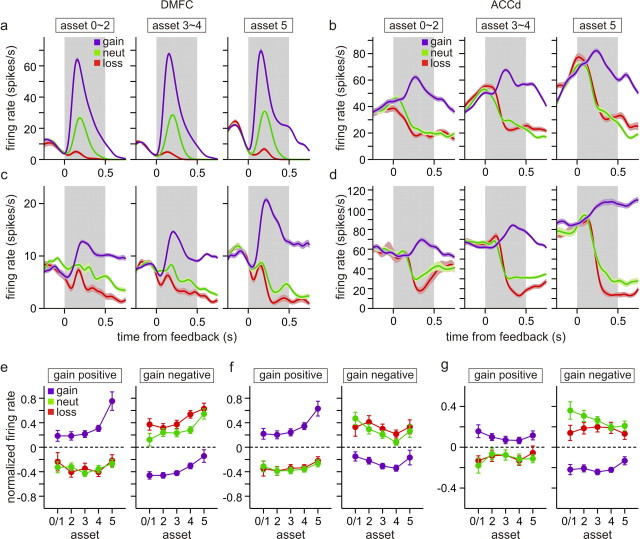
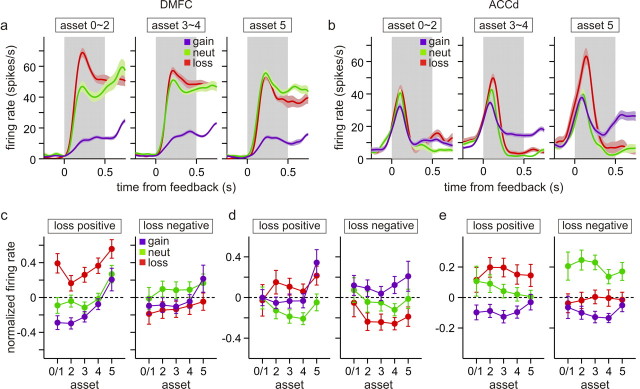
For the majority of the neurons recorded in this study, the sign and magnitude of activity related to gain and loss outcomes did not change with the assets significantly. For example, for the DMFC neuron shown in Figure 13a, its activity related to the gain, neutral, and loss outcomes was mostly unaffected by the assets during the feedback period. Similarly, although the activity of the ACCd neuron shown in Figure 13b gradually increased its activity during the feedback period according to the assets, the difference in the activity among the gain, neutral, and loss trials did not change significantly. In contrast, some neurons in each of the cortical areas tested in this study changed the magnitude of the outcome-related activity according to the assets. For example, for the DMFC neuron shown in Figure 13c and the ACCd neuron in Figure 13d, the difference in their activity during the feedback period of gain and neutral trials increased with the number of tokens. For the DMFC neuron shown in Figure 14a, the difference in its activity during the feedback period of loss and neutral trials gradually decreased with the number of tokens, whereas for the ACCd neuron shown in Figure 14b, this difference increased with the number of tokens. The statistical significance of such asset-dependent changes in outcome-related activity was evaluated by including the interaction terms for assets and outcomes in a regression model (see Materials and Methods). Overall, among the neurons that showed significant difference in their activity during the gain and neutral trials, the percentages of neurons that showed significant asset by gain interaction were 38.0, 42.6, and 22.0% for the DMPFC, ACCd, and DLPFC, respectively (Table 3). The corresponding percentages for asset by loss interaction were 36.7, 19.1, and 46.7% (Table 3).
Figure 13.
Effects of assets on gain-related activity. a, b, Two example neurons (a, DMFC; b, ACCd) that did not change their gain-related activity with assets. The plots show spike density functions for each neuron during the feedback period (gray background) averaged separately according to the animal's choice outcome and the number of tokens (assets). c, d, Two example neurons (c, DMFC; d, ACCd) that significantly changed their gain-related activity with assets. The shaded areas indicate mean ± SEM. e–g, Normalized activity averaged across the neurons that increased (gain positive) or decreased (gain negative) their activity during the feedback period of gain trials relative to the activity in the neutral trials in each cortical area. For each neuron, the activity during the feedback period of individual trials was converted to z-scores, before they were averaged across neurons. Error bars indicate SEM.
Figure 14.
Effects of assets on loss-related activity. a, b, Two example neurons (a, DMFC; b, ACCd) that significantly changed their loss-related activity with assets. The format is the same as in Figure 13a. c–e, Normalized activity averaged across the neurons that increased (loss positive) or decreased (loss negative) their activity during the feedback period of loss trials relative to the activity in the neutral trials in each cortical area. The format is the same as in Figure 13e.
Table 3.
Percentages and number of neurons showing significant interactions for asset and outcome
| Asset by gain |
Asset by loss |
|||
|---|---|---|---|---|
| Gain | No gain | Loss | No loss | |
| DMFC | 38.0 (19/50) | 42.3 (11/26) | 36.7 (11/30) | 17.4 (8/46) |
| ACCd | 42.6 (20/47) | 28.6 (8/28) | 19.1 (4/21) | 22.2 (12/54) |
| DLPFC | 22.0 (9/41) | 17.1 (6/35) | 46.7 (7/15) | 4.9 (3/61) |
Denominators inside the parentheses in the columns labeled Gain (No gain) and Loss (No loss) indicate the number of neurons with (without) significant gain and loss effects, respectively, whereas the numerators indicate the number of neurons with significant asset by gain or asset by loss interactions.
To investigate further whether there was a significant tendency for the magnitude of activity changes related to gain outcomes to increase or decrease with the assets, we analyzed the standardized regression coefficients associated with the interaction term for assets and gain against the standardized regression coefficients for the gain outcome estimated from the regression model without the interaction terms (Eq. 3). These two coefficients would be positively correlated if the magnitude of gain-related activity increased with the assets. For example, these two coefficients would have the same signs for a neuron that increases the difference in its activity for gain and neutral trials as the number of tokens increases. In contrast, the signs of these two coefficients would be opposite if the magnitude of activity associated with gain outcomes decreases with assets. We also analyzed how the loss-related activity changes with assets.
For the DMFC and ACCd, we found that the coefficients related to the interaction term for gain and assets did not show any significant correlation with the coefficients for the gain outcome (supplemental Fig. 2, available at www.jneurosci.org as supplemental material). Spearman's correlation coefficient between these two variables was 0.108 (p = 0.364) and 0.077 (p = 0.532) for the DMFC and ACCd, respectively. Therefore, although there were a substantial number of neurons that significantly changed their gain-related activity according to the number of tokens, there was no consistent bias for gain-related activity to weaken or strengthen with the assets at the population level in the DMFC or ACCd. Accordingly, for these two cortical areas, difference in normalized activity between the gain and neutral trials did not change substantially, when averaged separately according to whether the neurons increased or decreased their activity during the gain trials relative to their activity in the neutral trials (Fig. 13e,f). Interestingly, for the DLPFC, the coefficients associated with asset by gain interaction were significantly and negatively correlated with those related with the gain outcome (Spearman's r = −0.372; p = 0.046). This was mostly attributable to the fact that all six neurons significantly decreasing their activity during gain trials compared with their activity during neutral trials showed significantly negative coefficients for asset by gain interactions (supplemental Fig. 2c, available at www.jneurosci.org as supplemental material). Consistent with this finding, the difference in the normalized activity for the trials with gain and neutral outcomes tended to decrease with assets for the DLPFC neurons that decreased their activity during the gain trials compared with the neutral trials (Fig. 13g, green vs blue lines). For the activity related to the loss outcomes, the coefficients related to asset by loss outcomes were not significantly correlated with the coefficients related to the loss outcome in any cortical areas. The corresponding values of the Spearman's correlation coefficient were −0.173, −0.089, and 0.046 for the DMFC, ACCd, and DLPFC, respectively (p > 0.1) (supplemental Fig. 2, available at www.jneurosci.org as supplemental material). Accordingly, the difference in the normalized activity averaged separately for loss and neutral outcomes did not change substantially with the number of tokens in any cortical areas, regardless of whether the neurons increased or decreased their activity during the loss trials compared with the activity in the neutral trials (Fig. 14c–e). In summary, there were a significant number of neurons in the frontal cortex that changed their activity related to gain or loss outcomes according to the number of tokens. However, at the population level, there were no systematic biases for such outcome-related activity to strengthen or weaken with the assets.
Discussion
Reinforcement learning in competitive games
The process of acquiring adaptive behavioral strategies can be described by reinforcement learning algorithms, in which the probability of taking each action is determined by a set of value functions (Sutton and Barto, 1998). These value functions are adjusted when reward or penalty received by the animal deviates from the predicted outcomes. Reinforcement learning algorithms have been successfully applied to many decision-making problems (Barraclough et al., 2004; Lee et al., 2004; Samejima et al., 2005; Daw and Doya, 2006; Matsumoto et al., 2007; Seo and Lee, 2007; Gold et al., 2008; Lau and Glimcher, 2008), including decision making during social interactions (Mookherjee and Sopher, 1994; Erev and Roth, 1998; Camerer, 2003; Lee, 2008). For example, animals in the present study approximated the optimal strategy during a competitive game according to a reinforcement learning algorithm. The payoff matrix during this game included a negative value, which was realized as the removal of a conditioned reinforcer. Using the analyses based on logistic regression models and reinforcement learning models, we demonstrated that the gains and losses of tokens resulting from the choice of a given target increased and decreased, respectively, the animal's tendency to choose the same target in subsequent trials. The effects of gains and losses on the animal's behavior were approximately equal and opposite, whereas neutral outcomes tended to have intermediate effects. To our knowledge, this provides the first evidence that the choice behavior of nonhuman primates can be punished by the losses of conditioned reinforcers.
Neural signals related to gains and losses
Previous studies based on brain imaging and event-related potentials have implicated the medial frontal cortex in monitoring monetary gains and losses resulting from previous behaviors (Elliott et al., 1997; O'Doherty et al., 2001, 2003; Holroyd et al., 2004; Remijnse et al., 2005; Liu et al., 2007; Wrase et al., 2007). Some neurons in the primate anterior cingulate and dorsomedial frontal cortex also modulate their activity according to the outcome of the animal's action (Shima and Tanji, 1998; Matsumoto et al., 2007; Sallet et al., 2007; Seo and Lee, 2007; Uchida et al., 2007; Quilodran et al., 2008). In the present study, we found that the neurons in the DMFC, ACCd, and DLPFC also changed their activity when the animal lost a conditioned reinforcer, suggesting that such outcome-related activity did not simply signal the commission of error or omission of reward (Stuphorn et al., 2000; Ito et al., 2003; Holroyd et al., 2006), but also the abstract nature of decision outcomes. Interestingly, neurons encoding gain outcomes were found more frequently compared with loss-encoding neurons in all three cortical areas, although the magnitude of the behavioral effects were similar for gain and loss outcomes. Resolution of this apparent discrepancy awaits additional studies on the neural mechanisms responsible for translating the outcome-related activity to subsequent behavioral changes. In addition, although some neurons in each cortical area changed their activity related to gain or loss outcomes according to the number of tokens, there was no systematic bias for the activity related to gains or losses to weaken or strengthen as the animal accumulated more tokens. Therefore, at the population level, neurons in these cortical areas provided signals related to the outcomes of the animal's choices reliably throughout the task.
The results from this study also suggest that the DMFC might play a particularly important role in adjusting the animal's choice strategy based on conditioned reinforcers. First, compared with the ACCd and DLPFC, neurons in the DMFC modulated their activity more frequently according to gain and loss outcomes resulting from a particular action. For example, activity of neurons in the DMFC during the gain trials often differed depending on the action chosen by the animal. Activity of such neurons encoding the animal's choices and their outcomes conjunctively might represent whether a particular choice is likely to produce better outcomes than other alternative choices. Indeed, in the DMFC and ACCd, neurons encoding choice and loss outcome conjunctively were more likely to change their activity according to the difference in the value functions than the neurons without such conjunctive coding. Similarly, DMFC neurons encoding choice and gain outcome conjunctively tended to show modulations in their activity related to the difference in the value functions frequently. Therefore, activity related to the conjunction of choice and outcome might provide a substrate for computing the difference in the value functions. Previous studies have shown that many neurons in the medial (Uchida et al., 2007) and lateral (Barraclough et al., 2004) prefrontal cortex also change their activity according to the presence or absence of reward differently according to the animal's action. Combined with the results from the present study, this suggests that signals related to the conjunctions of action and outcome might become more prevalent in the DMFC compared with the DLPFC, when the animal's choices lead to gains and losses of conditioned reinforcers without immediate rewards. Therefore, DMFC might play a particularly important role in adjusting the animal's behavioral strategies, when the feedback is provided in more abstract forms. Second, DMFC neurons often encoded the animal's upcoming choice in conjunction with the previous choice and its outcome. For example, some neurons might increase their activity before the animal chooses a particular target only when the outcome of the same choice in the previous trial was a loss. Therefore, DMFC might provide a neural substrate necessary for modifying the animal's behavioral strategy flexibly, even when the behaviors are not immediately rewarded or punished by primary reinforcers. Third, neurons in the DMFC and ACCd were more likely to change their activity systematically according to the number of tokens owned by the animals. These signals might reflect the level of reward expectancy (Shidara and Richmond, 2002; Satoh et al., 2003; Hikosaka and Watanabe, 2004; Nakahara et al., 2004; Roesch and Olson, 2004; Sohn and Lee, 2007), because the number of tokens was closely related to the number of trials before the juice reward. This also suggests that such asset-related signals might contribute to improving the animal's performance. During the task used in this study, tokens owned by the animal were constantly displayed on the computer screen, and therefore the animals were not required to store the number of tokens in its working memory. Nevertheless, the fact that gain-related signals during the feedback period were correlated with asset-related activity during the delay period suggests that the asset-related activity might at least in part arise from the gain-related activity that is temporally integrated.
Neural circuitry for conditioned reinforcement
By definition, conditioned reinforcers are conditioned stimuli predicting upcoming rewards or aversive stimuli, and can influence the animal's behavior, even when rewards or physically aversive stimuli are omitted. In addition, conditioned reinforcers can be delivered through different sensory modalities and linked to a large number of possible actions. Therefore, the neural mechanisms for processing various aspects of conditioned reinforcers and inducing the corresponding behavioral changes are likely to be implemented in multiple brain regions. Indeed, neurons that modulate their activity according to the reward or punishment expected from a particular sensory stimulus or motor response have been found in many different brain areas, including the prefrontal cortex (Watanabe, 1996; Rolls, 2000; Barraclough et al., 2004; Kim et al., 2008), posterior parietal cortex (Platt and Glimcher, 1999), basal ganglia (Schultz, 1998; Samejima et al., 2005), and amygdala (Nishijo et al., 1988; Paton et al., 2006; Tye et al., 2008). Some of these previous studies focused on identifying the neural processes involved in extracting the affective values of conditioned reinforcers. In particular, neurons in the orbitofrontal cortex and amygdala tend to track the value of reward or punishment expected from a particular stimulus more closely than its physical attributes (Nishijo et al., 1988; Rolls, 2000; Paton et al., 2006), suggesting that these two structures might play an important role in assigning the appropriate values to conditioned reinforcers (Parkinson et al., 2001; Pears et al., 2003; Burke et al., 2008). The results from the present study suggest that the DMFC might be a key structure in linking such outcome-predicting signals to appropriate actions. In addition, we found a substantial overlap between the populations of neurons encoding gains and losses of conditioned reinforcers. However, the source of signals related to gains and losses identified in the present study is presently unknown. The orbitofrontal cortex is connected to the medial and lateral prefrontal areas (Cavada et al., 2000), and the amygdala also projects to the medial frontal regions (Porrino et al., 1981). Consistent with this anatomical connectivity, we found that the signals related to gains and losses from a particular action were represented robustly in the DMFC. It would be important to test whether and how neurons in the orbitofrontal cortex and amygdala represent the losses of conditioned reinforcers in addition to their gains, and to determine whether the altered neural activity in orbitofrontal cortex and amygdala affects the signals related to gains and losses in the DMFC.
Footnotes
This work was supported by National Institutes of Health Grant MH073246. We are grateful to M. W. Jung for his helpful comments on this manuscript.
References
- Aiken LS, West SG. Multiple regression: testing and interpreting interactions. Thousand Oaks, CA: Sage; 1991. [Google Scholar]
- Barraclough DJ, Conroy ML, Lee D. Prefrontal cortex and decision making in a mixed-strategy game. Nat Neurosci. 2004;7:404–410. doi: 10.1038/nn1209. [DOI] [PubMed] [Google Scholar]
- Bruce CJ, Goldberg ME, Bushnell MC, Stanton GB. Primate frontal eye fields. II. Physiological and anatomical correlates of electrically evoked eye movements. J Neurophysiol. 1985;54:714–734. doi: 10.1152/jn.1985.54.3.714. [DOI] [PubMed] [Google Scholar]
- Burke KA, Franz TM, Miller DN, Schoenbaum G. The role of the orbitofrontal cortex in the pursuit of happiness and more specific rewards. Nature. 2008;454:340–344. doi: 10.1038/nature06993. [DOI] [PMC free article] [PubMed] [Google Scholar]
- Burnham KP, Anderson DR. Model selection and multimodel inference: a practical information-theoretic approach. New York: Springer; 2002. [Google Scholar]
- Camerer CF. Behavioral game theory: experiments in strategic interaction. Princeton, NJ: Princeton UP; 2003. [Google Scholar]
- Cavada C, Compañy T, Tejedor J, Cruz-Rizzolo RJ, Reinoso-Suárez F. The anatomical connections of the macaque monkey orbitofrontal cortex. A review. Cereb Cortex. 2000;10:220–242. doi: 10.1093/cercor/10.3.220. [DOI] [PubMed] [Google Scholar]
- Daw ND, Doya K. The computational neurobiology of learning and reward. Curr Opin Neurobiol. 2006;16:199–204. doi: 10.1016/j.conb.2006.03.006. [DOI] [PubMed] [Google Scholar]
- Delgado MR, Nystrom LE, Fissell C, Noll DC, Fiez JA. Tracking the hemodynamic responses to reward and punishment in the striatum. J Neurophysiol. 2000;84:3072–3077. doi: 10.1152/jn.2000.84.6.3072. [DOI] [PubMed] [Google Scholar]
- Elliott R, Frith CD, Dolan RJ. Differential neural response to positive and negative feedback in planning and guessing tasks. Neuropsychologia. 1997;35:1395–1404. doi: 10.1016/s0028-3932(97)00055-9. [DOI] [PubMed] [Google Scholar]
- Erev I, Roth AE. Predicting how people play games: reinforcement learning in experimental games with unique, mixed strategy equilibria. Am Econ Rev. 1998;88:848–881. [Google Scholar]
- Gehring WJ, Willoughby AR. The medial frontal cortex and the rapid processing of monetary gains and losses. Science. 2002;295:2279–2282. doi: 10.1126/science.1066893. [DOI] [PubMed] [Google Scholar]
- Gold JI, Law CT, Connolly P, Bennur S. The relative influences of priors and sensory evidence on an oculomotor decision variable during perceptual learning. J Neurophysiol. 2008;100:2653–2668. doi: 10.1152/jn.90629.2008. [DOI] [PMC free article] [PubMed] [Google Scholar]
- Hikosaka K, Watanabe M. Long- and short-range reward expectancy in the primate orbitofrontal cortex. Eur J Neurosci. 2004;19:1046–1054. doi: 10.1111/j.0953-816x.2004.03120.x. [DOI] [PubMed] [Google Scholar]
- Holroyd CB, Larsen JT, Cohen JD. Context dependence of the event-related brain potential associated with reward and punishment. Psychophysiology. 2004;41:245–253. doi: 10.1111/j.1469-8986.2004.00152.x. [DOI] [PubMed] [Google Scholar]
- Holroyd CB, Hajcak G, Larsen JT. The good, the bad and the neural: electrophysiological responses to feedback stimuli. Brain Res. 2006;1105:93–101. doi: 10.1016/j.brainres.2005.12.015. [DOI] [PubMed] [Google Scholar]
- Hosokawa T, Kato K, Inoue M, Mikami A. Neurons in the macaque orbitofrontal cortex code relative preference of both rewarding and aversive outcomes. Neurosci Res. 2007;57:434–445. doi: 10.1016/j.neures.2006.12.003. [DOI] [PubMed] [Google Scholar]
- Ito S, Stuphorn V, Brown JW, Schall JD. Performance monitoring by the anterior cingulate cortex during saccade countermanding. Science. 2003;302:120–122. doi: 10.1126/science.1087847. [DOI] [PubMed] [Google Scholar]
- Joshua M, Adler A, Mitelman R, Vaadia E, Bergman H. Midbrain dopaminergic neurons and striatal cholinergic interneurons encode the difference between reward and aversive events at different epochs of probabilistic classical conditioning trials. J Neurosci. 2008;28:11673–11684. doi: 10.1523/JNEUROSCI.3839-08.2008. [DOI] [PMC free article] [PubMed] [Google Scholar]
- Kazdin AE. Response cost: the removal of conditioned reinforcers for therapeutic change. Behav Ther. 1972;3:533–546. [Google Scholar]
- Kazdin AE. The token economy. New York: Plenum; 1977. [Google Scholar]
- Kelleher RT, Gollub LR. A review of positive conditioned reinforcement. J Exp Anal Behav. 1962;5:543–597. doi: 10.1901/jeab.1962.5-s543. [DOI] [PMC free article] [PubMed] [Google Scholar]
- Kim H, Shimojo S, O'Doherty JP. Is avoiding an aversive outcome rewarding? Neural substrates of avoidance learning in the human brain. PLoS Biol. 2006;4:e233. doi: 10.1371/journal.pbio.0040233. [DOI] [PMC free article] [PubMed] [Google Scholar]
- Kim S, Hwang J, Lee D. Prefrontal coding of temporally discounted values during intertemporal choice. Neuron. 2008;59:161–172. doi: 10.1016/j.neuron.2008.05.010. [DOI] [PMC free article] [PubMed] [Google Scholar]
- Knutson B, Westdorp A, Kaiser E, Hommer D. FMRI visualization of brain activity during a monetary incentive delay task. Neuroimage. 2000;12:20–27. doi: 10.1006/nimg.2000.0593. [DOI] [PubMed] [Google Scholar]
- Kobayashi S, Nomoto K, Watanabe M, Hikosaka O, Schultz W, Sakagami M. Influences of rewarding and aversive outcomes on activity in macaque lateral prefrontal cortex. Neuron. 2006;51:861–870. doi: 10.1016/j.neuron.2006.08.031. [DOI] [PubMed] [Google Scholar]
- Koyama T, Kato K, Tanaka YZ, Mikami A. Anterior cingulate activity during pain-avoidance and reward tasks in monkeys. Neurosci Res. 2001;39:421–430. doi: 10.1016/s0168-0102(01)00197-3. [DOI] [PubMed] [Google Scholar]
- Lau B, Glimcher PW. Value representations in the primate striatum during matching behavior. Neuron. 2008;58:451–463. doi: 10.1016/j.neuron.2008.02.021. [DOI] [PMC free article] [PubMed] [Google Scholar]
- Lee D. Game theory and neural basis of social decision making. Nat Neurosci. 2008;11:404–409. doi: 10.1038/nn2065. [DOI] [PMC free article] [PubMed] [Google Scholar]
- Lee D, Seo H. Mechanisms of reinforcement learning and decision making in the primate dorsolateral prefrontal cortex. Ann N Y Acad Sci. 2007;1104:108–122. doi: 10.1196/annals.1390.007. [DOI] [PubMed] [Google Scholar]
- Lee D, Conroy ML, McGreevy BP, Barraclough DJ. Reinforcement learning and decision making in monkeys during a competitive game. Cogn Brain Res. 2004;22:45–58. doi: 10.1016/j.cogbrainres.2004.07.007. [DOI] [PubMed] [Google Scholar]
- Lee D, McGreevy BP, Barraclough DJ. Learning and decision making in monkeys during a rock-paper-scissors game. Cogn Brain Res. 2005;25:416–430. doi: 10.1016/j.cogbrainres.2005.07.003. [DOI] [PubMed] [Google Scholar]
- Liu X, Powell DK, Wang H, Gold BT, Corbly CR, Joseph JE. Functional dissociation in frontal striatal areas for processing of positive and negative reward information. J Neurosci. 2007;27:4587–4597. doi: 10.1523/JNEUROSCI.5227-06.2007. [DOI] [PMC free article] [PubMed] [Google Scholar]
- Matsumoto M, Hikosaka O. Representation of negative motivational value in the primate lateral habenula. Nat Neurosci. 2009;12:77–84. doi: 10.1038/nn.2233. [DOI] [PMC free article] [PubMed] [Google Scholar]
- Matsumoto M, Matsumoto K, Abe H, Tanaka K. Medial prefrontal cell activity signaling prediction errors of action values. Nat Neurosci. 2007;10:647–656. doi: 10.1038/nn1890. [DOI] [PubMed] [Google Scholar]
- Mookherjee D, Sopher B. Learning behavior in an experimental matching pennies game. Games Econ Behav. 1994;7:62–91. [Google Scholar]
- Nader MA, Morgan D. Effects of negative punishment contingencies on cocaine self-administration by rhesus monkeys. Behav Pharmacol. 2001;12:91–99. doi: 10.1097/00008877-200104000-00002. [DOI] [PubMed] [Google Scholar]
- Nakahara H, Itoh H, Kawagoe R, Takikawa Y, Hikosaka O. Dopamine neurons can represent context-dependent prediction error. Neuron. 2004;41:269–280. doi: 10.1016/s0896-6273(03)00869-9. [DOI] [PubMed] [Google Scholar]
- Nash JF. Equilibrium points in n-person games. Proc Natl Acad Sci U S A. 1950;36:48–49. doi: 10.1073/pnas.36.1.48. [DOI] [PMC free article] [PubMed] [Google Scholar]
- Nishijo H, Ono T, Nishino H. Single neuron responses in amygdala of alert monkey during complex sensory stimulation with affective significance. J Neurosci. 1988;8:3570–3583. doi: 10.1523/JNEUROSCI.08-10-03570.1988. [DOI] [PMC free article] [PubMed] [Google Scholar]
- O'Doherty J, Kringelbach ML, Rolls ET, Hornak J, Andrews C. Abstract reward and punishment representations in the human orbitofrontal cortex. Nat Neurosci. 2001;4:95–102. doi: 10.1038/82959. [DOI] [PubMed] [Google Scholar]
- O'Doherty J, Critchley H, Deichmann R, Dolan RJ. Dissociating valence of outcome from behavioral control in human orbital and ventral prefrontal cortices. J Neurosci. 2003;23:7931–7939. doi: 10.1523/JNEUROSCI.23-21-07931.2003. [DOI] [PMC free article] [PubMed] [Google Scholar]
- Parkinson JA, Crofts HS, McGuigan M, Tomic DL, Everitt BJ, Roberts AC. The role of the primate amygdala in conditioned reinforcement. J Neurosci. 2001;21:7770–7780. doi: 10.1523/JNEUROSCI.21-19-07770.2001. [DOI] [PMC free article] [PubMed] [Google Scholar]
- Paton JJ, Belova MA, Morrison SE, Salzman CD. The primate amygdala represents the positive and negative value of visual stimuli during learning. Nature. 2006;439:865–870. doi: 10.1038/nature04490. [DOI] [PMC free article] [PubMed] [Google Scholar]
- Pawitan Y. In all likelihood: statistical modelling and inference using likelihood. Oxford: Clarendon; 2001. [Google Scholar]
- Pears A, Parkinson JA, Hopewell L, Everitt BJ, Roberts AC. Lesions of the orbitofrontal but not medial prefrontal cortex disrupt conditioned reinforcement in primates. J Neurosci. 2003;23:11189–11201. doi: 10.1523/JNEUROSCI.23-35-11189.2003. [DOI] [PMC free article] [PubMed] [Google Scholar]
- Pietras CJ, Hackenberg TD. Response-cost punishment via token loss with pigeons. Behav Processes. 2005;69:343–356. doi: 10.1016/j.beproc.2005.02.026. [DOI] [PubMed] [Google Scholar]
- Platt ML, Glimcher PW. Neural correlates of decision variables in parietal cortex. Nature. 1999;400:233–238. doi: 10.1038/22268. [DOI] [PubMed] [Google Scholar]
- Porrino LJ, Crane AM, Goldman-Rakic PS. Direct and indirect pathways from the amygdala to the frontal lobe in rhesus monkeys. J Comp Neurol. 1981;198:121–136. doi: 10.1002/cne.901980111. [DOI] [PubMed] [Google Scholar]
- Quilodran R, Rothé M, Procyk E. Behavioral shifts and action valuation in the anterior cingulate cortex. Neuron. 2008;57:314–325. doi: 10.1016/j.neuron.2007.11.031. [DOI] [PubMed] [Google Scholar]
- Remijnse PL, Nielen MM, Uylings HB, Veltman DJ. Neural correlates of a reversal learning task with an affectively neutral baseline: an event-related fMRI study. Neuroimage. 2005;26:609–618. doi: 10.1016/j.neuroimage.2005.02.009. [DOI] [PubMed] [Google Scholar]
- Roesch MR, Olson CR. Neuronal activity related to reward value and motivation in primate frontal cortex. Science. 2004;304:307–310. doi: 10.1126/science.1093223. [DOI] [PubMed] [Google Scholar]
- Rolls ET. The orbitofrontal cortex and reward. Cereb Cortex. 2000;10:284–294. doi: 10.1093/cercor/10.3.284. [DOI] [PubMed] [Google Scholar]
- Sallet J, Quilodran R, Rothé M, Vezoli J, Joseph JP, Procyk E. Expectations, gains, and losses in the anterior cingulate cortex. Cogn Affect Behav Neurosci. 2007;7:327–336. doi: 10.3758/cabn.7.4.327. [DOI] [PMC free article] [PubMed] [Google Scholar]
- Samejima K, Ueda Y, Doya K, Kimura M. Representation of action-specific reward values in the striatum. Science. 2005;310:1337–1340. doi: 10.1126/science.1115270. [DOI] [PubMed] [Google Scholar]
- Satoh T, Nakai S, Sato T, Kimura M. Correlated coding of motivation and outcome of decision by dopamine neurons. J Neurosci. 2003;23:9913–9923. doi: 10.1523/JNEUROSCI.23-30-09913.2003. [DOI] [PMC free article] [PubMed] [Google Scholar]
- Schultz W. Predictive reward signal of dopamine neurons. J Neurophysiol. 1998;80:1–27. doi: 10.1152/jn.1998.80.1.1. [DOI] [PubMed] [Google Scholar]
- Seo H, Lee D. Temporal filtering of reward signals in the dorsal anterior cingulate cortex during a mixed-strategy game. J Neurosci. 2007;27:8366–8377. doi: 10.1523/JNEUROSCI.2369-07.2007. [DOI] [PMC free article] [PubMed] [Google Scholar]
- Seo H, Lee D. Cortical mechanisms for reinforcement learning in competitive games. Philos Trans R Soc Lond B Biol Sci. 2008;363:3845–3857. doi: 10.1098/rstb.2008.0158. [DOI] [PMC free article] [PubMed] [Google Scholar]
- Seo H, Barraclough DJ, Lee D. Dynamic signals related to choices and outcomes in the dorsolateral prefrontal cortex. Cereb Cortex. 2007;17:i110–i117. doi: 10.1093/cercor/bhm064. [DOI] [PubMed] [Google Scholar]
- Seymour B, Daw N, Dayan P, Singer T, Dolan R. Differential encoding of losses and gains in the human striatum. J Neurosci. 2007;27:4826–4831. doi: 10.1523/JNEUROSCI.0400-07.2007. [DOI] [PMC free article] [PubMed] [Google Scholar]
- Shidara M, Richmond BJ. Anterior cingulate: single neuronal signals related to degree of reward expectancy. Science. 2002;296:1709–1711. doi: 10.1126/science.1069504. [DOI] [PubMed] [Google Scholar]
- Shima K, Tanji J. Role for cingulate motor area cells in voluntary movement selection based on reward. Science. 1998;282:1335–1338. doi: 10.1126/science.282.5392.1335. [DOI] [PubMed] [Google Scholar]
- Sohn JW, Lee D. Order-dependent modulation of directional signals in the supplementary and supplementary motor areas. J Neurosci. 2007;27:13655–13666. doi: 10.1523/JNEUROSCI.2982-07.2007. [DOI] [PMC free article] [PubMed] [Google Scholar]
- Stuphorn V, Taylor TL, Schall JD. Performance monitoring by the supplementary eye field. Nature. 2000;408:857–860. doi: 10.1038/35048576. [DOI] [PubMed] [Google Scholar]
- Sutton RS, Barto AG. Reinforcement learning: an introduction. Cambridge, MA: MIT; 1998. [Google Scholar]
- Tehovnik EJ, Sommer MA, Chou IH, Slocum WM, Schiller PH. Eye fields in the frontal lobes of primates. Brain Res Brain Res Rev. 2000;32:413–448. doi: 10.1016/s0165-0173(99)00092-2. [DOI] [PubMed] [Google Scholar]
- Tye KM, Stuber GD, de Ridder B, Bonci A, Janak PH. Rapid strengthening of thalamo-amygdala synapses mediates cue-reward learning. Nature. 2008;453:1253–1257. doi: 10.1038/nature06963. [DOI] [PMC free article] [PubMed] [Google Scholar]
- Uchida Y, Lu X, Ohmae S, Takahashi T, Kitazawa S. Neuronal activity related to reward size and rewarded target position in primate supplementary eye field. J Neurosci. 2007;27:13750–13755. doi: 10.1523/JNEUROSCI.2693-07.2007. [DOI] [PMC free article] [PubMed] [Google Scholar]
- Watanabe M. Reward expectancy in primate prefrontal neurons. Nature. 1996;382:629–632. doi: 10.1038/382629a0. [DOI] [PubMed] [Google Scholar]
- Weiner H. Some effects of response cost upon human operant behavior. J Exp Anal Behav. 1962;5:201–208. doi: 10.1901/jeab.1962.5-201. [DOI] [PMC free article] [PubMed] [Google Scholar]
- Wolfe JB. Effectiveness of token-rewards for chimpanzees. Comp Psychol Monogr. 1936;12:1–72. [Google Scholar]
- Wrase J, Kahnt T, Schlagenhauf F, Beck A, Cohen MX, Knutson B, Heinz A. Different neural systems adjust motor behavior in response to reward and punishment. Neuroimage. 2007;36:1253–1262. doi: 10.1016/j.neuroimage.2007.04.001. [DOI] [PubMed] [Google Scholar]


