

Abstract
The locus ceruleus (LC) can exhibit tonic or phasic activity and release norepinephrine (NE) throughout the cortex, modulating cellular excitability and synaptic efficacy and thus influencing behavioral performance. We study the effects of LC–NE modulation on decision making in two-alternative forced-choice tasks by changing conductances in a biophysical neural network model, and we investigate how it affects performance measured in terms of reward rate. We find that low tonic NE levels result in unmotivated behavior and high levels in impulsive, inaccurate choices, but that near-optimal performance can occur over a broad middle range. Robustness is greatest when pyramidal cells are less strongly modulated than interneurons, and superior performance can be achieved with phasic NE release, provided only glutamatergic synapses are modulated. We also show that network functions such as sensory information accumulation and short-term memory can be modulated by tonic NE levels, and that previously observed diverse evoked cell responses may be due to network effects.
Introduction
Neuromodulation is important in decision making (Doya, 2008). Here we examine norepinephrine (NE) modulation due to activation of the locus ceruleus (LC), a brainstem nucleus that receives diffuse afferent inputs and projects back throughout the cortex (Morrison and Foote, 1986; Aston-Jones et al., 1991; Waterhouse et al., 1998a; Simpson and Lin, 2007). NE released by efferent LC fibers changes cellular excitability and synaptic efficacy (Berridge and Waterhouse, 2003) and can alter performance in behavioral tasks (Berridge and Waterhouse, 2003; Aston-Jones and Cohen, 2005; Bouret and Sara, 2005). Dysregulation of NE is also implicated in cognitive disorders (Arnsten, 2007).
LC activity can be categorized into tonic and phasic modes. In the former, LC neurons fire asynchronously, producing steady cortical NE levels proportional to average firing rates (Berridge and Abercrombie, 1999). In the phasic mode, coherent LC firing temporarily raises NE levels during task execution. Low tonic LC rates accompany drowsy, unmotivated behavior; moderate tonic LC rates, including those that precede phasic NE release, promote vigilance and good performance (Aston-Jones, 2005; Aston-Jones and Cohen, 2005); and high tonic LC activity correlates with poor performance (Usher et al., 1999; Clayton et al., 2004) and is associated with stress (Valentino et al., 1993; Rajkowski et al., 1994; Aston-Jones, 2005; Berridge, 2008).
In vitro experiments show that cells in rat whisker barrel cortex are more likely to spike in response to stimuli when NE concentrations are high (Waterhouse et al., 2000). In vitro and in vivo work in waking animals reveals similar effects on sensory encoding (Devilbiss and Waterhouse, 2004; Devilbiss et al., 2006), signal detection, and sensory discrimination (Aston-Jones et al., 1994, 2007; Usher et al., 1999; Clayton et al., 2004; Rajkowski et al., 2004). Experiments have also illuminated the relationship between the LC–NE system and performance in multialternative tasks [e.g., Rajkowski et al. (1994, 2004), Usher et al. (1999), and Clayton et al. (2004)]. However, there are few explicit studies of LC–NE effects on perceptual discrimination or decision-making tasks [cf. Shadlen and Newsome (2001) and Roitman and Shadlen (2002)], and related theoretical work has used abstract Bayesian or connectionist models (Servan-Schreiber et al., 1990; Usher et al., 1999; Usher and Davelaar, 2002; Yu and Dayan, 2005; Dayan and Yu, 2006; Shea-Brown et al., 2008). Biophysically realistic models (Hasselmo et al., 1997; Hoshino, 2005; Moxon et al., 2007) have typically focused on sensory encoding rather than decision making.
In this paper we employ a biophysically based spiking neural network model (Wang, 2002) to study effects of the LC–NE system on decision making in two-alternative forced-choice (2AFC) tasks, as exemplified by the reaction time motion discrimination task of Roitman and Shadlen (2002) and its delayed and cued response version (Shadlen and Newsome, 2001; Roitman and Shadlen, 2002). Allowing synaptic or membrane leak conductances to change with NE concentration, we find that performance is most robust when excitation and inhibition are comodulated, and that the high performance region can be extended by varying the ratio of modulation of excitation to inhibition. Depending on this ratio, the model exhibits diverse nonlinear single-cell evoked responses, and at the ratio that also provides near-maximum robustness, it replicates inverted-U evoked responses. Certain key physiological details of the LC–NE system remain unknown, and we evaluate implications of different possibilities, illustrating the need for further experiments.
Materials and Methods
The cortical microcircuit model for decision making.
We adopt an architecture that was originally developed to simulate working memory in the prefrontal cortex of nonhuman primates (Brunel and Wang, 2001) and has since been adapted to describe temporal integration of sensory information and sustained memory of choice in decision making [e.g., in the lateral intraparietal area (LIP) (Shadlen and Newsome, 2001; Roitman and Shadlen, 2002; Wang, 2002)]. The network consists of 2000 single-compartment leaky integrate-and-fire neurons, divided into four populations. Two of these, each containing 240 excitatory pyramidal cells, are preferentially selective to the stimuli (e.g., leftward or rightward visual motions in visual discrimination tasks). A nonselective population of 1120 excitatory neurons and a population of 400 inhibitory interneurons complete the circuit. See Figure 1A.
Figure 1.
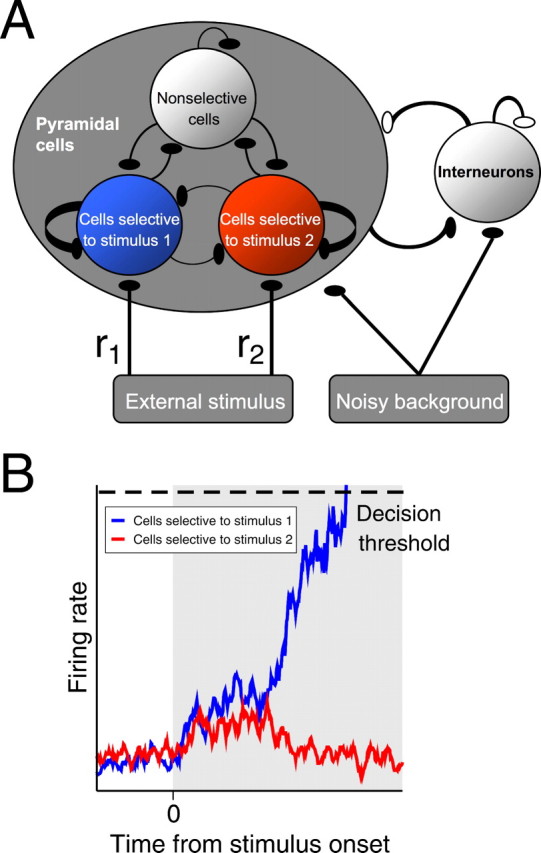
Model architecture. A, The network contains three populations of excitatory pyramidal cells and one of inhibitory interneurons. Each of the two excitatory populations has a response field selective to one stimulus (e.g., leftward or rightward visual motion), and the third excitatory population is nonselective to both stimuli. Interneurons provide overall feedback inhibition to pyramidal cells. Excitatory (glutamatergic-mediated) and inhibitory (GABAA-mediated) synapses are respectively denoted by filled and open ovals. All cells receive noisy background excitation from brain areas outside the local microcircuit. Each cell connects to every other, and selective populations have relatively stronger local recurrent excitation among themselves. All excitatory synapses are mediated by NMDA and AMPA, except the external stimulus and the noisy background, which are mediated only by AMPA. B, Stimuli deliver excitatory inputs to both selective populations, but inhibitory cells typically suppress one population, producing winner-take-all dynamics. A decision is made when the first selective population crosses a prescribed threshold. See Materials and Methods and supplemental material (available at www.jneurosci.org) for further details.
All cells are connected to all others by recurrent synapses mediated by NMDA and AMPA, both glutamatergic, and by GABAA. The pyramidal cells have NMDA and AMPA receptors internally and for connections to inhibitory interneurons, and the inhibitory population employs GABAA receptors internally and for connections back to pyramidal cells. Each cell receives noisy synaptic inputs from cells outside its local microcircuit, mediated by AMPA receptors, at 2.4 kHz (e.g., as if from 800 neurons with spontaneous firing rates of 3 Hz). These are modeled by a Gaussian approximation to the Poisson statistics that are typically assumed. Samples are generated independently for each neuron and for each trial (see supplemental material, available at www.jneurosci.org). This provides the main source of variability in neural and behavioral outcomes among simulated trials. Following Hebbian plasticity, connections within each selective population are assumed to be stronger than interconnections to other cell populations. NMDA-mediated receptors are assumed to have rise and decay time constants of 2 and 100 ms. The relatively faster AMPA-mediated and GABA-mediated receptors have instantaneous rise time and decay time constants of 2 and 5 ms, respectively.
During stimulus presentation the selective populations receive additional external inputs, representing outputs of upstream sensory pathways [e.g., middle temporal or MT/V5 cortical neurons during visual motion discrimination tasks (Britten et al., 1993; Gold and Shadlen, 2007)]. When stimulus 1 is displayed, cells selective to stimuli 1 and 2, respectively, receive additional inputs with means r1 = μ0(1 + c′) and r2 = μ0(1 − c′), where μ0 = 40 Hz is the background input and −1 ≤ c′ ≤ 1 quantifies stimulus discriminability. The remaining excitatory and inhibitory cells, being nonselective to the stimuli, receive no additional inputs.
Stimuli initially raise both selective population activities from their common baseline. Inhibition from the interneurons subsequently allows the firing rate of one selective population to continue increasing while suppressing the other selective population, exhibiting winner-take-all behavior (Fig. 1B). When the firing rate of either population reaches a prescribed decision threshold, a choice is made in favor of its response field. The dimensionless parameter E = (r1 − r2)/(r1 + r2) (=c′), analogous to a signal-to-noise ratio, quantifies task difficulty: smaller differences |r1 − r2| connote harder tasks and E = 0 denotes maximum difficulty. In visual motion discrimination tasks (Britten et al., 1993; Wang, 2002; Gold and Shadlen, 2007), E can be interpreted as the fraction of coherently moving dots embedded in a random dot kinetogram (e.g., E = 0.032, 0.064, …), with E > 0 if the stimulus is in the response field of the population, and E < 0 if opposite to it.
Due to inherent symmetry between the selective populations, we may henceforth assume without loss of generality that E ≥ 0, and with the motion task in mind, bias strengths were selected from the set 0.032, 0.064, 0.128, 0.256. Using the parameters of Wang (2002), with synaptic weights tuned to allow integration of sensory information and sustained storage of decisions in working memory, the network reproduces the data of Shadlen and Newsome (2001) and Roitman and Shadlen (2002), and we therefore adopt these as “standard” parameter values. Figure 2 illustrates qualitatively similar results to those of Wang (2002), but we allow a range of decision thresholds, and select a higher threshold than Wang (2002) for subsequent use (see below, Reward rate dependence on decision threshold). The governing equations and all parameter values are specified in supplemental material (available at www.jneurosci.org).
Figure 2.

Reward rate dependence on task difficulty and threshold. Difficulty is varied by changing stimulus bias, E. In A and B, decision threshold is fixed at 20 Hz with E = 0.032 (red), 0.064 (mauve), 0.128 (black), and 0.256 (yellow). A, Psychometric function, showing that percentage of rewarded trials increases with E, with data fitted by a Weibull cumulative distribution (dotted). B, Mean trial time decreases with E; data are fitted linearly (dotted). C, Reward rate dependence on decision threshold and difficulty. All performance curves decline steeply for low thresholds, but remain close to their maxima for a range of higher thresholds, and optimal thresholds (∼12 Hz) vary little with E. The color convention is as in A and B. RSI is 1750 ms and nondecision latency is assumed to be 250 ms. Error bars denote SEs, and vertical dotted line marks 20 Hz decision threshold used in the remainder of the paper. Parameters are as in the study by Wang (2002).
Behavioral tasks and analysis of reward rate performance.
In simulating reaction time tasks, the decision time (DT) is defined as the interval from stimulus onset to threshold crossing. If the threshold is crossed before stimulus onset, the trial is labeled as “impulsive,” and if neither selective population's firing rate has crossed threshold when stimulus presentation ends, the trial is labeled as “no-choice.” The remaining valid trials are correct if the choice is consistent with the stimulus, and errors otherwise. After each response or no-choice trial, firing rates of all populations are reset to their spontaneous states (Lo and Wang, 2006), and a response-to-stimulus interval (RSI), or prestimulus period, is imposed before the next stimulus appears, during which the network is subject to noisy nonstimulus inputs.
We simulate a block of 500 trials for each set of network parameters and task conditions. Each trial is a stochastic realization of a possible outcome due to (pseudo)randomly generated noise in the stimulus input and other brain areas, and it falls into one of our categories: correct, error, impulsive, or no-choice. Only correct trials are rewarded. No additional penalty delay is imposed for errors or premature responses [mean decision times for errors exceed those for correct decisions in this model (Wang, 2002; Wong and Wang, 2006)]. Accuracy is defined as the fraction of correct trials in a block.
We define the reward rate for a block of trials as the total number of rewarded (correct) trials divided by the summed duration of all trials. In the latter we include nondecision latencies (NDLs) due to signal transduction and motor preparation, which are assumed constant, so that the reaction time is the sum DT + NDL:
 |
where 〈 〉 implies an average over all trials. We may absorb the constant NDL into the RSI without affecting the results. We take RSI = 1750 ms and NDL = 250 ms (Roitman and Shadlen, 2002). DTs for impulsive decisions are negative, although the trial time DT + NDL + RSI > 0, and DTs for no-choice trials are taken to be equal to the maximum stimulus duration, here 2000 ms. Our definition of reward rate generalizes that of Bogacz et al. (2006), Ditterich (2006), and Lo and Wang (2006), which excluded impulsive and no-choice trials.
SEs for accuracy, mean decision times, and reward rate are found by first calculating the quantity of interest for each trial. Accuracy is logged either as 1 (correct) or 0 (error) for each trial. The total trial time is DT + RSI + NDL, and the reward rate for a trial is therefore 1/(DT + RSI + NDL) if correct and 0 if unrewarded. We then find the mean and unbiased SD of the collection of results for each block of n = 500 trials, and divide the SD by the square root of n, in this case .
In delayed-response tasks, we wish to study how neuromodulation affects memory-dependent decisions. The network must sustain a memory of a categorical choice that has just been made over a delay period that follows stimulus offset. Sustenance of memory in the form of persistent firing rates of the winning population during the delay period requires strong recurrent reverberation. To probe the network dynamics, we use two different tasks, in one of which the response is cued at stimulus offset, and in the other after a delay period. For delayed-response tasks, we employ a fixed stimulus duration of 1000 ms, and a fixed delay, when applicable, of 1000 ms. Only accuracy is recorded, since mean decision time is fixed (and thus reward rate depends linearly on accuracy). To isolate the accuracy due to memory-dependent decisions, we directly compare accuracy in the two cases.
Reward rate dependence on decision threshold.
Since decision thresholds affect accuracy, response times, and reward rates (Lo and Wang, 2006; Bogacz et al., 2006; Simen et al., 2006), we begin by examining network performance with different decision thresholds (assumed identical for both alternatives), using the parameters of Wang (2002).
Figure 2, A and B, reproduces stereotypical behavior in 2AFC reaction time tasks, using the parameters of Wang (2002), as detailed in supplemental material (available at www.jneurosci.org). The percentage of rewarded trials increases as the task becomes easier; simultaneously, reaction times and mean trial times decrease. The reward rate (Eq. 1) combines accuracy and reaction time, and Figure 2C shows that thresholds strongly affect this quantity, resulting in steep declines below ∼9 Hz and above ∼40 Hz. At low thresholds, noise triggers decisions before stimulus onset, causing impulsivity. The percentage of rewarded trials grows as thresholds increase, but decision times also grow. These effects balance at an optimal threshold (∼12 Hz for all values of E tested here), and thereafter increases in decision time dominate increasing accuracy, but reward rates remain within ∼10% of their maxima until ∼40 Hz, defining a range of robust behavior. Above 45 Hz, successively fewer trials reach threshold, resulting in no-choices.
We henceforth adopt a 20 Hz decision threshold, since it lies near the middle of the robust performance range in Figure 2C, and can be held constant as we modulate the network over a wide range of values without getting too close to failure mode [the original model of Wang (2002) used a threshold of 15 Hz]. The effect of stimulus bias E is primarily to rigidly translate the reward rate curve. We did not attempt to covary thresholds and gain, as these can have confounding effects.
A simpler definition of reward rate as the quotient of accuracy and decision time exhibits a similar form for a spiking model (Lo and Wang, 2006) and in lower-dimensional models (Bogacz et al., 2006; Simen et al., 2006). However, the reward rate in Equation 1 remains high over a larger threshold range than that in the study by Lo and Wang (2006), and there is no significant rightward shift in optimal reward rate as E increases, as in the studies by Bogacz et al. (2006) and Lo and Wang (2006). This may be due to (1) a longer RSI [1750 ms cf. 750 ms in the study by Lo and Wang (2006)]; (2) our exclusion of penalty delays: error penalties would make reward rate maxima more distinct; and (3) our inclusion of impulsive and no-choice trials.
Modeling tonic NE modulation.
Three types of adrenoreceptors generally mediate NE: α1 and β postsynaptically, and α2 presynaptically and postsynaptically (Berridge and Waterhouse, 2003). Higher NE levels reduce membrane leak conductances, allowing cells to further depolarize (Foehring et al., 1989; McCormick and Pape, 1990). The GABAA-mediated chloride current is enhanced in the somatosensory cortex via β-adrenoreceptors (Waterhouse et al., 1982; Sessler et al., 1995), as are the amplitudes of glutamatergic-mediated EPSPs via α1 (Mouradian et al., 1991; Devilbiss and Waterhouse, 2000).
Differing single-cell behaviors have been observed in various systems and experimental protocols. In Figure 1 of Waterhouse et al. (1988) and Figure 6 of Waterhouse et al. (1990), gating effects are seen during NE iontophoresis as neurons respond to previously subthreshold stimuli, and Figure 4 of Waterhouse et al. (1988) shows NE gating of an inhibitory response to GABA. Other iontophoresis experiments reveal that neurons exhibit a diversity of responses to NE, with some initially facilitated and then suppressed and others monotonically suppressed [Devilbiss and Waterhouse (2000), their Fig. 1]. Figures 2 and 3 of Waterhouse et al. (2000) show that these different responses can be related to the layers in which the apical dendritic tree resides. Finally, moving from NE iontophoresis to LC stimulation, suppression or initial facilitation of evoked responses, increase of postexcitatory inhibition, and increased stimulus-evoked inhibition can all appear in different neurons in both cortex and thalamus [Devilbiss and Waterhouse (2004), their Figs. 1–3, 7]. These behaviors are not directly implemented into the current model, although similar results can be obtained with the simpler model features described below.
Figure 6.
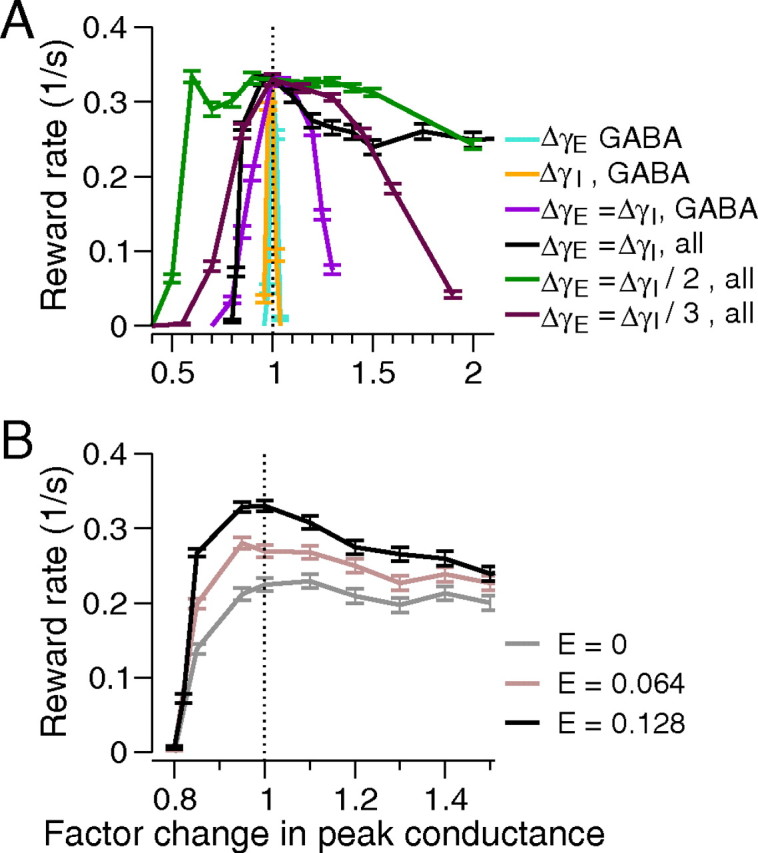
Performance under simultaneous variation of peak conductances of GABAergic and glutamatergic mediated synapses. A, Equal modulation of NMDA. AMPA, and GABAA peak conductances of all synapses (black) increases robustness over that due to changing GABAA alone (violet). If NMDA and AMPA synapses are modulated by half (green) and one-third (brown) as much as GABAA synapses, robustness increases further and then decreases. Data from Figure 4 are replotted with same colors for comparison. B, Decreasing task difficulty from E = 0 to 0.64 and 0.128 (gray, mauve, and black) under equal excitation and inhibition modulation improves reward rates without affecting robustness. Note different abscissa scales. Error bars denote SEs.
Figure 4.

Network performance with tonic NE modulation of recurrent inhibitory synapses. A–D, Turquoise, orange, and violet curves, respectively, show effects of changes in GABA synapses of pyramidal cells, interneurons, and both. A, Changes in no-choice (dashed) and impulsive trials (dotted). B, Changes in rewarded (correct) trials. C, Changes in decision times. D, Robustness increases with simultaneous modulation of pyramidal cells and interneurons. E–G are labeled as in D, but respectively show effects of modulation of only NMDA- and AMPA- mediated synapses and membrane time constant τm = Cm/gL. The black curve in G is the result of modulating τm and all synapses for all cells. Stimulus bias E = 0.128, nondecision latency NDL = 250 ms, and response-to-stimulus interval RSI = 1750 ms. Error bars denote SEs.
Figure 3.

Phasic LC–NE modulation of conductances. A, Steady-state peak conductance ḡ(t) of Equation 3 that would result if synapses responded instantaneously to phasic NE levels. B, Changes in peak conductance g(t) due to Equation 4.
Figure 7.

Neural dynamics under tonic NE modulation. A, Trial- and population-averaged neural activities for correct (left column) and error (right column) trials with different peak conductances. Firing rates are not reset to spontaneous states after reaching 20 Hz decision thresholds (dashed black lines). Top to bottom: factor changes 0.85, 1.0 [standard parameter set of Wang (2002)], 1.5, and 2.0. Error trial activities rise more slowly than correct ones, resulting in longer decision times. Blue and red, Selective pyramidal cells; black, nonselective pyramidal cells; green, interneurons. Stimulus bias E = 0.128. B, Trial averages of spike counts per cell during a 1000 ms stimulus presentation. All glutamatergic and GABAergic synaptic conductances are modulated. Spike counts increase with E (gray, mauve, and black curves), exhibiting global maxima when glutamatergic synapses are changed by half that of GABAergic synapses (green curve), but not when changed by one-third (maroon curve). Regimes I, II, and III for green curve denote gating, enhancement, and suppression of neural response with increasing NE. E = 0.128 for green and maroon curves.
We do not specifically model adrenoreceptors, merely the effective change in cellular or postsynaptic conductances, thus greatly reducing the computational cost of simulations. NE modulation of EPSPs is incorporated by changing the peak synaptic conductances of NMDA- or AMPA-mediated synapses. Inhibitory GABA-mediated synapses and membrane leak conductances are modulated similarly. The concentration of NE release depends approximately linearly on tonic LC firing rate (Berridge and Abercrombie, 1999) (for quantitative details, see supplemental Fig. 1, available at www.jneurosci.org as supplemental material), and in the absence of experimental evidence to the contrary, we also assume a linear relationship between NE level and the consequent conductance changes. Changes in the membrane leak conductance gL,i of cell i and the peak conductance gsyn,j of synapse j of cell i are modeled by multiplying by the factors γL,i and γsyn,j, respectively. These parameters enter the evolution equations for the subthreshold membrane potential, Vm,i, of the ith pyramidal cell or interneuron in the following form:
 |
(see supplemental material, available at www.jneurosci.org). Here Cm, ssyn, EL, and Esyn are the membrane capacitance, fraction of open channels due to presynaptic spikes, rest potential, and reversal potentials of ionotropic receptors, and j labels the jth presynaptic neuron.
The conductance factors γ are the major parameters varied in our tonic NE studies: γ = 1 indicates that the original parameters of Wang (2002) are retained; 1.1 means an increase in that conductance over standard by 10%, etc. All conductances can be changed independently, but we shall assume that NMDA- and AMPA-mediated synapses are identically modulated because they are both glutamatergic, and no experiment has yet distinguished separate modulatory effects (Berridge and Waterhouse, 2003).
Modeling phasic LC–NE modulation.
The temporal dynamics of phasic NE release in the cortex are not well characterized. Latency and variability of peak LC discharge and the types of adrenoreceptors involved are likewise uncertain, although LC responses can occur in trials with reaction times so short that much of them is occupied by motor response. For longer trials, there may be more time for NE to influence the decision network, but this is determined by unknown time scales spanning activation of adrenoreceptors to modulation of conductances.
In place of the spiking neuron models of Usher et al. (1999), Usher and Davelaar (2002), and Shea-Brown et al. (2004), we therefore adopt a simple linear model with three time scales: τg,delay combines delays from stimulus arrival in the microcircuit to LC peak firing and slow signal propagation along noradrenergic fibers, and τg,decay accounts for the postpeak decay in LC firing and for NE reuptake. Along with a factor ηsyn,j that scales the effect of NE level on gain change, analogous to γsyn,j in Equation 2, these prescribe a profile
 |
that synapse conductances would follow if they equilibrated instantaneously to NE levels (Fig. 3A). The actual conductance time course during phasic release, shown in Figure 3B, is described by a leaky integrator:
 |
(cf. Shea-Brown et al., 2005), in which the third time scale, τg,rise, determines the initial conductance rise due to NE release.
Various values of τg,delay were tried before settling on 200 ms. This accommodates noradrenergic fiber transmission from LC to cortex (60–80 ms) and is long enough to allow signal detection to induce an LC phasic response (Clayton et al., 2004) and yet short enough to ensure NE release before motor response (or, for long decision times, during the decision process itself). LC stimulation experiments suggest an increase in excitatory response in cortex within 200 ms (Waterhouse et al., 1998b), so we set τg,rise = 100 ms, which matches this when combined with the 60–80 ms noradrenergic fiber delay. Given that the network is reset following responses, we found single-trial behavior to be insensitive to the third time constant, τg,decay, which we set at 300 ms.
For phasic studies we reduce RSI + NDL to 1250 ms to steepen reward rate curves and better reveal maxima, and, since phasic LC discharge can produce higher cortical NE levels than tonic LC activity (Florin-Lechner et al., 1996), we explore a wider range than for tonic modulation.
Results
Tonic NE modulation can influence robustness of performance
To examine changes in simulated task performance with respect to tonic NE levels, we first modulate peak GABAA synaptic conductances alone, fixing all other parameters at the standard values and stimulus bias at E = 0.128. Pyramidal cells and interneurons are modulated separately.
When conductances from interneurons to pyramidal cells change by only 4%, performance degrades dramatically (Fig. 4, turquoise curves), by increases in the fraction of either no-choice trials (Fig. 4A, turquoise dotted curve) or impulsive trials (Fig. 4A, turquoise dashed curve). These poor performance modes reverse if self-inhibitory synapses of interneurons are modulated (Fig. 4A, orange dashed and dotted curves), but performance still deteriorates rapidly. The range of correct trials is severely limited and reward rates drop to zero outside the 1 ± 0.04 factor range (Fig. 4B–D, turquoise and orange curves). Such sensitivity is expected for a globally connected network, small changes in conductance being effectively multiplied by the total number of presynaptic connections (2000, for our model). Performance is more robust when GABAA synapses are simultaneously modulated in pyramidal cells and interneurons (Fig. 4, violet curves): reward rates drop by <20% for a factor change of 1.2 and optimal reward rates remain approximately constant (Fig. 4D). These results hold for all stimulus biases E (data not shown here; compare Fig. 6B). Independent modulation and comodulation of NMDA- and AMPA-mediated conductances and membrane leak conductances produce similar results, as shown in Figure 4E–G. Sample firing rates of selective cells in the three regimes are shown in Figure 5, in which, to illustrate asymptotic behavior, they have not been reset after crossing thresholds.
Figure 5.
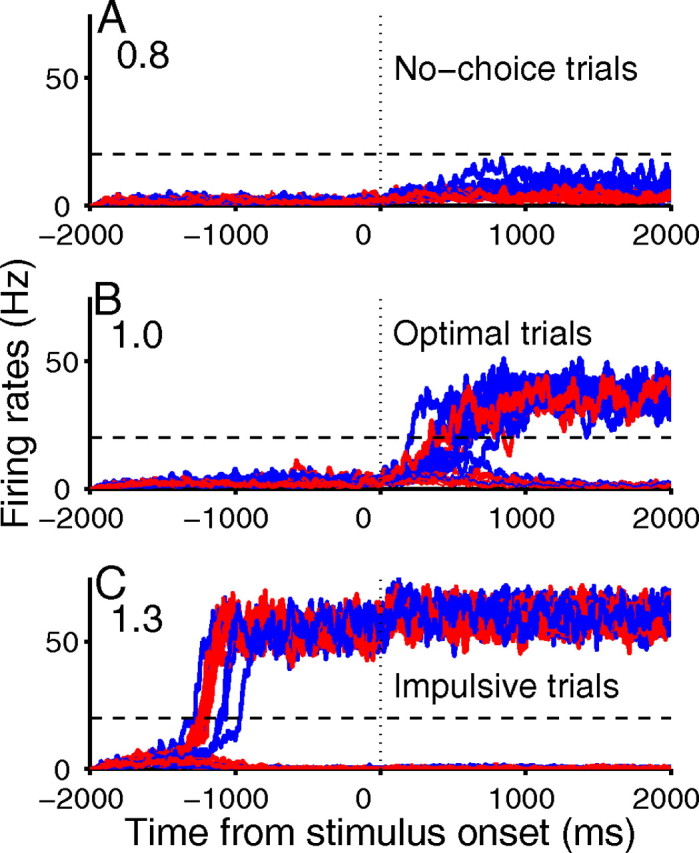
Firing rates of selective pyramidal populations exhibit three types of behavior. Weak (A), optimal (B), and overstrong (C) NMDA-mediated synapse strengths result in no-choice, optimal, and impulsive behaviors, respectively. Blue denotes correct trials and red, errors; dashed lines indicate decision thresholds, and numbers at top left show factor changes in peak conductances. Only NMDA-mediated synaptic conductances are modulated here, but modulation of other conductances yields similar behaviors.
Network performance can be understood by examining behaviors of individual populations. When their self-inhibitory synaptic weights are strengthened, interneurons self-suppress more than they suppress the pyramidal cells, resulting in impulsivity (see jumps across threshold in Fig. 5C, due to increased pyramidal activity). Increases in inhibitory synaptic strength to pyramidal cells have the opposite effect, suppressing the latter more than the interneurons, so that both selective populations are less likely to reach threshold. Performance might not degrade as fast if thresholds were changed for each case, but the imbalance has a strong effect. Under equal modulation there is an effective increase in excitation, since there are approximately three times as many excitatory as inhibitory cells.
Three phenomena emerge here. First, unless synapses within and across the cell populations are modulated concurrently, small changes in NE levels can significantly degrade performance. Second, the characteristic inverted-U in task performance as a function of LC firing rate follows from linear dependence of peak synaptic conductance on NE concentration. Third, optimal reward rates need not be sacrificed for robustness. Modulation of each conductance in a population of one cell type yields brittle performance, while simultaneous modulation of both produces robustness. Simultaneous modulation of all glutamatergic and GABAergic synapses yields similar results: with equally varying excitatory and inhibitory conductances (ΔγEΔγI = 1), performance is slightly more robust to decrease in conductances and substantially more so to conductance increases (Fig. 6A, black and violet curves). Figure 6B shows that the primary effect of stimulus bias on performance is to raise reward rates as the task becomes easier, with little effect on robustness (compare Fig. 2).
If glutamatergic- and GABAergic-mediated synapses are modulated by different adrenoreceptors (Waterhouse et al., 1982, 2000; Mouradian et al., 1991; Sessler et al., 1995; Berridge and Waterhouse, 2003), then excitatory and inhibitory synapses may not be equally affected by NE. Allowing differential changes, we find that robustness is further enhanced if glutamatergic synapses change less than GABAergic synapses, being greatest when ΔγEΔγI ≈ 1/2 and dropping again for ΔγEΔγI = 1/3, implying that an optimal ratio exists (Fig. 6A, compare green, brown, and black curves).
Transient and steady-state dynamics: single-unit and population responses
We next examine how different tonic NE levels affect the neural dynamics as all peak synaptic conductances for NMDA, AMPA, and GABAA are changed by a common factor. Figure 7A shows firing rates averaged over neurons in each of the four populations and over 500 simulated trials for the conductance factors 0.85, 1, 1.5, and 2.0 (top to bottom). Here neural activities were not reset to their spontaneous activities upon reaching the decision threshold, so that dynamical evolutions to steady states are revealed.
For the conductance factor 0.85, which simulates a low LC firing rate, there is little spontaneous prestimulus activity, and the selective populations ramp up slowly during stimulus presentation for both correct and error trials, suggesting unmotivated performance (Fig. 7A, blue and red curves in top panels). Error trials show lower activity on average than correct trials, resulting in longer decision times, and in many cases firing rates fail to reach threshold before stimulus cutoff. Impulsive trials are rare or nonexistent. In contrast, with NE levels exceeding standard by factors of 1.5 and 2, decisions are faster but accuracy suffers, approaching chance as impulsive trials prevail. Figure 7A shows that neural activities tend to split slightly before stimulus onset even in valid trials (not impulsive or no-choice), so that the decision depends largely on which population is winning at stimulus onset, determined by random fluctuations, rather than the stimulus itself.
Figure 7B illustrates how averaged single-cell responses vary with tonic NE level and stimulus bias. Equal increases in conductances of pyramidal cells and interneurons raise spike counts monotonically (black curve), and responses also increase with stimulus bias E, due to faster ramping (gray, mauve, and black curves). However, if pyramidal cell conductance changes are half those of interneurons, spike counts exhibit an inverted-U shape (green curve), while for ΔγEΔγI = 1/3, they decay almost monotonically (maroon curve). We recall that the ratio ΔγEΔγI = 1/2 also maximizes robustness (Fig. 6A).
This nonlinear inverted-U response is obtained with simple linear relations between LC firing activity, NE concentration, and peak synaptic conductances. Hence, unlike Hoshino (2005), we suggest that the diverse neuronal responses observed in experiments such as that of Devilbiss and Waterhouse (2004) may be due solely to network effects. Specifically, our model predicts that, when local networks have high affinity for NE, applying more NE should reduce the signal-to-noise ratio as in region III of Figure 7B (green). In contrast, if network NE affinity is moderate, NE can enhance signal-to-noise as in region II. If NE affinity is sufficiently low and application of NE high, we expect transitions from regime I to regimes II or III, as exhibited by gating neurons. Thus, for ΔγEΔγI ≈ 1/2, our predictions agree with physiological results of Hasselmo et al. (1997) and Moxon et al. (2007), although those works concern cortical areas that encode sensory stimuli rather than signal integration and decision making. Our model parameters are tuned to capture decision making and working memory rather than sensory encoding. Further work with a sensory-encoding network model similar to that of Hasselmo et al. (1997) would be required for better comparison with experimental data.
Phasic LC–NE modulation affects neuronal dynamics and can further enhance performance
As noted above, phasic NE and conductance dynamics are poorly characterized. In particular, since receptors that modulate GABAergic and glutamatergic synapses could have different activation rates and/or affinities for NE, it is important to test whether such variations can significantly affect performance. In the absence of quantitative affinity and timing information, we first examine modulation of glutamatergic synapses alone, corresponding to either a relatively higher affinity or faster activation of adrenoreceptors that modulate glutamatergic synapses than those modulating GABAergic synapses. We also employ a wider range of peak [NE], since Florin-Lechner et al. (1996) show that phasic LC discharge could release significantly more extracellular NE than the same tonic discharge rate. However, that study uses in vivo microdialysis, which has low temporal resolution.
Figure 8 illustrates the effects on population firing rates. Interestingly, during phasic modulation the activity of interneurons increases transiently (by ∼3.5 for a factor change of 1.8), thus allowing more rapid winner-take-all behavior and hence faster decisions as selective neural activities (blue) cross threshold. However, since conductances decay (Fig. 3B), the longer time asymptotic dynamics remain similar (compare neural activities 1500–2000 ms after stimulus onset).
Figure 8.
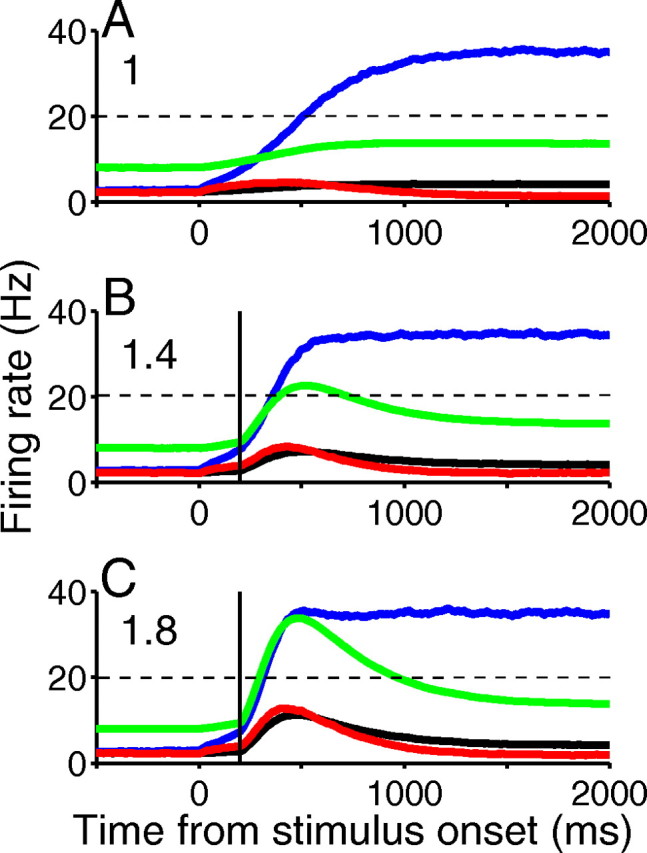
Neural dynamics under phasic LC activity. Trial- and population-averaged firing rates of the four neural populations, for rewarded trials, with different phasic LC discharge magnitudes. As in Figure 7A, firing rates are not reset to spontaneous states after reaching 20 Hz decision threshold (dashed black lines). A, Standard parameters (ηsyn,j = 1). B, Modulation of only glutamatergic synaptic conductances with a peak factor of ηsyn,j = 1.4. C, As in B, but with ηsyn,j = 1.8. Shown are correct selective population (blue), incorrect selective population (red), nonselective population (black), and inhibitory interneurons (green); vertical black lines denote start of NE release in cortex. Stimulus bias E = 0.128.
In terms of network behavior, Figure 9, A and B, show that accuracy and mean trial durations decrease with NE level, the latter falling rapidly toward the RSI plus LC delay. Decrease in trial time initially dominates the drop in accuracy, and reward rates increase; they subsequently fluctuate and can even drop as accuracy continues to decrease (Fig. 9C). Since RSI contributes to the trial duration, it can alter this: small RSIs emphasize the influence of decreased decision times, so that reward rates can remain nearly constant, but it is clear that phasic modulation of only glutamatergic synapses can improve reward rates, especially for more difficult tasks. In contrast, Figure 9D shows that phasic NE release is no longer beneficial when glutamatergic and GABAergic synapses are equally modulated, with other parameters as before.
Figure 9.

Effects of phasic LC discharge on performance. A, B, Only glutamatergic synapses are modulated. A, Accuracy decreases as [NE] increases, due to faster dynamics. B, Mean total trial durations (DT + NDL + RSI) decrease as [NE] increases. C, Phasic modulation improves reward rate more effectively when task is difficult and only glutamatergic synapses change (E = 0.064, red curve). Speed initially dominates accuracy and reward rate increases, followed by fluctuations (see Results, Phasic LC-NE modulation affects neuronal dynamics and can further enhance performance). D, When both glutamatergic and GABAergic synapses are changed, reward rates drop slightly from tonic level (NE factor 1, leftmost points). RSI = 1250 ms in B–D. Stimulus biases E = 0.128 and E = 0.064 are shown in black and red; dotted lines denote highest mean reward rates under tonic LC–NE modulation. Factor changes in peak [NE] are higher than in tonic case (see Results, Phasic LC-NE modulation affects neuronal dynamics and can further enhance performance).
Tonic NE affects accuracy and working memory in cued response tasks
Finally we briefly address the cued response protocol: a hard limit of deadlined responding in which stimuli are displayed for a fixed period, after which the subject must respond either immediately or following a delay (Shadlen and Newsome, 2001; Roitman and Shadlen, 2002). Delayed responses invoke working memory, requiring sustained neural activity in the absence of stimuli. The present network with standard (optimal) parameters, in particular strong recurrent excitation, exhibits sustained activity characteristic of working memory (Wang, 2002; Wong and Wang, 2006), which could be returned to baseline by additional inhibitory inputs (Lo and Wang, 2006), or by reduced NE levels.
Figure 10A shows firing rates throughout the prestimulus, stimulus presentation, and delay periods. For low tonic LC activity (Fig. 10A, top), accuracy is significantly better when subjects respond directly after stimulus offset than 1000 ms later, but most decisions are slow and poststimulus activity is not sustained, as in unmotivated behavior. When tonic LC activity is higher (Fig. 10A, center, with standard parameters), the network can integrate and sustain memory during the delay period, while for very high tonic LC activity (Fig. 10A, bottom), neural activities split before stimulus onset, promoting storage of impulsive decisions, so that accuracy is poor for both immediate and delayed responses.
Figure 10.

Accuracy and neural dynamics with cued responses. A, With increasing tonic NE levels (top to bottom), the network passes through different functional states: from lack of integration and sustained memory, to an integrator with memory, to an impulsive integrator with memory of poor decisions. Vertical black dotted lines denote onset and offset of stimulus. Horizontal dashed black lines show decision thresholds. Color codes are as in Figure 8. B, Black, All peak synaptic conductances are modulated equally. Green, Only NMDA-mediated synapses are modulated. Accuracy is obtained by interrogation either immediately after stimulus offset (solid curves, 1000 ms) or after an additional 1000 ms delay to test working memory-aided decisions (dashed curves). Memory-aided decisions are significantly less accurate under low tonic LC activity, an effect increased when only NMDA-mediated synapses are modulated.
Previous work has revealed the importance of NMDA-mediated recurrent synapses for integration and working memory (Wang, 1999, 2002; Brunel and Wang, 2001; Wong and Wang, 2006), so we also tried changing NMDA peak synaptic conductances alone. The dashed curves in Figure 10B show that the model's performance deteriorates more dramatically in this case.
Discussion
Inverted-U modulation of decision performance
The neural network developed here reproduces the observed inverted-U curve of behavioral performance (Yerkes and Dodson, 1908) under different levels of LC–NE modulation (Usher et al., 1999; Aston-Jones and Cohen, 2005). It exhibits unmotivated behavior and fading memory at low tonic NE levels, and impulsive response and poor accuracy at high NE levels. The latter may be related to breaking of fixation and saccades during the prestimulus period observed in monkeys [cf. Roitman and Shadlen (2002) and Ditterich (2006), his Fig. 8b]. A robust range of near-optimal reward rates exists at intermediate tonic NE levels.
Our model shows that phasic LC activity can further improve performance, if only glutamatergic synapses are affected. Equal excitatory and inhibitory modulation does not improve reward rates, in contrast to multilayer connectionist models (Usher and Davelaar, 2002). We therefore predict that, if the phasic LC mode is to improve performance over its tonic mode (as found in experiments on behaving animals), then phasic modulation of excitation must dominate changes in inhibition. This can be achieved either by a relatively higher NE affinity or faster activation of adrenoreceptors associated with excitation. Relative activation dynamics and NE affinities of α1 and β adrenoreceptors, which may be responsible for phasic NE modulation of glutamatergic and GABAergic synapses, respectively, could be compared to test this prediction.
The inverted-U performance curve should be differentiated from the inverted-U effect of output signal-to-noise ratio (evoked vs spontaneous neural activity) in sensory cortical and thalamic areas that has been exhaustively investigated in experiments and computational studies. We implicitly include modulation of stimulus input by modulating AMPA-mediated synapses from incoming stimuli to a decision network, but do not explicitly model NE effects on upstream processing areas. Nor do we investigate the effects of modulating input synapses alone, thereby changing input signal-to-noise ratios. This would primarily influence inputs to the selective populations, thus adjusting reward rates correspondingly (compare Figs. 2, 6B, 7B, 9).
Implications of robust decision performance
The brain is noisy in many aspects and on many levels (Faisal et al., 2008). Probabilistic behavior, as in the present model, can arise due to fluctuations in synaptic conductances (e.g., synaptic noise outside the local microcircuit) and noisy external stimuli. Our all-to-all connected network is especially sensitive: modest increases or decreases in recurrent excitatory synaptic strengths can cause impulsive choices or indecisiveness, respectively (Fig. 4). Small heterogeneities or synaptic plasticity can therefore be disastrous for performance.
Our study is the first to show how NE modulation can tune behavioral performance without sacrificing robustness. Specifically, when excitatory and inhibitory cells are modulated simultaneously, the model maintains high reward rates over a wide range of synaptic conductances (Fig. 4). Furthermore, for fixed decision thresholds, increased robustness does not reduce optimal performance levels. To our knowledge, no experiments have investigated NE effects on interneurons in the parietal cortex, although there is evidence for modulation of interneurons in other brain areas [e.g., frontal cortex (Kawaguchi and Shindou, 1998)], but we predict that, if tonic NE modulation is to play an important role in network behaviors such as robust decision making, interneurons and pyramidal cells should be comodulated.
Glutamatergic and GABAergic synapses in pyramidal cells and interneurons may not be equally modulated by NE. Our differential modulation studies reveal that robustness is greatest when excitatory conductances change by approximately half as much as inhibitory ones (Fig. 6). This may be due to the predominance of excitatory cells in the model: greater increases in inhibition could imply more balanced tuning of overall excitatory and inhibitory synaptic currents. This may help the network maintain robustness against heterogeneities, and is consistent with in vivo studies of gain modulation, in which excitatory and inhibitory synaptic conductances are found to be modulated proportionally (e.g., Haider et al., 2006).
Switching, resetting, and heterogeneity of neural circuits
Robustness is necessary to reject small perturbations in neuromodulator levels, but behavior must also respond to meaningful concentration changes. In this regard, our network permits unmotivated, optimal, and impulsive behaviors, allowing NE levels to switch it among different functional modes. Specifically, changes in the network's multiple steady states (Wong and Wang, 2006; Wong et al., 2007) as NE level increases allow adaptation to different behavioral requirements. It can move from a single spontaneous state, to bistable states characteristic of working memory, to decision making, and ultimately to impulsive, inaccurate, but potentially exploratory choices. These transitions in neural activities and network performance are most clearly seen in the cued response protocol of Figure 10. They differ from the connectionist model of Usher and Davelaar (2002), in which it was shown, under a different experimental protocol, that low (high) tonic LC–NE activity is good (bad) for working memory.
Interestingly, we did not obtain inverted-U behavior in working memory as observed in the literature (e.g., Arnsten, 2007). Instead, sustained activities increase monotonically with increasing tonic NE, mainly due to the fact that our model includes only one adrenoceptor type associated with either excitatory (α1) or inhibitory (β) conductances. Other adrenoreceptors certainly exist. For example, working memory in prefrontal cortex is enhanced by α2A but suppressed by α1 and β1 receptors (Ramos and Arnsten, 2007), while posterior cortical systems are enhanced. Multiple receptor types could greatly diversify the switching and resetting of cortical functions.
The fact that the LC–NE system can trigger varied cellular and network functional modes may have deeper implications. If different microcircuits contain diverse adrenoreceptors or cell types and some have lower affinity for NE than others (Arnsten, 2007), the former would be inhibited at low LC activity, while decisions are made and memories stored in other microcircuits. Higher LC rates would activate previously dormant microcircuits while other, formerly active ones could be silenced. The network of Wang (2002) exhibits such behavior, consistent with network resetting by neuromodulators as conjectured by Marder and Thirumalai (2002) and Bouret and Sara (2005).
The ability to appropriately change network settings is important in the behavioral context of exploitation versus exploration (Aston-Jones and Cohen, 2005). Exploitation would occur when a task with “old rules” is repeatedly performed well with intermediate tonic NE or in the phasic LC mode. The present network with high tonic NE, coupled with a learning algorithm [e.g., Soltani and Wang (2006) and Fusi et al. (2007)], may be able to explore new behavioral states by making more impulsive errors under the old rules; reward schedules could then reshape it to adapt to new rules. The effects of high tonic LC on exploration are examined by Aston-Jones et al. (1997) and McClure et al. (2005).
At the cellular level, stimulus-evoked responses display a range of behaviors at different tonic NE levels (e.g., Devilbiss and Waterhouse, 2004), which may be due to cellular or network effects or to both. Our model can exhibit nonmonotonic single-cell responses such as gating and inverted-U behaviors. It was not specifically tuned to achieve these results, and they are by no means obvious, since we assume linear dependence of conductance on NE level. These results suggest that nonlinear variation of stimulus-evoked cellular responses with NE can arise from network effects alone.
Summary and future work
We have drawn on recent in vitro and in vivo data on LC–NE modulation to model and analyze the effects of tonic and phasic NE release on a cortical microcircuit, through modulation of individual neural populations and synapse types. Our study illustrates the importance of including biophysical details, suggests possible bridges to more abstract optimality studies [e.g., Bogacz et al. (2006) and Bogacz (2007)], and identifies crucial experimental data that are currently lacking. Since we model a generic cortical microcircuit, modulated only at the synaptic level, our methods may generalize to other types of neuromodulators and cognitive tasks.
Although we neglect heterogeneities, our cortical microcircuit is relatively detailed. However, the LC–NE system is represented simply by proportional modulation of synaptic conductances in the tonic mode and by a stereotypical impulse response in the phasic mode. In both cases, the mapping from LC firing rates to NE release is linear, and phasic mechanisms are assumed to act and reset within a single trial. We also neglected the suppression of LC firing that follows enhancement in some experiments (Clayton et al., 2004). More detailed descriptions of population dynamics such as conductance-based integrate-and-fire models (Destexhe, 1997; Usher et al., 1999) or phase-reduced models (Shea-Brown et al., 2004) are needed to capture this phenomenon and to include longer-term effects, such as the slow dynamics of calcium currents and molecular cascades activated by adrenoreceptors. Across-trial sequential effects and learning may also involve long-term potentiation by NE modulation (Berridge and Waterhouse, 2003; Bouret and Sara, 2005), but despite some studies of learning in decision networks (Simen et al., 2006; Soltani and Wang, 2006; Fusi et al., 2007; Eckhoff et al., 2008), mechanistic biophysical modeling of how LC–NE system affects them is still lacking.
We have considered only a single cortical microcircuit, but decision making may be distributed over several brain regions, including the posterior parietal area, frontal eye fields, superior colliculus, and dorsolateral prefrontal and secondary somatosensory cortices (Gold and Shadlen, 2007). Further electrophysiological data from such areas under NE modulation could substantially improve understanding. It would be interesting to learn how the LC–NE system affects not only macroscopic behaviors, but also their multiple neural correlates.
Footnotes
P.E. was supported by the Fannie and John Hertz Foundation and National Science Foundation, and K.F.W.-L. and P.H. by Public Health Service Grants MH 58480 and 62196 and Air Force Office of Scientific Research Grant FA9550-07-1-0537. The United States government is authorized to reproduce and distribute reprints for governmental purposes notwithstanding any copyright notation thereon. The views and conclusions contained herein are those of the authors and should not be interpreted as necessarily representing the official policies or endorsements, either expressed or implied, of the Air Force Research Laboratory or the United States government. We thank Barry D. Waterhouse, Jonathan D. Cohen, and the anonymous referees for insightful comments.
References
- Arnsten AFT. Norepinephrine and cognitive disorders. In: Ordway GA, Schwartz MA, Frazer A, editors. Brain norepinephrine: neurobiology and therapeutics. Cambridge, UK: Cambridge UP; 2007. pp. 408–435. [Google Scholar]
- Aston-Jones G. Brain structures and receptors involved in alertness. Sleep Med. 2005;6(Supp 1):S3–S7. doi: 10.1016/s1389-9457(05)80002-4. [DOI] [PubMed] [Google Scholar]
- Aston-Jones G, Cohen JD. An integrative theory of locus coeruleus-norepinephrine function: Adaptive gain and optimal performance. Annu Rev Neurosci. 2005;28:403–450. doi: 10.1146/annurev.neuro.28.061604.135709. [DOI] [PubMed] [Google Scholar]
- Aston-Jones G, Shipley MT, Chouvet G, Ennis M, van Bockstaele E, Pieribone V, Shiekhattar R, Akaoka H, Drolet G, Astier B, Charlety P, Valentino R, Williams JT. Afferent regulation of locus coeruleus neurons: anatomy, physiology and pharmacology. Prog Brain Res. 1991;88:47–75. doi: 10.1016/s0079-6123(08)63799-1. [DOI] [PubMed] [Google Scholar]
- Aston-Jones G, Rajkowski J, Kubiak P, Alexinsky T. Locus coeruleus neurons in monkey are selectively activated by attended cues in a vigilance task. J Neurosci. 1994;14:4467–4480. doi: 10.1523/JNEUROSCI.14-07-04467.1994. [DOI] [PMC free article] [PubMed] [Google Scholar]
- Aston-Jones G, Rajkowski J, Kubiak P. Conditioned responses of monkey locus coeruleus neurons anticipate acquisition of discriminative behavior in a vigilance task. Neuroscience. 1997;80:697–715. doi: 10.1016/s0306-4522(97)00060-2. [DOI] [PubMed] [Google Scholar]
- Aston-Jones G, Iba M, Clayton E, Rajkowski J. The locus coeruleus and regulation of behavioral flexibility and attention: clinical implications. In: Ordway GA, Schwartz MA, Frazer A, editors. Brain norepinephrine: neurobiology and therapeutics. Cambridge, UK: Cambridge UP; 2007. pp. 196–235. [Google Scholar]
- Berridge CW. Noradrenergic modulation of arousal. Brain Res Rev. 2008;58:1–17. doi: 10.1016/j.brainresrev.2007.10.013. [DOI] [PMC free article] [PubMed] [Google Scholar]
- Berridge CW, Abercrombie ED. Relationship between locus coeruleus discharge rates and rates of norepinephrine release within neocortex as assessed by in vivo microdialysis. Neuroscience. 1999;93:1263–1270. doi: 10.1016/s0306-4522(99)00276-6. [DOI] [PubMed] [Google Scholar]
- Berridge CW, Waterhouse BD. The locus coeruleus-noradrenergic system: modulation of behavioral state and state-dependent cognitive processes. Brain Res Rev. 2003;42:33–84. doi: 10.1016/s0165-0173(03)00143-7. [DOI] [PubMed] [Google Scholar]
- Bogacz R. Optimal decision-making theories: linking neurobiology with behavior. Trends Cogn Sci. 2007;11:118–125. doi: 10.1016/j.tics.2006.12.006. [DOI] [PubMed] [Google Scholar]
- Bogacz R, Brown E, Moehlis J, Holmes P, Cohen JD. The physics of optimal decision making: a formal analysis of models of performance in two alternative forced choice tasks. Psychol Rev. 2006;113:700–765. doi: 10.1037/0033-295X.113.4.700. [DOI] [PubMed] [Google Scholar]
- Bouret S, Sara SJ. Network reset: a simplified overarching theory of locus coeruleus noradrenaline function. Trends Neurosci. 2005;28:574–582. doi: 10.1016/j.tins.2005.09.002. [DOI] [PubMed] [Google Scholar]
- Britten KH, Shadlen MN, Newsome WT, Movshon JA. Response of neurons in macaque MT to stochastic motion signals. Vis Neurosci. 1993;10:1157–1169. doi: 10.1017/s0952523800010269. [DOI] [PubMed] [Google Scholar]
- Brunel N, Wang XJ. Effects of neuromodulation in a cortical network model of object working memory dominated by recurrent inhibition. J Comput Neurosci. 2001;11:63–85. doi: 10.1023/a:1011204814320. [DOI] [PubMed] [Google Scholar]
- Clayton EC, Rajkowski J, Cohen JD, Aston-Jones G. Phasic activation of monkey locus ceruleus neurons by simple decisions in a forced-choice task. J Neurosci. 2004;24:9914–9920. doi: 10.1523/JNEUROSCI.2446-04.2004. [DOI] [PMC free article] [PubMed] [Google Scholar]
- Dayan P, Yu AJ. Phasic norepinephrine: a neural interrupt signal for unexpected events. Network. 2006;17:335–350. doi: 10.1080/09548980601004024. [DOI] [PubMed] [Google Scholar]
- Destexhe A. Conductance-based integrate-and-fire models. Neural Comput. 1997;9:503–514. doi: 10.1162/neco.1997.9.3.503. [DOI] [PubMed] [Google Scholar]
- Devilbiss DM, Waterhouse BD. Norepinephrine exhibits two distinct profiles of action on sensory cortical neuron responses to excitatory synaptic stimuli. Synapse. 2000;37:273–282. doi: 10.1002/1098-2396(20000915)37:4<273::AID-SYN4>3.0.CO;2-#. [DOI] [PubMed] [Google Scholar]
- Devilbiss DM, Waterhouse BD. The effects of tonic locus ceruleus output on sensory-evoked responses of ventral posterior medial thalamic and barrel field cortical neurons in the awake rat. J Neurosci. 2004;24:10773–10785. doi: 10.1523/JNEUROSCI.1573-04.2004. [DOI] [PMC free article] [PubMed] [Google Scholar]
- Devilbiss DM, Page ME, Waterhouse BD. Locus ceruleus regulates sensory encoding by neurons and networks in waking animals. J Neurosci. 2006;26:9860–9872. doi: 10.1523/JNEUROSCI.1776-06.2006. [DOI] [PMC free article] [PubMed] [Google Scholar]
- Ditterich J. Evidence for time-variant decision making. Eur J Neurosci. 2006;24:3628–3641. doi: 10.1111/j.1460-9568.2006.05221.x. [DOI] [PubMed] [Google Scholar]
- Doya K. Modulators of decision making. Nat Neurosci. 2008;11:410–416. doi: 10.1038/nn2077. [DOI] [PubMed] [Google Scholar]
- Eckhoff P, Holmes P, Law C, Connolly PM, Gold JI. On diffusion processes with variable drift rates as models for decision making during learning. New J Phys. 2008;10 doi: 10.1088/1367-2630/10/1/015006. nihpa49499. [DOI] [PMC free article] [PubMed] [Google Scholar]
- Faisal AA, Selen LPJ, Wolpert DM. Noise in the nervous system. Nat Rev Neurosci. 2008;9:292–303. doi: 10.1038/nrn2258. [DOI] [PMC free article] [PubMed] [Google Scholar]
- Florin-Lechner SM, Druhan JP, Aston-Jones G, Valentino RJ. Enhanced norepinephrine release in prefrontal cortex with burst stimulation of the locus coeruleus. Brain Res. 1996;742:89–97. doi: 10.1016/s0006-8993(96)00967-5. [DOI] [PubMed] [Google Scholar]
- Foehring RC, Schwindt PC, Crill WE. Norepinephrine selectively reduces slow Ca2+- and Na+-mediated K+ currents in cat neocortical neurons. J Neurophysiol. 1989;61:245–256. doi: 10.1152/jn.1989.61.2.245. [DOI] [PubMed] [Google Scholar]
- Fusi S, Asaad WF, Miller EK, Wang XJ. A neural circuit model of flexible sensorimotor mapping: learning and forgetting on multiple timescales. Neuron. 2007;54:319–333. doi: 10.1016/j.neuron.2007.03.017. [DOI] [PMC free article] [PubMed] [Google Scholar]
- Gold JI, Shadlen MN. The neural basis of decision making. Annu Rev Neurosci. 2007;30:535–574. doi: 10.1146/annurev.neuro.29.051605.113038. [DOI] [PubMed] [Google Scholar]
- Haider B, Duque A, Hasenstaub AR, McCormick DA. Neocortical network activity in vivo is generated through a dynamic balance of excitation and inhibition. J Neurosci. 2006;26:4535–4545. doi: 10.1523/JNEUROSCI.5297-05.2006. [DOI] [PMC free article] [PubMed] [Google Scholar]
- Hasselmo ME, Linster C, Patil M, Ma D, Cekic M. Noradrenergic suppression of synaptic transmission may influence cortical signal-to-noise ratio. J Neurophysiol. 1997;77:3326–3339. doi: 10.1152/jn.1997.77.6.3326. [DOI] [PubMed] [Google Scholar]
- Hoshino O. Cognitive enhancement mediated through postsynaptic actions of norepinephrine on ongoing cortical activity. Neural Comput. 2005;17:1739–1775. doi: 10.1162/0899766054026675. [DOI] [PubMed] [Google Scholar]
- Kawaguchi Y, Shindou T. Noradrenergic excitation and inhibition of GABAergic cell types in rat frontal cortex. J Neurosci. 1998;18:6963–6976. doi: 10.1523/JNEUROSCI.18-17-06963.1998. [DOI] [PMC free article] [PubMed] [Google Scholar]
- Lo CC, Wang XJ. Cortico-basal ganglia circuit mechanism for a decision threshold in reaction time tasks. Nat Neurosci. 2006;9:956–963. doi: 10.1038/nn1722. [DOI] [PubMed] [Google Scholar]
- Marder E, Thirumalai V. Cellular, synaptic and network effects of neuromodulation. Neural Netw. 2002;15:479–493. doi: 10.1016/s0893-6080(02)00043-6. [DOI] [PubMed] [Google Scholar]
- McClure SM, Gilzenrat MS, Cohen JD. An exploration-exploitation model based on norepinephrine and dopamine activity. In: Weiss Y, Schölkopf B, Platt J, editors. Advances in neural information processing systems. Vol 18. Cambridge, MA: MIT; 2005. pp. 867–874. [Google Scholar]
- McCormick DA, Pape HC. Noradrenergic and serotonergic modulation of a hyperpolarization-activated cation current in thalamic relay neurones. J Physiol. 1990;431:319–342. doi: 10.1113/jphysiol.1990.sp018332. [DOI] [PMC free article] [PubMed] [Google Scholar]
- Morrison JH, Foote SL. Noradrenergic and serotonergic innervation of cortical, thalamic and tectal visual structures in old and new world monkeys. J Comp Neurol. 1986;243:117–138. doi: 10.1002/cne.902430110. [DOI] [PubMed] [Google Scholar]
- Mouradian RD, Sessler FM, Waterhouse BD. Noradrenergic potentiation of excitatory transmitter action in cerebrocortical slices: evidence for mediation by an alpha 1 receptor-linked second messenger pathway. Brain Res. 1991;546:83–95. doi: 10.1016/0006-8993(91)91162-t. [DOI] [PubMed] [Google Scholar]
- Moxon KA, Devilbiss DM, Chapin JK, Waterhouse BD. Influence of norepinephrine on somatosensory neuronal responses in the rat thalamus: a combined modeling and in vivo multi-channel, multi-neuron recording study. Brain Res. 2007;1147:105–123. doi: 10.1016/j.brainres.2007.02.006. [DOI] [PMC free article] [PubMed] [Google Scholar]
- Rajkowski J, Kubiak P, Aston-Jones G. Locus coeruleus activity in monkey: phasic and tonic changes are associated with altered vigilance. Brain Res Bull. 1994;35:607–616. doi: 10.1016/0361-9230(94)90175-9. [DOI] [PubMed] [Google Scholar]
- Rajkowski J, Majczynski H, Clayton E, Aston-Jones G. Activation of monkey locus coeruleus neurons varies with difficulty and performance in a target detection task. J Neurophysiol. 2004;92:361–371. doi: 10.1152/jn.00673.2003. [DOI] [PubMed] [Google Scholar]
- Ramos BP, Arnsten AFT. Adrenergic pharmacology and cognition: focus on the prefrontal cortex. Pharmacol Ther. 2007;113:523–536. doi: 10.1016/j.pharmthera.2006.11.006. [DOI] [PMC free article] [PubMed] [Google Scholar]
- Roitman JD, Shadlen MN. Response of neurons in the lateral intraparietal area during a combined visual discrimination reaction time task. J Neurosci. 2002;22:9475–9489. doi: 10.1523/JNEUROSCI.22-21-09475.2002. [DOI] [PMC free article] [PubMed] [Google Scholar]
- Servan-Schreiber D, Printz H, Cohen JD. A network model of catecholamine effects: gain, signal-to-noise ratio, and behavior. Science. 1990;249:892–895. doi: 10.1126/science.2392679. [DOI] [PubMed] [Google Scholar]
- Sessler FM, Liu W, Kirifides ML, Mouradian RD, Lin RC, Waterhouse BD. Noradrenergic enhancement of GABA-induced input resistance changes in layer V regular spiking pyramidal neurons of rat somatosensory cortex. Brain Res. 1995;675:171–182. doi: 10.1016/0006-8993(95)00060-4. [DOI] [PubMed] [Google Scholar]
- Shadlen MN, Newsome WT. Neural basis of a perceptual decision in the parietal cortex (area LIP) of the rhesus monkey. J Neurophysiology. 2001;86:1916–1936. doi: 10.1152/jn.2001.86.4.1916. [DOI] [PubMed] [Google Scholar]
- Shea-Brown E, Moehlis J, Holmes P, Clayton E, Rajkowski J, Aston-Jones G. The influence of spike rate and stimulus duration on noradrenergic neurons. J Comput Neurosci. 2004;17:13–29. doi: 10.1023/B:JCNS.0000023867.25863.a4. [DOI] [PubMed] [Google Scholar]
- Shea-Brown E, Gao J, Holmes P, Bogacz R, Gilzenrat M, Cohen JD. Simple neural networks that optimize decisions. Int J Bifurcat Chaos. 2005;15:803–826. [Google Scholar]
- Shea-Brown E, Gilzenrat MS, Cohen JD. Optimization of decision making in multilayer networks: the role of locus coeruleus. Neural Comput. 2008;20:2863–2894. doi: 10.1162/neco.2008.03-07-487. [DOI] [PubMed] [Google Scholar]
- Simen P, Cohen JD, Holmes P. Rapid decision threshold modulation by reward rate in a neural network. Neural Netw. 2006;19:1013–1026. doi: 10.1016/j.neunet.2006.05.038. [DOI] [PMC free article] [PubMed] [Google Scholar]
- Simpson KL, Lin RCS. Neuroanatomical and chemical organization of the locus coeruleus. In: Ordway GA, Schwartz MA, Frazer A, editors. Brain norepinephrine: neurobiology and therapeutics. Cambridge, UK: Cambridge UP; 2007. pp. 9–52. [Google Scholar]
- Soltani A, Wang XJ. A biophysically based neural model of matching law behavior: melioration by stochastic synapses. J Neurosci. 2006;26:3731–3744. doi: 10.1523/JNEUROSCI.5159-05.2006. [DOI] [PMC free article] [PubMed] [Google Scholar]
- Usher M, Davelaar EJ. Neuromodulation of decision and response selection. Neural Netw. 2002;15:635–645. doi: 10.1016/s0893-6080(02)00054-0. [DOI] [PubMed] [Google Scholar]
- Usher M, Cohen JD, Servan-Schreiber D, Rajkowski J, Aston-Jones G. The role of locus coeruleus in the regulation of cognitive performance. Science. 1999;283:549–554. doi: 10.1126/science.283.5401.549. [DOI] [PubMed] [Google Scholar]
- Valentino RJ, Foote SL, Page ME. The locus coeruleus as a site for integrating corticotropin-releasing factor and noradrenergic mediation of stress responses. Ann N Y Acad Sci. 1993;697:173–188. doi: 10.1111/j.1749-6632.1993.tb49931.x. [DOI] [PubMed] [Google Scholar]
- Wang XJ. Synaptic basis of cortical persistent activity: the importance of NMDA receptors to working memory. J Neurosci. 1999;19:9587–9603. doi: 10.1523/JNEUROSCI.19-21-09587.1999. [DOI] [PMC free article] [PubMed] [Google Scholar]
- Wang XJ. Probabilistic decision making by slow reverberation in cortical circuits. Neuron. 2002;36:955–968. doi: 10.1016/s0896-6273(02)01092-9. [DOI] [PubMed] [Google Scholar]
- Waterhouse BD, Moises HC, Yeh HH, Woodward DJ. Norepinephrine enhancement of inhibitory synaptic mechanisms in cerebellum and cerebral cortex: mediation by beta adrenergic receptors. J Pharmacol Exp Ther. 1982;221:495–506. [PubMed] [Google Scholar]
- Waterhouse BD, Sessler FM, Cheng JT, Woodward DJ, Azizi SA, Moises HC. New evidence for a gating action of norepinephrine in central neuronal circuits of mammalian brain. Brain Res Bull. 1988;21:425–432. doi: 10.1016/0361-9230(88)90154-2. [DOI] [PubMed] [Google Scholar]
- Waterhouse BD, Azizi SA, Burne RA, Woodward DJ. Modulation of rat cortical area 17 neuronal responses to moving visual stimuli during norepinephrine and serotonin microiontophoresis. Brain Res. 1990;514:276–292. doi: 10.1016/0006-8993(90)91422-d. [DOI] [PubMed] [Google Scholar]
- Waterhouse BD, Devilbiss D, Fleischer D, Sessler FM, Simpson KL. New perspectives on the functional organization and postsynaptic influences of the locus ceruleus efferent projection system. Adv Pharmacol. 1998a;42:749–754. doi: 10.1016/s1054-3589(08)60856-x. [DOI] [PubMed] [Google Scholar]
- Waterhouse BD, Moises HC, Woodward DJ. Phasic activation of the locus coeruleus enhances responses of primary sensory cortical neurons to peripheral receptive field stimulation. Brain Res. 1998b;790:33–44. doi: 10.1016/s0006-8993(98)00117-6. [DOI] [PubMed] [Google Scholar]
- Waterhouse BD, Mouradian R, Sessler FM, Lin RC. Differential modulatory effects of norepinephrine on synaptically driven responses of layer V barrel field cortical neurons. Brain Res. 2000;868:39–47. doi: 10.1016/s0006-8993(00)02261-7. [DOI] [PubMed] [Google Scholar]
- Wong KF, Wang XJ. A recurrent network mechanism of time integration in perceptual decisions. J Neurosci. 2006;26:1314–1328. doi: 10.1523/JNEUROSCI.3733-05.2006. [DOI] [PMC free article] [PubMed] [Google Scholar]
- Wong KF, Huk AC, Shadlen MN, Wang XJ. Neural circuit dynamics underlying accumulation of time-varying evidence during perceptual decision-making. Front Comput Neurosci. 2007;1:6. doi: 10.3389/neuro.10.006.2007. [DOI] [PMC free article] [PubMed] [Google Scholar]
- Yerkes RM, Dodson JD. The relation of strength of stimulus to rapidity of habit-formation. J Comp Neurol Psychol. 1908;18:459–482. [Google Scholar]
- Yu AJ, Dayan P. Uncertainty, neuromodulation, and attention. Neuron. 2005;46:681–692. doi: 10.1016/j.neuron.2005.04.026. [DOI] [PubMed] [Google Scholar]