

Abstract
Neuropeptide Y (NPY) is an abundant neuropeptide of the neocortex involved in numerous physiological and pathological processes. Because of the large electrophysiological, molecular, and morphological diversity of NPY-expressing neurons their precise identity remains unclear. To define distinct populations of NPY neurons we characterized, in acute slices of rat barrel cortex, 200 cortical neurons of layers I–IV by means of whole-cell patch-clamp recordings, biocytin labeling, and single-cell reverse transcriptase-PCR designed to probe for the expression of well established molecular markers for cortical neurons. To classify reliably cortical NPY neurons, we used and compared different unsupervised clustering algorithms based on laminar location and electrophysiological and molecular properties. These classification schemes confirmed that NPY neurons are nearly exclusively GABAergic and consistently disclosed three main types of NPY-expressing interneurons. (1) Neurogliaform-like neurons exhibiting a dense axonal arbor, were the most frequent and superficial, and substantially expressed the neuronal isoform of nitric oxide synthase. (2) Martinotti-like cells characterized by an ascending axon ramifying in layer I coexpressed somatostatin and were the most excitable type. (3) Among fast-spiking and parvalbumin-positive basket cells, NPY expression was correlated with pronounced spike latency. By clarifying the diversity of cortical NPY neurons, this study establishes a basis for future investigations aiming at elucidating their physiological roles.
Introduction
The 36 aa neuropeptide Y (NPY) is one of the most abundantly and widely distributed neuropeptides of the CNS (Allen et al., 1983). In the cerebral cortex, it is involved in distinct physiological processes such as synaptic transmission (Bacci et al., 2002) or cerebral blood flow regulation (Dacey et al., 1988), as well as numerous pathological conditions such as epilepsy (Baraban et al., 1997), migraine (Choudhuri et al., 2002), anxiety (Bannon et al., 2000), or withdrawal behavior (Clausen et al., 2001).
NPY-expressing neurons are widely distributed throughout the depth of the cortex but are more frequent in layers II–III and VI (Hendry et al., 1984b; Kuljis and Rakic, 1989a; Kubota et al., 1994) in which they form two dense plexuses targeting neuronal (Hendry et al., 1984b; Aoki and Pickel, 1989; Kuljis and Rakic, 1989a; Abounader and Hamel, 1997) as well as astrocytic and vascular elements (Abounader and Hamel, 1997; Bao et al., 1997; Estrada and DeFelipe, 1998; Cauli et al., 2004). NPY neurons are mainly GABAergic (Hendry et al., 1984a; Demeulemeester et al., 1988; Aoki and Pickel, 1989; Kubota et al., 1994). They are morphologically very diverse, being bipolar, bitufted, or multipolar at the somatodendritic level (Hendry et al., 1984b; Kuljis and Rakic, 1989b; Abounader and Hamel, 1997). In addition, a molecular diversity, reflected by the coexpression of NPY with the neuronal isoform of nitric oxide synthase (NOS-1), neuropeptides, and/or calcium binding proteins, defines neurochemical subclasses of NPY neurons (Hendry et al., 1984b; Kubota et al., 1994; Gonchar et al., 2007). Furthermore, these neurons are also physiologically heterogeneous because they exhibit either adapting, fast-spiking (FS), or accelerating firing patterns (Cauli et al., 1997, 2000, 2004; Wang et al., 2002, 2004; Toledo-Rodriguez et al., 2005; Gallopin et al., 2006; Férézou et al., 2007). Together, the pleiotropic actions, widespread distribution, and large morphological, molecular, and physiological diversity suggest that NPY neurons are composed of several functionally diverse neuronal subpopulations that so far have remained poorly defined.
Today's neuroscientists agree that neuronal type definition cannot be considered complete until multimodal information regarding physiological, molecular, and morphological features are considered (Ascoli et al., 2008). This goal was pursued here for cortical NPY neurons of superficial layers by combining whole-cell current-clamp recordings, single-cell reverse transcription (scRT)-PCR, and biocytin labeling in acute slices of rat somatosensory cortex. The scRT-PCR protocol was designed to probe simultaneously for the expression of well established neurochemical markers of cortical neurons (Hendry et al., 1984b; Morrison et al., 1984; Somogyi et al., 1984; Celio, 1986, 1990; Demeulemeester et al., 1991; Jacobowitz and Winsky, 1991; Rogers, 1992; Kubota et al., 1994; Bayraktar et al., 1997; Gonchar and Burkhalter, 1997; Estrada and DeFelipe, 1998). To define distinct subtypes of NPY neurons, we used and compared different unsupervised clustering algorithms taking simultaneously into account the numerous features determined for each neuron. This approach allowed the identification of three different main types of NPY neurons with distinctive morphological, molecular, and physiological properties, thus providing a reliable polythetic classification scheme (Tyner, 1975).
Materials and Methods
Slice preparation.
All experiments were performed in accordance with the guidelines published in the European Communities Council Directive of November 24, 1986 (86/609/EEC). Juvenile male Wistar rats (postnatal days 19 ± 2; Charles River) were deeply anesthetized with halothane and decapitated. The brains were quickly removed and placed into cold (∼4°C) oxygenated artificial CSF (aCSF) (in mm): 126 NaCl, 2.5 KCl, 1.25 NaH2PO4, 2 CaCl2, 1 MgCl2, 26 NaHCO3, 10 glucose, 15 sucrose, and 1 kynurenic acid (nonspecific glutamate receptor antagonist; Sigma). Coronal slices (300 μm thick) from rat somatosensory cortex containing the barrel cortex were prepared as described previously (Schubert et al., 2001). Slices were cut with a vibratome (VT1000S; Leica), transferred to a holding chamber containing aCSF saturated with O2/CO2 (95%/5%), and held at room temperature.
Whole-cell recordings.
Individual slices were transferred to a submerged recording chamber and perfused (1–2 ml/min) with oxygenated aCSF. Patch pipettes (2.5–8 MΩ) pulled from borosilicate glass were filled with 8 μl of autoclaved RT-PCR internal solution: 144 mm K-gluconate, 3 mm MgCl2, 0.5 mm EGTA, 10 mm HEPES, pH 7.2 (285/295 mOsm), and 3 mg/ml biocytin (Sigma) for intracellular labeling. Neurons were visualized in the slice using infrared (IR) videomicroscopy (Stuart et al., 1993) with Dodt gradient contrast optics (Luigs and Neumann) (Dodt and Zieglgansberger, 1998). Whole-cell recordings in current-clamp mode were performed at room temperature (24.5 ± 1.5°C) using a patch-clamp amplifier (Axopatch 200A; Molecular Devices). Data were filtered at 5 kHz and digitized at 50 kHz using an acquisition board (Digidata 1322A; Molecular Devices) attached to a personal computer running pClamp 9.2 software package (Molecular Devices). Electrophysiological properties were recorded using the I-clamp fast mode of the amplifier. All membrane potentials were corrected for liquid junction potential (−11 mV).
Cytoplasm harvest and scRT-PCR.
At the end of the recording, the cytoplasmic content of the cell was aspirated in the recording pipette and expelled into a test tube, and RT was performed in a final volume of 10 μl as described previously (Lambolez et al., 1992). After cytoplasm collection, the patch pipette was gently withdrawn to allow the closure of the cell membrane (Cauli et al., 1997). Slices were then fixed by overnight immersion in 4% paraformaldehyde in phosphate buffer (PB) (0.1 m), pH 7.4, for subsequent biocytin staining (see below).
The scRT-PCR protocol was designed to detect simultaneously the expression of the vesicular glutamate transporter 1 (vGlut1), the two isoforms of glutamic acid decarboxylase (GAD65 and GAD67), NOS-1, three calcium binding proteins [calbindin D28k (CB), calretinin (CR), and parvalbumin (PV)], and four neuropeptides [NPY, somatostatin (SOM), vasoactive intestinal polypeptide (VIP), and cholecystokinin (CCK)]. Two amplification steps were performed essentially as described previously (Cauli et al., 1997). Briefly, the cDNAs present in 10 μl of the RT reaction were first amplified simultaneously by using the primer pairs listed in Table 1(for each pair, the sense and antisense primers were intron overspanning). Taq polymerase (2.5 U; Qiagen) and 20 pmol of each primer were added to the buffer supplied by the manufacturer (final volume, 100 μl), and 21 cycles (94°C for 30 s, 60°C for 30 s, and 72°C for 35 s) of PCR were run. Second rounds of amplification were performed using 1 μl of the first PCR product as template. In this second round, each cDNA was amplified individually with a second set of a primer pair internal to the pair used in the first PCR (nested primers) (Table 1). Thirty-five PCR cycles were performed as described previously (Cauli et al., 1997). Then 10 μl of each individual PCR product was run on a 2% agarose gel using φX174 digested by HaeIII as molecular weight maker and stained with ethidium bromide. All the transcripts were detected from 500 pg of neocortical RNA using this protocol (data not shown). The sizes of the PCR-generated fragments were as predicted by the mRNA sequences (Table 1).
Table 1.
PCR primers
| GenBank accession number | First PCR primers | Size (bp) | Second PCR nested primers | Size (bp) |
|---|---|---|---|---|
| vGluT1 | Sense, 361 GGCTCCTTTTTCTGGGGGTAC | 259 | Sense, 373: TGGGGGTACATTGTCACTCAGA | 201 |
| NM_053859.1 | Antisense, 600: CCAGCCGACTCCGTTCTAAG | Antisense, 553: ATGGCAAGCAGGGTATGTGAC | ||
| GAD65 | Sense, 99: CCAAAAGTTCACGGGCGG | 375 | Sense, 156: TGAGAAGCCAGCAGAGAGCG | 260 |
| NM_012563.1 | Antisense, 454: TCCTCCAGATTTTGCGGTTG | Antisense, 392: TGGGGTAATGGAAATCAATCACTT | ||
| GAD67 | Sense, 83: ATGATACTTGGTGTGGCGTAGC | 253 | Sense, 159: CAATAGCCTGGAAGAGAAGAGTCG | 177 |
| NM_017007.1 | Antisense, 314: GTTTGCTCCTCCCCGTTCTTAG | Antisense, 314: GTTTGCTCCTCCCCGTTCTTAG | ||
| NOS-1 | Sense, 1668: CCTGGGGCTCAAATGGTATG | 373 | Sense, 1689: CCTCCCCGCTGTGTCCAA | 270 |
| NM_052799.1 | Antisense, 2021: CACAATCCACACCCAGTCGG | Antisense, 1937: GAGTGGTGGTCAACGATGGTCA | ||
| CB | Sense, 139: GAAAGAAGGCTGGATTGGAG | 426 | Sense, 194: ATGGGCAGAGAGATGATGGG | 228 |
| NM_031984.2 | Antisense, 544: CCCACACATTTTGATTCCCTG | Antisense, 400: TATCATCCACGGTCTTGTTTGC | ||
| PV | Sense, 104: GCCTGAAGAAAAAGAGTGCGG | 181 | Sense, 121: GCGGATGATGTGAAGAAGGTG | 145 |
| NM_022499.2 | Antisense, 266: GTCCCCGTCCTTGTCTCCAG | Antisense, 246: CAGCCATCAGCGTCTTTGTT | ||
| CR | Sense, 83: TTGATGCTGACGGAAATGGGTA | 265 | Sense, 141: GCTGGAGAAGGCAAGGAAAGG | 151 |
| NM_053988.1 | Antisense, 327: CAAGCCTCCATAAACTCAGCG | Antisense, 272: ATTCTCTTCGGTTGGCAGGA | ||
| NPY | Sense, 18: CGAATGGGGCTGTGTGGA; | 295 | Sense, 41: CCCTCGCTCTATCCCTGCTC | 229 |
| NM_012614.1 | Antisense, 289: AGTTTCATTTCCCATCACCACAT | Antisense, 249: GTTCTGGGGGCATTTTCTGTG | ||
| VIP | Sense, 216: TTATGATGTGTCCAGAAATGCGAG | 424 | Sense, 321: TGGCAAACGAATCAGCAGTAGC | 162 |
| XM_217838.4 | Antisense, 616: TTTTATTTGGTTTTGCTATGGAAG | Antisense, 461: GAATCTCCCTCACTGCTCCTCT | ||
| SOM | Sense, 1: ATGCTGTCCTGCCGTCTCCA | 250 | Sense, 41: GCATCGTCCTGGCTTTGGG | 170 |
| NM_012659.1 | Antisense, 231: GCCTCATCTCGTCCTGCTCA | Antisense, 191: AGGCTCCAGGGCATCGTTCT | ||
| CCK | Sense, 16: TGTCTGTGCGTGGTGATGGC | 554 | Sense, 192: ATACATCCAGCAGGTCCGCAA | 219 |
| NM_012829.1 | Antisense, 546 GCATAGCAACATTAGGTCTGGGAG | Antisense, 391: GGTCGTGTGCGTGGTTGTTT |
Position 1, First base of the start codon.
Electrophysiological analysis.
To describe different electrophysiological behaviors observed in cortical neurons, 32 electrophysiological parameters adopting Petilla terminology (Ascoli et al., 2008) were determined for each cell. (1) Resting membrane potential was measured just after passing in whole-cell configuration, and only cells with a resting membrane potential more negative than −61 mV were analyzed further. (2) Input resistance (Rm) and (3) membrane time constant (τm) were determined on responses to hyperpolarizing current pulses (duration, 800 ms) eliciting voltage shifts of 10–15 mV negative to rest (Kawaguchi, 1993, 1995). Time constant was determined by fitting this voltage response to a single exponential. (4) Membrane capacitance (Cm) was calculated according to Cm = τm/Rm. In some neurons, injection of hyperpolarizing current pulses induced pronounced “sag,” indicative of a hyperpolarization-activated cationic current (Ih) that followed the initial hyperpolarization peak. Thus, whole-cell conductance was measured when the sag conductance was inactive (Ghyp) or active (Gsag). Gsag was measured as the slope of the linear portion of a current–voltage (I–V) plot, in which V was determined at the end of 800 ms hyperpolarizing current pulses (−100 to 0 pA) and Ghyp as the slope of the linear portion of an I–V plot, in which V was determined as the maximal negative potential during the 800 ms hyperpolarizing pulses. (5) Sag index was quantified as a relative decrease in membrane conductance according to (Gsag − Ghyp)/Gsag (Halabisky et al., 2006). (6) Rheobase, a measure of electrical excitability, was quantified as the minimal depolarizing current pulse intensity (800 ms duration, 10 pA increments) generating at least one action potential. A pronounced (7) first spike latency or delayed firing (Gupta et al., 2000; Ascoli et al., 2008), previously referred to as “late spiking” (Kawaguchi, 1995; Tamás et al., 2003), has been reported to be a distinctive feature of neurons of the morphological neurogliaform class. This property was measured at rheobase as the time needed to elicit the first action potential. Firing behavior near threshold is also very informative about the electrophysiological diversity of cortical neurons. For instance, when depolarized just above threshold neurons can exhibit the following: “continuous firing” (McCormick et al., 1985; Kawaguchi, 1995; Ascoli et al., 2008), corresponding to “type 1 neurons” (Hodgkin, 1948) defined by a low minimal frequency increasing with stimulus intensity, “burst firing” (McCormick et al., 1985; Kawaguchi and Kubota, 1996; Cauli et al., 1997; Porter et al., 1998), defined by their inability to fire below a minimal frequency at the onset of firing (type 2 neurons), or an “accelerating firing” (Simon et al., 2005). To describe these different behaviors, spike frequency was determined near spike threshold on the first trace in which at least three spikes were triggered. Under these conditions, instantaneous discharge frequencies were measured and fitted to a straight line according to Fthreshold = mthreshold × t + Fmin, where mthreshold is the slope termed (8) adaptation, t is the time, and Fmin is the (9) minimal steady-state frequency. This parametric description of the firing pattern allows to differentiate the three different firing classes described above: bursting neurons are characterized by a high Fmin and a pronounced adaptation, accelerating neurons exhibit a negative adaptation and a low Fmin, whereas continuous firing neurons exhibit intermediate Fmin and adaptation (10). A complex spike amplitude accommodation during a train of action potentials, consisting in a transient decrease of spikes amplitude, preeminent in some cortical neurons, was measured as the difference between the peak of the smallest action potential and the peak of the following biggest action potential (Cauli et al., 2000). At the highest stimulation intensities, a high firing rate is characteristic of FS class neurons (McCormick et al., 1985; Kawaguchi, 1993; Cauli et al., 1997). Maximal firing rate was defined as the last trace before prominent reduction of action potentials amplitude indicative of a saturated discharge. To take into account the biphasic spike frequency adaptation (early and late) occurring at high firing rates (Cauli et al., 1997, 2000; Gallopin et al., 2006), instantaneous firing frequency was fitted to a single exponential (Halabisky et al., 2006) with a sloping baseline, according to Fsaturation = Asat × E−t/τsat + t × msat + Fmax, where Asat corresponds to the (11) amplitude of early frequency adaptation, τsat to (12) time constant of early adaptation, msat to the (13) slope of late adaptation, and Fmax to the (14) maximal steady-state frequency. Under these conditions, FS class neurons are typically characterized by a high steady-state frequency with little or no frequency adaptation (Cauli et al., 1997, 2000). Analysis of the action potential waveforms was done on the first two spikes. Their (15, 16) amplitude (A1 and A2) was measured from threshold to the positive peak of the spike. Their (17, 18) duration (D1 and D2) was measured at half amplitude (Kawaguchi, 1993; Cauli et al., 1997), short duration of action potentials being also a characteristic feature of FS class neurons (McCormick et al., 1985; Kawaguchi, 1993; Kawaguchi and Kubota, 1993). Their (19) amplitude reduction and the (20) duration increase were calculated according to (A1 − A2)/A1 and (D2 − D1)/D1, respectively (Cauli et al., 1997, 2000). In some cortical neurons, a complex waveform of afterpotential has been reported in some cortical neurons (Beierlein et al., 2003; Povysheva et al., 2007). Therefore, the amplitude (21–24) and the latency (25–28) of the first (AHPf) and second (AHPs) components of afterhyperpolarization was measured for the first two action potentials as the difference between spike threshold and the negative peak of the AHP (Kawaguchi, 1993). In some cortical neurons (Haj-Dahmane and Andrade, 1997), this complex repolarization is accompanied by a fast afterdepolarization (ADP). Its (29, 30) amplitude and (31, 32) latency were measured as the difference between the negative peak of the AHPf and the positive peak of the ADP and between the spike threshold and the peak of the ADP, respectively. When neurons did not exhibit AHPs or ADP, amplitude and latency were arbitrarily set to 0.
Visualization and imaging of the intracellular biocytin-filled neurons.
The slices were basically processed as described previously (Staiger et al., 2002). In brief, the 300-μm-thick slices were cut to 100-μm-thick sections on a vibratome (Microm HM650 V), on the one hand to facilitate the penetration of the reagents and on the other hand to create sections that can be scanned with confocal microscopy throughout the whole thickness.
For the fluorescent staining, the sections were washed in 0.05 m Tris-buffered saline (TBS), pH 7.4, containing 0.3% Triton X-100 to permeabilize the tissue by removing membrane lipids. The sections were incubated with Alexa-488-coupled streptavidin (Invitrogen) for 6 h.
For bright-field staining, the sections were washed several times with PB and incubated with cryoprotectant (25% saccharose, 10% glycerol in 0.01 m PB) until the sections sank. The sections were frozen three times over liquid nitrogen. The cryoprotectant was washed out with PB, and the sections were stored in PB containing 0.05% sodium azide until additional processing. The intrinsic peroxidase activity was blocked by incubating the sections in 1% H2O2 diluted in PB for 10 min. Afterward, the sections were washed in PB until the bubble formation stopped. Then the buffer was exchanged to TBS, pH 7.6. Avidin-biotinylated peroxidase complex (Vector Laboratories) was diluted 1:400 in TBS and added to the sections overnight. For visualization, the sections were preincubated with 0.5% 3,3′-diaminobenzidine-hydrochloride (DAB) (Sigma) for 10 min, and then 0.01% hydrogen peroxide was added to start the reaction. After reaching optimal color intensity, the reaction was stopped by washing with TB. The DAB reaction product was intensified by a modified silver impregnation technique (Görcs et al., 1986; Dávid et al., 2007), resulting in a dark brown to black staining of the biocytin-filled cells and their processes.
The cells visualized by fluorescent dye were automatically imaged by an LSM510 laser scanning microscope (Zeiss). The acquired image stacks were reconstructed in three dimensions using the confocal module of the software Neurolucida (MBF Bioscience Europe). The bright-field sections were reconstructed with a standard Neurolucida setup based on an Eclipse 80i (Nikon).
Morphological analysis.
Somatic features were measured from infrared Dodt Gradient contrast pictures of the recorded neurons. Briefly, the soma was manually delineated using Image-Pro 5.1 software (Media Cybernetics), and length of major and minor axes, perimeter, and area were extracted. The soma elongation was calculated as the ratio between major and minor axis. Somata exhibiting an elongation larger than 2 were defined as fusiform (Cauli et al., 2000). Roundness was calculated according to the following:
 |
in which a value close to 1 is indicative of round somata.
From the labeled and reconstructed neurons, the following parameters were extracted: orientation of major axis relative to the radial axis, number of primary dendrites, and vertical and horizontal span of the dendritic tree. Two additional features of the cells were calculated from the basic data: “verticality” and “multipolarity” (supplemental materials, available at www.jneurosci.org as supplemental material). Verticality was defined as the ratio between vertical and horizontal spans of the dendritic tree. Radially oriented cells displayed a verticality larger than 1. For the calculation of multipolarity, the centroid of the cell was used as a point of origin, from which the angle of each dendrite was measured relative to the closest pole of the cell, defined by the crossing point of the major axis of the cell and the cell membrane. Multipolarity was defined as the ratio between the dendrite-containing sectors and the dendrite-free lateral sectors. High multipolarity values indicate a homogeneous distribution of dendrites in space, whereas values close to 0 describe polarized cells.
Cells were classified according to their somatodendritic morphology as follows. (1) Bipolar cells (n = 28 of 68) possessed two dendrites emerging from the upward and downward poles of the soma. Similar neurons exhibiting a third very short, nonbranching, and thin dendrite were considered as modified bipolar cells (n = 4). (2) Tufted cells (n = 19) were basically similar to bipolar neurons but displayed at least one (single tufted) or two (bitufted) dendritic tufts (i.e., at least two separate primary dendrites) emanating from the pole(s); single and bitufted cells were not differentiated. (3) Multipolar cells (n = 32) displayed at least four dendrites distributed around the perimeter of the cell.
Unsupervised clustering.
To classify cells, unsupervised clustering was performed using 32 electrophysiological parameters (see above), 10 molecular parameters (VGluT1, GAD65, and/or GAD67, NOS-1, CB, PV, CR, NPY, VIP, SOM, and CCK), and the laminar location was determined by infrared videomicroscopy and confirmed after biocytin labeling (see above). For neurons located at the border of layers I–II and III–IV, the laminar location was digitized by 1.5 and 3.5, respectively. Neurons positive for GAD65 and/or GAD67 were denoted as GAD positive, and these mRNAs were considered as a single molecular variable as described previously (Gallopin et al., 2006). Parameters were standardized by centering and reducing all of the values. Cluster analysis was run on Statistica 6 software (Statsoft) and within the Matlab environment (MathWorks).
In Ward's method (Ward, 1963), individual cells are first linked to their nearest neighbor and combined two-by-two into objects of a superior hierarchic order. This linkage procedure is repeated on these objects until the top hierarchic level is reached. The final number of clusters was established by hierarchically subdividing the clustering tree into higher-order clusters to achieve a relative enrichment of NPY-expressing neurons. Comparison of the occurrence of a given molecular marker between populations of cortical neurons was done according to the following:
 |
where pa and pb represent the percentage of occurrence and na and nb the number of individuals in populations a and b. The variable p denotes the percentage of occurrence in the overall population with q = 1 − p. This quantity ε was tested against a normal distribution to determine statistical significance of the difference of expression (Fisher and Yates, 1963). Comparison of electrophysiological and morphological properties between populations was performed using a Mann–Whitney U test. All reported values are means ± SD.
Clustering validation.
The obtained Ward's classification was first validated by comparing it with an alternative clustering of the same data performed with the K-means algorithm (MacQueen, 1964; Hartigan and Wong, 1979). This method generates clusters, for a given preimposed number of K clusters, in a top-down manner. The positions of the K-cluster centroids are initially randomly generated and are iteratively optimized until when the cluster centroid positions converge to a stable position. This method potentially achieves a more statistically significant discrimination between cellular classes, because suboptimal attributions of cells to specific clusters can be dynamically corrected across the iterations, unlike the Ward's method. However, the number of K clusters has to be set according to a substantially arbitrary criterion. Clusters were therefore generated for several increasing values of K. For each K, the K-means algorithm was run starting from 1000 different random initial positions of the K cluster centroids, with a cutoff number of iterations per run equal to 1000. In the case of the present validation analysis, the best value of K was determined by comparison with the reference Ward's clustering. A cluster Ak-means generated by K-means clustering was considered to match a cluster AWard generated by Ward's clustering if a sufficiently large fraction of its elements belonged as well to the cluster AWard. K was then fixed by taking its smallest value for which all the K-means clusters of NPY neurons matched a Ward's cluster.
The significance of the classification obtained by unsupervised clustering was further validated by comparison with randomized databases. To perform the randomization, the experimental dataset was represented as a matrix whose 43 columns corresponded to the different measured features (i.e., laminar location, the 32 electrophysiological parameters, and the 10 molecular parameters) and whose rows corresponded to different neurons. A randomized database was then built by permuting randomly and independently the order of entries within each column. This scrambling did not alter the mean values and the SDs of the randomized parameters but disrupted the structured correlations between the measurements of the different features. Clustering of the randomized databases was performed using the same parameters as for the K-means clustering of the original database. The quality of different clustering was quantitatively assessed by means of silhouette analysis (Rousseeuw, 1987). Given a data point i in a cluster A, let a(i) denote the average Euclidean distance between i and other data points in the cluster A and let b(i) denote the average Euclidean distance between i and points in the second closest cluster. The silhouette value S(i) was then computed using the following formula:
 |
The inequality −1 ≤ S(i) ≤ 1 holds. A silhouette value about zero means that the data point lies equally far away from more than one cluster. Large negative silhouette values, however, indicate a potential misclassification. The overall silhouette width S(A) for a given clustering A is defined as the average of the S(i) over the whole dataset and is used as global measure of quality of a possible clustering. The silhouette widths of the clusterings of different randomized databases were computed and compared with the silhouette width of the K-means clustering of the original, nonrandomized database. A significant reduction of the clustering quality was expected to arise after randomization, whenever the clustering quality of the original clustering is “meaningful,” i.e., not just generated by accidental random correlations between the measurements. Silhouette widths were computed for 2000 independently randomized databases, and the effective loss of quality was assessed by averaging the quantity [S(scrambled) − S(original)]/S(original) over all these realizations.
Unsupervised clustering inclusive of morphological properties.
For a subset of n = 68 morphologically recovered GABAergic interneurons, an additional clustering was performed considering also the measurements of 12 somatodendritic morphological properties, in addition to laminar location and electrophysiological and molecular properties. Unsupervised clustering was performed using the K-means method.
To evaluate the relevance for classification of the different classes of properties, comparison was performed with randomized databases. A first randomized database was obtained by scrambling laminar location and the 12 morphological properties, a second database was built by scrambling the 32 electrophysiological properties, and a third by scrambling the 10 molecular properties. Losses in the clustering quality were once again quantified by comparing silhouette widths before and after the randomization.
Results
Two hundred cortical neurons of superficial layers (I–IV) were first selected according to their laminar location and the shape of their soma as seen by infrared videomicroscopy (Stuart et al., 1993). To increase the probability of recording NPY neurons, cells exhibiting at least one vertically oriented process, a morphological feature frequently observed for NPY neurons (Hendry et al., 1984b), were preferentially selected. Neurons from layers I (n = 8), II–III (n = 133), and IV (n = 59) were then characterized by combining patch-clamp recordings, scRT-PCR, and biocytin labeling (Cauli et al., 1997) for physiological, molecular, and morphological identification, respectively. To take into account the electrophysiological diversity of cortical neurons, 32 electrophysiological features adopting Petilla terminology (Ascoli et al., 2008) were determined for each cell (see Materials and Methods). The scRT-PCR protocol was designed to detect mRNAs encoding 10 molecular markers commonly used to define subpopulations of cortical neurons: VGluT1, GAD, NOS-1, CB, PV, CR, NPY, VIP, SOM, and CCK (see Materials and Methods). The somatodendritic morphology of physiologically and molecularly characterized neurons was successfully revealed for n = 96 of 200 neurons, and basic morphometric analysis of the soma and dendritic arbor were determined for n = 68 interneurons. As expected from our sampling procedure and in accordance with the literature (Jin et al., 2001), neurons were mostly radially oriented (Fig. 1B) (see Table 8).
Figure 1.
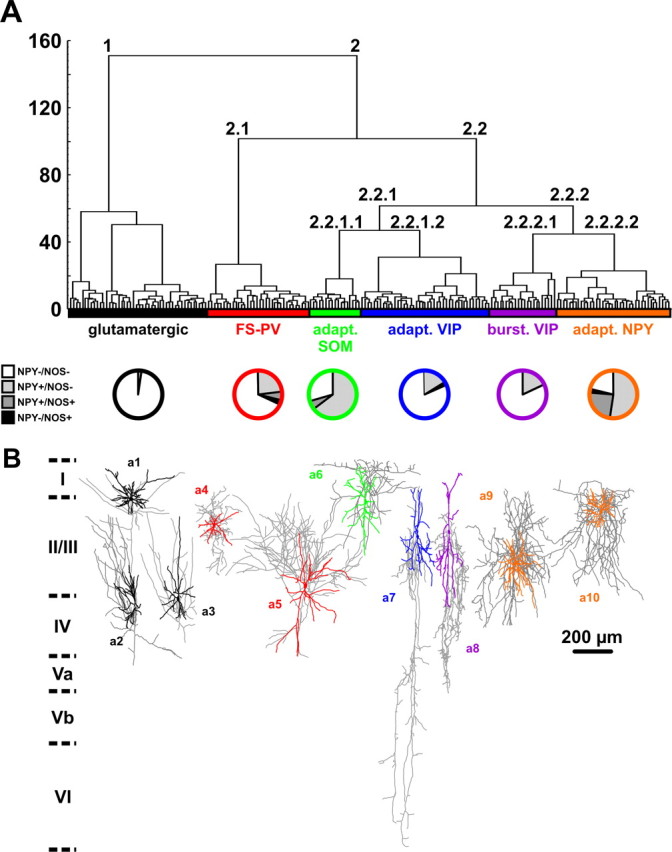
Unsupervised clustering of neocortical neurons based on laminar location and electrophysiological and molecular properties. A, Ward's clustering applied to a sample of 200 neurons. The x-axis represents individual cells, and the y-axis represents the average Euclidian within-cluster linkage distance. Glutamatergic neurons (cluster 1, black) and GABAergic neurons (cluster 2) were segregated into two first-order clusters. GABAergic neurons further subdivide into five higher-order clusters termed FS-PV (red, cluster 2.1), adapting SOM (green, cluster 2.2.1.1), adapting VIP (blue, cluster 2.2.1.2), bursting VIP (purple, cluster 2.2.2.1), and adapting NPY (orange, cluster 2.2.2.2). Bottom pie charts show, in each cluster, the proportion of neurons expressing NPY (light gray), NOS-1 (black), and neurons coexpressing NPY and NOS-1 (dark gray). B, Examples of Neurolucida reconstructions displaying the dominant morphologies of each cluster: spiny stellate cell (a1), pyramidal cell (a2), and star pyramidal cell (a3) for the glutamatergic cluster and multipolar basket cells (a4, a5), layer I targeting Martinotti-like cell (a6), bipolar cells (a7, a8), and neurogliaform-like cells (a9, a10).
Table 8.
Dendritic features of cortical interneuron subtypes
| FS-PV(n = 15) | Adapting SOM(n = 11) | Adapting/Bursting VIP(n = 23) | Adapting NPY(n = 21) | |
|---|---|---|---|---|
| Orientation (degree) | 8.47 ± 10.15 | 6.73 ± 7.72 | 8.18 ± 13.56 | 15.90 ± 26.16 |
| NS | ||||
| Number of primary dendrites | 4.9 ± 2.0 | 3.6 ± 1.1 | 3.0 ± 1.0 | 4.3 ± 1.5 |
| Adapting/Bursting VIP << FS-PV; Adapting NPY | ||||
| Vertical span of dendritic arbor (μm) | 427.8 ± 185.7 | 491.4 ± 178.5 | 436.5 ± 170.0 | 319.6 ± 217.1 |
| Adapting NPY < Adapting SOM; Adapting/Bursting VIP | ||||
| Horizontal span of dendritic arbor (μm) | 195.7 ± 78.9 | 215.3 ± 63.9 | 138.5 ± 68.6 | 190.7 ± 47.5 |
| Adapting/Bursting VIP < FS-PV; Adapting SOM; Adapting NPY | ||||
| Verticality | 2.6 ± 2.0 | 2.6 ± 1.7 | 4.2 ± 2.9 | 1.6 ± 1.0 |
| FS-PV; Adapting NPY < Adapting/Bursting VIP | ||||
| Multipolarity | 0.60 ± 0.87 | 0.27 ± 0.20 | 0.12 ± 0.14 | 0.30 ± 0.28 |
| Adapting/Bursting VIP < FS-PV; Adapting NPY | ||||
n, Number of cells; NS, not statistically significant; < indicates significantly smaller with p ≤ 0.05; << indicates significantly smaller with p ≤ 0.01.
Identification and classification of NPY neuron subtypes
To identify and define NPY neuron subtypes with similar but not necessarily identical properties, we used a polythetic classification scheme (Tyner, 1975) defined according to the following: (1) neurons of a group must share a large number of common features, (2) each feature must be possessed by a large but unstated number of individuals in the group, and (3) no feature is necessarily possessed by all members of the group. Ward's clustering (Ward, 1963), which groups together individuals with large similarities, meets these prerequisites and has been extensively used for neuronal classes definition based on multiple electrophysiological, molecular, and/or morphological features (Tamás et al., 1997; Cauli et al., 2000; Karube et al., 2004; Gallopin et al., 2006; Halabisky et al., 2006; Dávid et al., 2007; Dumitriu et al., 2007; Andjelic et al., 2009; Helmstaedter et al., 2009). This algorithm works by grouping together cells with the largest overall similarity into clusters and then by grouping these high-order clusters into new clusters of increasingly lower order. A clustering tree (dendrogram) is then built, starting from its leaves (individual cells) and grouping them into branched ramifications up to a common root (Fig. 1A).
The hierarchic clustering tree generated by the Ward's method showed that cortical neurons are first segregated into two clusters (Fig. 1A). All neurons of cluster 1 (n = 46) expressed VGluT1 but not GAD (see Table 3) and thus are glutamatergic neurons. Because NPY was rarely expressed in glutamatergic cluster neurons (1 of 46; 2%) (Fig. 1A) (see Table 3), this group was not considered for additional subdivision. In contrast, all neurons of cluster 2 (n = 154) expressed GAD with (23%) or without (77%) VGluT1 and corresponded to GABAergic neurons. In good agreement with previous observations (Cauli et al., 2000; Gallopin et al., 2006), glutamatergic neurons were perfectly segregated from GABAergic interneurons. These GABAergic neurons exhibited a much higher proportion of NPY-expressing cells (40%; p < 0.001) (Fig. 1A). This cluster was further divided into two second-order branches (Fig. 1A). Cluster 2.1 (n = 34 neurons), in which 29% of the neurons expressed NPY (Fig. 1A), was otherwise exclusively composed of PV-expressing neurons displaying brief spikes and high and sustained firing rates characteristic of the FS neurons (McCormick et al., 1985; Kawaguchi, 1993; Kawaguchi and Kubota, 1993) and was termed FS-PV cluster (Kawaguchi and Kubota, 1993). The molecular diversity of cluster 2.2 neurons was much larger because all used molecular markers of GABAergic neurons, including NPY in a high proportion (43%), were detected in different combinations (n = 120; data not shown), suggesting that it contained different neuronal populations in its higher-order branches. Cluster 2.2 neurons exhibited indeed different firing behaviors: continuous adapting (n = 95), bursting (n = 17), and delayed (n = 8) and different morphologies (Fig. 1B). Its two branches revealed heterogeneous molecular, electrophysiological, and morphological features as well (Fig. 1A,B). In addition, cluster 2.2.1 contained the majority of adapting neurons (61%), whereas cluster 2.2.2 contained the large majority of bursting neurons (88%) and all delayed neurons, suggesting that both clusters are composed of different populations and can be further subdivided (Fig. 1A). Almost all cluster 2.2.1.1 neurons expressed SOM (94%) in addition to NPY (70%) (Fig. 1A) (see Table 3). At high firing rates, these cells also displayed a marked frequency adaptation characteristic of adapting (n = 16) and burst firing (n = 1) neurons and were therefore termed adapting SOM neurons. Cluster 2.2.1.2 neurons rarely expressed NPY (16%) (Fig. 1A) (see Table 3) but frequently VIP (74%; see Table 3). All neurons of this cluster (but one) were adapting cells and were termed adapting VIP neurons. Similarly, cluster 2.2.2.1 neurons rarely expressed NPY (18%) (Fig. 1A) compared with VIP (77%; see Table 3). The majority of these cells (n = 17 of 22) displayed a burst firing behavior and were termed bursting VIP neurons. NPY was frequently expressed (76%) (Fig. 1A) in cluster 2.2.2.2 neurons, which mainly contained adapting neurons (n = 30) and all delayed neurons (n = 8). Because at high firing rates both spiking behaviors exhibit a marked frequency adaptation (Kawaguchi, 1995), these cells were termed adapting NPY neurons. In summary, this Ward's clustering allowed to discriminate three different clusters of neurons for which NPY was detected with a relatively high occurrence: 29, 70, and 76% for FS-PV, adapting SOM and adapting NPY neurons.
Table 3.
Occurrence of molecular markers in different neuronal types
| Glutamatergic(n = 46) | FS-PV(n = 34) | Adapt. SOM(n = 17) | Adapt. VIP(n = 43) | Burst. VIP(n = 22) | Adapt. NPY(n = 38) | |
|---|---|---|---|---|---|---|
| vGluT1 | 100% | 29% | 18% | 12% | 32% | 29% |
| Glutamatergic >>> FS-PV, Adapt. SOM, Adapt. VIP, Burst. VIP, Adapt. NPY | ||||||
| GAD | 0% | 100% | 100% | 100% | 100% | 100% |
| FS-PV, Adapt. SOM, Adapt. VIP, Burst. VIP, Adapt. NPY >>> Glutamatergic | ||||||
| NOS-1 | 0% | 9% | 6% | 2% | 0% | 26% |
| Adapt. NPY >> Glutamatergic, Adapt. VIP, Burst. VIP | ||||||
| CB | 44% | 59% | 88% | 9% | 5% | 3% |
| Adapt. SOM > Glutamatergic, FS-PV >> Adapt. VIP, Burst. VIP, Adapt. NPY | ||||||
| PV | 33% | 100% | 29% | 26% | 14% | 26% |
| FS-PV >>> Glutamatergic, Adapt. SOM, Adapt. VIP, Burst. VIP, Adapt. NPY | ||||||
| CR | 0% | 3% | 18% | 30% | 32% | 13% |
| Adapt. VIP, Burst. VIP >> Glutamatergic, FS-PV | ||||||
| NPY | 2% | 29% | 70% | 16% | 18% | 76% |
| Adapt. NPY, Adapt. SOM >> Adapt. VIP, Burst. VIP, FS-PV > Glutamatergic | ||||||
| VIP | 0% | 3% | 0% | 74% | 77% | 8% |
| Adapt. VIP, Burst. VIP >>> Glutamatergic, Adapt. SOM, FS-PV, Adapt. NPY | ||||||
| SOM | 2% | 9% | 94% | 5% | 14% | 0% |
| Adapt. SOM >>> Glutamatergic, FS-PV, Adapt. VIP, Burst. VIP, Adapt. NPY | ||||||
| CCK | 7% | 0% | 0% | 19% | 9% | 8% |
| Adapt. VIP >> FS-PV | ||||||
n, Number of cells; > indicates significantly larger with p ≤ 0.05; >> indicates significantly larger with p ≤ 0.01; >>> indicates significantly larger with p ≤ 0.001. Adapt., Adapting; Burst., bursting.
Three main classes of NPY-expressing neurons
FS-PV cells, absent from layer I, were among the deepest neurons of our sample (Table 2) and generally displayed large fusiform somata (Fig. 2A; Table 2). In good agreement with previous reports (Kubota et al., 1994; Cauli et al., 1997, 2000; Wang et al., 2002; Gallopin et al., 2006; Gonchar et al., 2007; Fuentealba et al., 2008), PV was frequently coexpressed with CB and to a lesser extent NPY (Fig. 2B,D; Table 3). These cells were characterized by low input resistance, short membrane time constant (Fig. 2A,C; Table 4), and the highest rheobase (Fig. 2A,C; Table 5) of our sample. They also typically (Kawaguchi, 1993; Kawaguchi and Kubota, 1993) fired action potentials of short duration and small amplitude (see Table 7) with sharp and monophasic (n = 25 of 34 neurons) fast AHP (Fig. 2A,C) (see Table 7). However, in some FS-PV neurons (n = 9 of 34), action potential repolarization consisted of a first fast AHP component, followed by a fast ADP and a second late AHP component (data not shown). The majority (56%) of FS-PV neurons exhibited an acceleration of their firing rate when depolarized just above threshold (Table 5). Interestingly, NPY-expressing FS-PV neurons (n = 10) fired action potentials with a longer latency (512.8 ± 242.9 ms) (Fig. 2A,B) than other FS-PV neurons (264.1 ± 231.1 ms; p < 0.05) (Fig. 2C,D). However, no other statistically significant difference in electrophysiological, molecular, or morphological features could be observed between these two classes of FS-PV neurons (data not shown). At higher stimulation intensities, FS-PV neurons were distinctly able to sustain a high firing rate, resulting in a high steady-state frequency with little or no frequency adaptation (Fig. 2A,C; Table 6).
Table 2.
Somatic properties of different cortical neurons
| Glutamatergic(n = 46) | FS-PV(n = 34) | Adapt. SOM(n = 17) | Adapt. VIP(n = 43) | Burst. VIP(n = 22) | Adapt. NPY(n = 38) | |
|---|---|---|---|---|---|---|
| Layer | 3.4 ± 0.8 | 3.2 ± 0.7 | 2.8 ± 0.7 | 2.5 ± 0.6 | 2.6 ± 0.6 | 2.1 ± 0.7 |
| Adapt. NPY < Adapt. VIP Burst. VIP, Adapt. SOM < FS-PV, Glutamatergic | ||||||
| Major axis (μm) | 17.1 ± 3.8 | 21.3 ± 4.3 | 22.4 ± 6.3 | 18.8 ± 3.3 | 16.4 ± 3.1 | 20.4 ± 7.7 |
| Burst. VIP, Glutamatergic < Adapt. VIP, Adapt. NPY, FS-PV, Adapt. SOM | ||||||
| Minor axis (μm) | 9.4 ± 1.5 | 9.4 ± 1.1 | 8.6 ± 1.1 | 8.3 ± 0.9 | 8.8 ± 1.2 | 9.0 ± 1.5 |
| Adapt. VIP, Adapt. SOM < FS-PV, Glutamatergic | ||||||
| Elongation | 1.9 ± 0.6 | 2.3 ± 0.5 | 2.6 ± 0.7 | 2.3 ± 0.4 | 1.9 ± 0.4 | 2.3 ± 0.8 |
| Burst. VIP, Glutamatergic < Adapt. VIP, FS-PV, Adapt. NPY, Adapt. SOM | ||||||
| Area (μm2) | 119.4 ± 29.1 | 152.3 ± 31.4 | 147.7 ± 45.9 | 115.2 ± 22.1 | 107.2 ± 28.4 | 139.9 ± 56.7 |
| Burst. VIP, Adapt. VIP, Glutamatergic < Adapt. SOM, FS-PV | ||||||
| Perimeter (μm) | 45.4 ± 7.5 | 52.1 ± 7.6 | 52.9 ± 12.5 | 45.9 ± 6.5 | 42.1 ± 6.9 | 50.5 ± 14.9 |
| Burst. VIP < glutamatergic, Adapt. VIP < FS-PV, Adapt. SOM and Burst. VIP < Adapt. NPY | ||||||
| Roundness | 1.4 ± 0.3 | 1.4 ± 0.2 | 1.5 ± 0.3 | 1.6 ± 1.0 | 1.3 ± 0.2 | 1.5 ± 0.3 |
| Burst. VIP < FS-PV, Adapt. SOM, Adapt. NPY, Adapt. VIP | ||||||
n, Number of cells; < indicates significantly smaller with p ≤ 0.05. Adapt., Adapting; Burst., bursting.
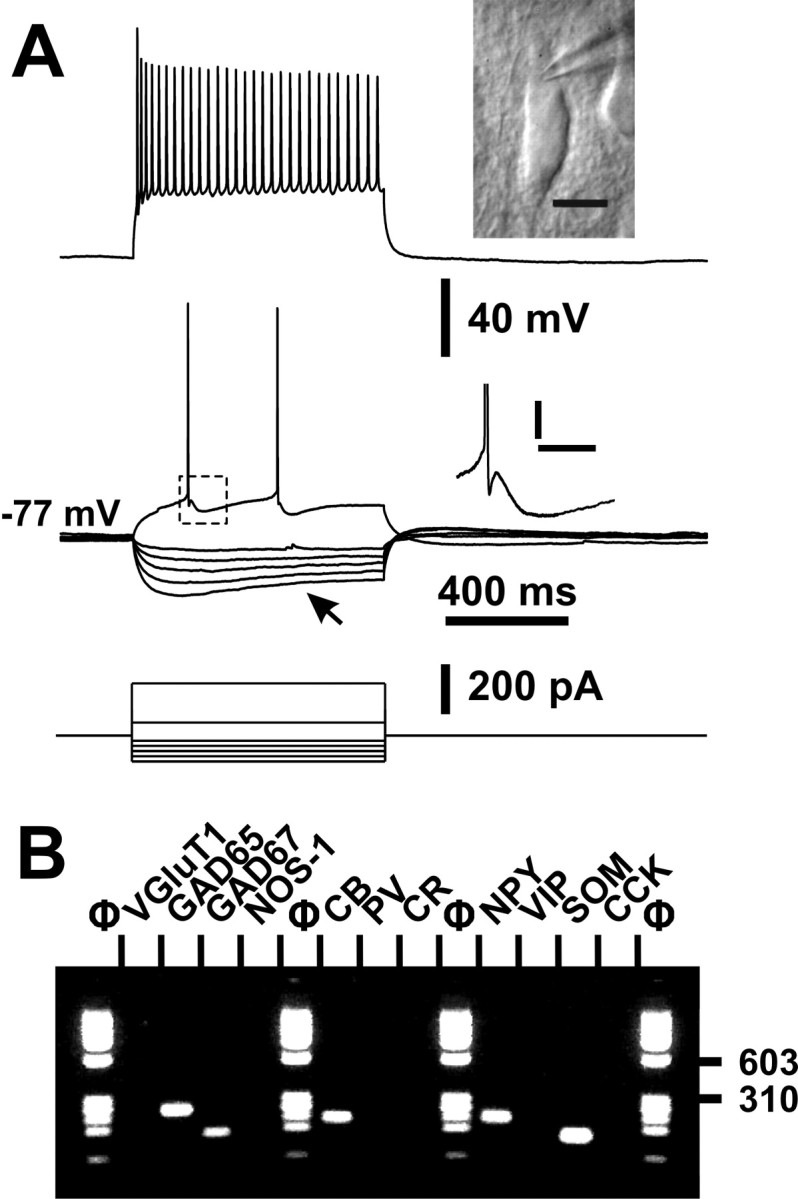
Figure 2.

Electrophysiological and molecular analysis of FS-PV neurons. A, Current-clamp recordings of an FS-PV neuron obtained in response to application of current pulses (bottom traces) of −100, −80, −60, −40, −20, +120, and + 690 pA. Note the very long latency of fast action potentials induced by a just-above-threshold current pulse (120 pA; middle trace). Top inset, IR videomicroscopy picture of the same neuron that presented a large and radially oriented soma, pial surface is upward (scale bar, 10 μm) (see also Fig. 1B, a5). Bottom inset, Details of the repolarization phase of the first spike (calibration: 5 mV, 50 ms). Note the large and fast component AHP. Strong depolarizing current (690 pA; top trace) evoked a high and sustained firing rate. B, Agarose gel analysis of the RT-mPCR products of the same FS-PV neuron expressing GAD65, GAD67, PV, and NPY. C, Current-clamp recordings of another FS-PV neuron obtained in response to application of current pulses (bottom traces) of −100, −80, −60, −40, −20, +110, and + 650 pA. Note the short delay of nonadapting fast action potentials induced by a just-above-threshold current pulse (110 pA; middle trace). Top inset, IR videomicroscopy picture of the same neuron that presented a small and radially oriented soma, pial surface is upward (scale bar, 10 μm). Bottom inset, Details of the repolarization phase of the first spike (calibration: 5 mV, 50 ms). Note the large and fast single component AHP. Large depolarizing current (650 pA; top trace) evoked a high and sustained firing rate. D, Agarose gel analysis of the RT-mPCR products of the same FS-PV neuron expressing GAD65, GAD67, CB, and PV.
Table 4.
Subthreshold properties of different neuronal types
| Glutamatergic(n = 46) | FS-PV(n = 34) | Adapt. SOM(n = 17) | Adapt. VIP(n = 43) | Burst. VIP(n = 22) | Adapt. NPY(n = 38) | |
|---|---|---|---|---|---|---|
| (1) Resting potential (mV) | −74.2 ± 4.6 | −72.2 ± 4.1 | −65.3 ± 4.3 | −70.3 ± 5.4 | −69.5 ± 6.3 | −72.4 ± 3.8 |
| Glutamatergic < Adapt. NPY, FS-PV, Adapt. VIP, Burst. VIP, < Adapt. SOM | ||||||
| (2) Input resistance (MΩ) | 370 ± 132 | 206 ± 79 | 256 ± 65 | 481 ± 153 | 623 ± 328 | 354 ± 134 |
| FS-PV << Adapt. SOM < Adapt. NPY, Glutamatergic << Adapt. VIP, Burst. VIP | ||||||
| (3) Time constant (ms) | 35.3 ± 9.9 | 16.1 ± 6.0 | 23.6 ± 8.6 | 24.7 ± 10.3 | 32.5 ± 15.7 | 24.5 ± 8.4 |
| FS-PV <<< Adapt. SOM, Adapt. NPY, Adapt. VIP, Burst. VIP, Glutamatergic | ||||||
| (4) Membrane capacitance (pF) | 104.8 ± 33.9 | 81.4 ± 22.9 | 91.8 ± 20.8 | 52.7 ± 20.7 | 55.9 ± 20.3 | 74.2 ± 23.1 |
| Adapt. VIP, Burst. VIP << Adapt. NPY, FS-PV, Adapt. SOM, Glutamatergic | ||||||
| (5) Sag index (%) | 19.8 ± 9.2 | 9.8 ± 5.5 | 28.9 ± 12.0 | 10.0 ± 5.4 | 8.1 ± 5.2 | 7.6 ± 4.3 |
| Adapt. NPY, Burst. VIP, FS-PV, Adapt. VIP <<< Glutamatergic << Adapt. SOM | ||||||
n, Number of cells, < indicates significantly smaller with p ≤ 0.05; << indicates significantly smaller with p ≤ 0.01; <<< indicates significantly smaller with p ≤ 0.001. Adapt., Adapting; Burst., bursting.
Table 5.
Just above threshold properties of different neuronal types
| Glutamatergic(n = 46) | FS-PV(n = 34) | Adapt. SOM(n = 17) | Adapt. VIP(n = 43) | Burst. VIP(n = 22) | Adapt. NPY(n = 38) | |
|---|---|---|---|---|---|---|
| (6) Rheobase (pA) | 35.4 ± 27.8 | 100.7 ± 48.0 | −5.8 ± 30.4 | 15.3 ± 17.3 | 24.4 ± 18.6 | 50.9 ± 29.2 |
| Adapt. SOM << Adapt. VIP, Burst. VIP, Glutamatergic << Adapt. NPY <<< FS-PV | ||||||
| (7) First spike latency (ms) | 124.8 ± 44.9 | 337.2 ± 258.0 | 145.0 ± 126.2 | 139.5 ± 127.9 | 83.2 ± 95.8 | 217.8 ± 209.7 |
| Burst. VIP < Glutamatergic, Adapt. VIP, Adapt. SOM, Adapt. NPY, FS-PV | ||||||
| (8) Adaptation (Hz/s) | −43.4 ± 74.8 | 2.9 ± 18.4 | −22.3 ± 25.1 | −4.4 ± 17.5 | −61.5 ± 45.4 | −0.8 ± 5.0 |
| Burst. VIP << Glutamatergic, Adapt. SOM < Adapt. VIP < Adapt. NPY, FS-PV | ||||||
| (9) Minimal steady-state frequency (Hz) | 24.8 ± 30.4 | 14.6 ± 12.3 | 16.9 ± 13.3 | 10.7 ± 8.9 | 68.4 ± 88.9 | 6.5 ± 4.3 |
| Adapt. NPY < Adapt. VIP, FS-PV, Adapt. SOM, Glutamatergic <<< Burst. VIP | ||||||
n, Number of cells; < indicates significantly smaller with p ≤ 0.05; << indicates significantly smaller with p ≤ 0.01; <<< indicates significantly smaller with p ≤ 0.001. Adapt., Adapting; Burst., bursting.
Table 7.
Action potentials properties of different neuronal types
| Glutamatergic(n = 46) | FS-PV(n = 34) | Adapt. SOM(n = 17) | Adapt. VIP(n = 43) | Burst. VIP(n = 22) | Adapt. NPY(n = 38) | |
|---|---|---|---|---|---|---|
| (15) First spike amplitude (mV) | 93.0 ± 7.2 | 81.9 ± 7.8 | 92.6 ± 10.2 | 95.1 ± 8.5 | 97.9 ± 10.3 | 89.4 ± 9.4 |
| FS-PV <<< Adapt. NPY, Adapt. SOM, Glutamatergic, Adapt. VIP, Burst. VIP | ||||||
| (16) Second spike amplitude (mV) | 86.0 ± 11.1 | 80.2 ± 8.6 | 88.9 ± 9.4 | 90.3 ± 8.3 | 80.2 ± 10.7 | 85.6 ± 10.1 |
| FS-PV, Burst. VIP < Adapt. NPY, Glutamatergic, Adapt. SOM, Adapt. VIP | ||||||
| (17) First spike duration (ms) | 1.4 ± 0.2 | 0.6 ± 0.1 | 0.9 ± 0.2 | 0.9 ± 0.3 | 0.9 ± 0.3 | 1.0 ± 0.2 |
| FS-PV <<< Adapt. SOM, Adapt. VIP, Burst. VIP, Adapt. NPY <<< Glutamatergic | ||||||
| (18) Second spike duration (ms) | 1.6 ± 0.3 | 0.6 ± 0.1 | 1.0 ± 0.3 | 1.0 ± 0.3 | 1.1 ± 0.3 | 1.1 ± 0.2 |
| FS-PV <<< Adapt. SOM, Adapt. VIP, Adapt. NPY, Burst. VIP <<< Glutamatergic | ||||||
| (19) Amplitude Reduction (%) | 7.6 ± 8.9 | 2.0 ± 6.6 | 3.9 ± 3.4 | 5.3 ± 5.6 | 17.8 ± 8.8 | 4.2 ± 4.9 |
| FS-PV < Adapt. SOM, Adapt. NPY, Adapt. VIP Glutamatergic <<< Burst. VIP | ||||||
| (20) Duration Increase (%) | 9.9 ± 11.6 | 1.5 ± 5.2 | 7.1 ± 4.4 | 4.7 ± 5.6 | 14.6 ± 9.7 | 10.3 ± 9.2 |
| FS-PV <<< Adapt. VIP, Adapt. SOM, Glutamatergic, Adapt. NPY < Burst. VIP | ||||||
| (21) First spike, first component AHP (mV) | −6.9 ± 4.0 | −22.6 ± 3.4 | −12.2 ± 4.6 | −11.8 ± 4.3 | −11.6 ± 3.8 | −14.5 ± 3.8 |
| FS-PV <<< Adapt. NPY < Adapt. SOM, Adapt. VIP, Burst. VIP <<< Glutamatergic | ||||||
| (22) First spike, second component AHP (mV) | −8.4 ± 6.9 | −4.3 ± 7.4 | −5.1 ± 4.2 | −8.8 ± 2.9 | −0.5 ± 2.5 | −11.7 ± 7.5 |
| Adapt. NPY < Adapt. VIP, Glutamatergic, Adapt. SOM, FS-PV, Burst. VIP | ||||||
| (23) Second spike, first component AHP (mV) | −8.8 ± 4.3 | −23 ± 3.7 | −10.6 ± 7.6 | −12.9 ± 4.6 | −13.4 ± 3.6 | −16.6 ± 4.3 |
| FS-PV <<< Adapt. NPY << Burst. VIP, Adapt. VIP, Adapt. SOM < Glutamatergic | ||||||
| (24) Second spike, second component AHP (mV) | −14.8 ± 8.7 | −4.4 ± 7.5 | −6.1 ± 4.2 | −10.1 ± 3.4 | −5.3 ± 6.8 | −9.2 ± 9.6 |
| Glutamatergic << Adapt. VIP, Adapt. NPY, Adapt. SOM, Burst. VIP, FS-PV | ||||||
| (25) First spike, first AHP component latency (ms) | 14.9 ± 21.7 | 2.7 ± 1.1 | 3.4 ± 1.1 | 3.4 ± 1.1 | 3.1 ± 1.1 | 5.3 ± 2.2 |
| FS-PV < Burst. VIP, Adapt. SOM, Adapt. VIP <<< Adapt. NPY << Glutamatergic | ||||||
| (26) First spike, second AHP component latency (ms) | 47.4 ± 41.8 | 2.8 ± 5.1 | 25.6 ± 17.9 | 31.8 ± 16.4 | 2.6 ± 12.2 | 14.8 ± 10.2 |
| Burst. VIP, FS-PV <<< Adapt. NPY < Adapt. SOM, Adapt. VIP, Glutamatergic | ||||||
| (27) Second spike, first AHP component latency (ms) | 19.4 ± 24.1 | 2.7 ± 1.2 | 3.5 ± 1.2 | 3.8 ± 2.0 | 3.8 ± 1.6 | 7.8 ± 4.8 |
| FS-PV << Adapt. SOM, Burst. VIP, Adapt. VIP <<< Adapt. NPY < Glutamatergic | ||||||
| (28) Second spike, second AHP component latency (ms) | 58.8 ± 38.4 | 3.2 ± 5.7 | 27.2 ± 19.4 | 31.3 ± 14.5 | 18.9 ± 24 | 10.9 ± 10.1 |
| FS-PV, Adapt. NPY, Burst. VIP, Adapt. SOM, Adapt. VIP << Glutamatergic | ||||||
| (29) first spike ADP (mV) | 1.3 ± 1.7 | 1.1 ± 2.0 | 4.3 ± 3.0 | 5.8 ± 3.8 | 0.1 ± 0.5 | 0.3 ± 0.5 |
| Burst. VIP, Adapt. NPY, FS-PV, Glutamatergic <<< Adapt. SOM, Adapt. VIP | ||||||
| (30) Second spike ADP (mV) | 0.3 ± 0.5 | 1.1 ± 2.1 | 3.3 ± 2.4 | 4.7 ± 3.5 | 1.7 ± 3.3 | 0.1 ± 0.2 |
| Adapt. NPY, Glutamatergic, FS-PV, Burst. VIP < Adapt. SOM, Adapt. VIP | ||||||
| (31) First spike ADP latency (ms) | 5.8 ± 6.1 | 1.6 ± 2.7 | 9.7 ± 6.8 | 9.7 ± 2.9 | 0.7 ± 3.2 | 3.4 ± 3.6 |
| Burst. VIP, FS-PV < Adapt. NPY, Glutamatergic, Adapt. SOM, Adapt. VIP | ||||||
| (32) Second spike ADP latency (ms) | 3.5 ± 4.2 | 1.5 ± 2.6 | 7.6 ± 5.1 | 9.3 ± 3.7 | 2.5 ± 4.1 | 1.8 ± 2.9 |
| FS-PV, Adapt. NPY, Burst. VIP, Glutamatergic << Adapt. SOM, Adapt. VIP | ||||||
n, Number of cells; < indicates significantly smaller with p ≤ 0.05; << indicates significantly smaller with p ≤ 0.01; <<< indicates significantly smaller with p ≤ 0.001. Adapt., Adapting; Burst., bursting.
Table 6.
Firing properties of different neuronal types
| Glutamatergic(n = 46) | FS-PV(n = 34) | Adapt. SOM(n = 17) | Adapt. VIP(n = 43) | Burst. VIP(n = 22) | Adapt. NPY(n = 38) | |
|---|---|---|---|---|---|---|
| (10) Amplitude accommodation (mV) | 24.2 ± 8.9 | 1.2 ± 1.2 | 3.6 ± 3.3 | 6.9 ± 5.8 | 9.1 ± 7.1 | 9.4 ± 7.0 |
| FS-PV << Adapt. SOM < Adapt. VIP, Burst. VIP, Adapt. NPY <<< Glutamatergic | ||||||
| (11) Amplitude of early adaptation (Hz) | 155.7 ± 62.6 | 55.7 ± 25.4 | 91.3 ± 24.1 | 111.0 ± 42.8 | 115.6 ± 41.0 | 124.1 ± 37.0 |
| FS-PV <<< Adapt. SOM < Adapt. VIP, Burst. VIP, Adapt. NPY < Glutamatergic | ||||||
| (12) Time constant of early adaptation (ms) | 25.7 ± 11.6 | 21.5 ± 17.3 | 39.0 ± 7.0 | 25.8 ± 11.3 | 27.2 ± 9.0 | 25.7 ± 6.0 |
| FS-PV < Glutamatergic, Adapt. NPY, Adapt. VIP, Burst. VIP <<< Adapt. SOM | ||||||
| (13) Late adaptation (Hz/s) | −9.9 ± 7.4 | −26.7 ± 13.0 | −22.6 ± 11.9 | −32.4 ± 11.7 | −25.6 ± 16.9 | −19.9 ± 9.5 |
| Adapt. VIP, FS-PV, Burst. VIP, Adapt. SOM, Adapt. NPY <<< Glutamatergic | ||||||
| (14) Maximal steady-state frequency (Hz) | 30.2 ± 8.6 | 139.2 ± 32.1 | 68.4 ± 16.7 | 74.8 ± 30.5 | 67.1 ± 27.1 | 58.8 ± 12.5 |
| Glutamatergic <<< Adapt. NPY, Burst. VIP, Adapt. SOM, Adapt. VIP <<< FS-PV | ||||||
n, Number of cells; < indicates significantly smaller with p ≤ 0.05; << indicates significantly smaller with p ≤ 0.01; <<< indicates significantly smaller with p ≤ 0.001. Adapt., Adapting; Burst., bursting.
FS-PV neurons contained a high number of primary dendrites emanating in all directions, which results in a high multipolarity value (see Table 8). The majority of FS-PV cells (n = 11 of 15) displayed a multipolar dendritic morphology (Fig. 1B,a4, a5) (see Table 8), with the remaining FS-PV neurons being either tufted (n = 2) or bipolar (n = 2). The axon of the multipolar FS-PV cells was basically restricted to their home layer with an overall configuration being compatible with basket cells (Fig. 1B,a4, a5) (Kawaguchi, 1995; Wang et al., 2002) but not with chandelier cells (Kawaguchi, 1995). The FS-PV cells with the most vertically biased dendritic trees tended to project into the neighboring layers, too.
Similarly to FS-PV neurons, adapting SOM neurons were absent from layer I and exhibited large fusiform somata (Fig. 3A; Table 2). SOM was detected in all (but one) neurons (n = 17) of this cluster and was frequently coexpressed with CB and NPY (Figs. 1A, 3B; Table 3), two molecular markers classically associated with SOM (Kubota et al., 1994; Gonchar and Burkhalter, 1997; Gonchar et al., 2007). A very low proportion of SOM neurons (n = 1 of 17) expressed NOS-1 (Fig. 1A). Remarkably, adapting SOM neurons exhibited a depolarized resting membrane potential (Table 4) and, as indicated by their low rheobase (Table 5), were electrically more excitable than any other neuronal type of the present study, in marked contrast to the FS-PV type. Another highly distinctive feature of adapting SOM neurons was the pronounced voltage sag induced by hyperpolarizing current pulses (Fig. 3A; Table 4). Typically, at high stimulation intensities, the pronounced frequency adaptation of these neurons developed slowly, resulting in a slow time constant of early frequency adaptation (Table 6). These neurons fired action potentials of a duration intermediate between FS-PV neurons and glutamatergic neurons (Table 7), making difficult their identification based on spike width.
Figure 3.
Electrophysiological and molecular analysis of an adapting SOM neuron. A, Voltage responses induced by injection of current pulses (bottom traces) of −100, −80, −60, −40, −20, +50, and + 200 pA. Note the pronounced voltage sag after the initial peak response to hyperpolarizing current pulses (bottom middle traces, arrow). A just-above-threshold current pulse (50 pA) induced a discharge of two action potentials (top middle trace). Top inset, IR videomicroscopy picture of the same neuron that presented a large and radially oriented soma, pial surface is upward (scale bar, 10 μm) (see also Fig. 1B, a6). Bottom inset, Details of the repolarization phase of the first spike (calibration: 5 mV, 50 ms). Note the complex AHP consisting of a first component AHP, an ADP, and a second component AHP. Application of a large depolarizing current (200 pA) induced a discharge of action potentials with a marked frequency adaptation and a monotonous amplitude accommodation (top trace). B, Molecular analysis of the same neuron expressing GAD65, GAD67, CB, NPY, and SOM.
Morphologically recovered adapting SOM neurons (n = 11) displayed a radially oriented dendritic arbor (Fig. 1B,a6; Table 8) and were bipolar (n = 3), tufted (n = 4), or multipolar (n = 4). Basic inspection of their axonal arbor revealed an axon ascending (n = 8 of 11) into and arborizing in layer I (n = 5 of 11) (Fig. 1B,a6), a morphological feature of SOM-expressing Martinotti cells of rats (Kawaguchi and Kubota, 1996; Cauli et al., 1997; Wang et al., 2004) and transgenic mice (Halabisky et al., 2006; Ma et al., 2006; Dumitriu et al., 2007).
In contrast to other types of NPY-expressing neurons, adapting NPY cells were the most superficial neuronal class (Table 2), and the majority of layer I neurons (n = 7 of 8) fall into this cell population. The adapting NPY cluster contained the largest proportion of NPY-expressing neurons (n = 29 of 38) (Figs. 1A, 4B,D; Table 3) and NOS-1 was more frequently detected in these neurons than in any other cell class (Figs. 1A, 4B; Table 3). Adapting NPY neurons exhibited the lowest minimal frequency of our study (Table 5), indicative of a slow spiking behavior near threshold. In addition, adapting NPY neurons fired action potentials with a biphasic afterpotential consisting of early and late component AHP (n = 28 of 38) with little or no fast ADP (n = 17 of 34) (Fig. 4A,C; Table 7) being in marked contrast with other clusters of GABAergic neurons (Table 7), which exhibited either monophasic (FS-PV neurons) or complex afterpotential waveforms (adapting SOM, VIP, and bursting VIP). Despite these considerations, it was difficult to find other discriminative electrophysiological features for adapting NPY neurons. Indeed, these cells shared some properties with other neuronal classes. For instance and similarly to FS-PV neurons, some (n = 11 of 38) adapting NPY cluster neurons displayed an acceleration of their firing rate, including two neurons that could be clearly identified as delayed cells (data not shown). Conversely, high stimulation intensity resulted in a marked frequency adaptation and a pronounced amplitude accommodation (Fig. 4A,C; Table 6), two physiological behaviors also observed in VIP-expressing neurons (Cauli et al., 2000) but not in other GABAergic neuronal classes.
Figure 4.

Electrophysiological and molecular analysis of two adapting NPY neurons. A, Current-clamp recordings obtained in response to application of current pulses (bottom traces) of −100, −80, −60, −40, −20, +40, and +200 pA. Just-above-threshold current (40 pA) induced the delayed firing of action potentials (middle trace). Top inset, IR videomicroscopy picture of the same neuron that presented a radially oriented soma, pial surface is upward (scale bar, 10 μm). Bottom inset, Details of the complex repolarization phase of the first action potential (calibration: 5 mV, 50 ms) consisting of a first and a second component AHP separated by a small ADP. Larger current pulse (200 pA) evoked a pronounced frequency adaptation and amplitude accommodation (top trace, asterisk). B, RT-mPCR analysis showing expression of GAD65, GAD67, NOS-1, and NPY. C, Voltage responses evoked by injection of currents (bottom traces) of −100, −80, −60, −40, −20, +40, and + 350 pA. Just-above-threshold current (40 pA) induced the firing of action potentials with complex repolarization (middle trace). Top inset, IR videomicroscopy picture of the same neuron that presented a small and radially oriented soma, pial surface is upward (scale bar, 10 μm) (see also Fig. 1B, a10). Bottom inset, Details of the complex repolarization of the first spike (calibration: 5 mV, 50 ms) consisting of a fast and a slow component separated by a small ADP. Larger current pulse (350 pA) evoked a pronounced frequency adaptation and amplitude accommodation (top trace, asterisk). D, RT-mPCR analysis showing expression of GAD65, GAD67, and NPY in the neuron shown in C.
Similarly to FS-PV neurons, morphologically examined adapting NPY neurons (n = 21) displayed a large number of primary dendrites emanating in all direction (Fig. 1B,a9, a10). The dendritic arbor was most evenly distributed, resulting in a relatively high multipolarity value (Table 8). In addition, the compact dendritic arbors exhibited a small vertical span and verticality (Table 8). Adapting NPY neurons were multipolar (n = 13), tufted (n = 5), or bipolar (n = 3) at the somatodendritic level. Basic examination of the axon of adapting NPY neurons revealed, in most instances (n = 7 of 8), a very thin and dense axon ramifying in all directions (Fig. 1B,a9, a10) resembling those of neurogliaform neurons (Kawaguchi, 1995; Hestrin and Armstrong, 1996; Zhou and Hablitz, 1996; Tamás et al., 2003; Povysheva et al., 2007).
Classes of infrequently NPY-expressing cortical neurons
In addition to the three types of NPY-expressing cells described above, Ward's clustering retrieved three other neuronal groups (i.e., glutamatergic, adapting VIP, and bursting VIP) corresponding to previously described populations (McCormick et al., 1985; Connors and Gutnick, 1990; Kawaguchi and Kubota, 1996; Cauli et al., 1997, 2000; Staiger et al., 2004).
Glutamatergic neurons, absent from layer I, were among the deepest neurons of our study and exhibited small somata (Fig. 5A,C; Table 2), These cells displayed either adapting (originally referred as “regular spiking”; n = 33) (Fig. 5A) (Mountcastle et al., 1969; McCormick et al., 1985; Connors and Gutnick, 1990) or intrinsically bursting (n = 13) (Fig. 5C) firing behaviors. Adapting cells were found in layers II–IV, whereas, and in good agreement with previous reports (McCormick et al., 1985; Connors and Gutnick, 1990; Schubert et al., 2003; Staiger et al., 2004), bursting cells were almost exclusively found in layer IV, except for one neuron located in layer III (cf. de Kock and Sakmann, 2008). Glutamatergic neurons were characterized by a hyperpolarized resting membrane potential (Table 4) and a relatively pronounced voltage sag (Fig. 5A,C; Table 4). Remarkably, and in good agreement with previous observations (McCormick et al., 1985; Connors and Gutnick, 1990; Kawaguchi, 1993; Cauli et al., 1997, 2000), glutamatergic neurons fired long-duration action potentials with marked amplitude reduction and duration increase (Fig. 5A,C; Table 7). Their first AHP components were distinctly long lasting and of small amplitude (Fig. 5A,C; Table 7). At high stimulation intensities, glutamatergic neurons also exhibited a marked spike amplitude accommodation, a pronounced early frequency adaptation (Fig. 5A,C; Table 6), and a low maximal steady-state frequency (Table 6), which were also distinctive features.
Figure 5.

Electrophysiological and molecular analysis of glutamatergic neurons. A, Current-clamp recordings of an adapting cell obtained in response to application of current pulses (bottom traces) of −100, −80, −60, −40, −20, +40 and, +210 pA. In response to just-above-threshold current pulse (40 pA), this adapting neuron fired action potentials with little frequency adaptation (middle trace). Top inset, IR videomicroscopy picture of the same neuron that presented a small and round soma, pial surface is upward (scale bar, 10 μm). Bottom inset, Details of the repolarization phase of the first spike (calibration: 5 mV, 50 ms) disclosing a biphasic AHP (dotted line) consisting of a first and second component. Injection of a large depolarizing current (210 pA; top trace) induced a pronounced frequency adaptation and a transient reduction of action potential amplitude (accommodation amplitude, asterisk). B, Agarose gel analysis of the RT-mPCR products of the same regular spiking neuron expressing vGluT1. The band migrating above 600 bp corresponds to unspecific amplification. C, Voltage response of a bursting neuron evoked by current pulses (bottom traces) of −100, −80, −60, −40, −20, +40, and +100 pA. Note the pronounced voltage sag after the initial peak response to hyperpolarizing current pulses (middle traces, arrow). In response to just-above-threshold current pulse (40 pA; top middle trace), this bursting cell discharged a burst of two action potentials on a depolarizing hump. Top inset, IR videomicroscopy picture of the same neuron that presented a small and round soma, pial surface is upward (scale bar, 10 μm). Bottom inset, Details of the repolarization phase of the two first spikes showing a simple and a biphasic AHP (dotted line) for the first and the second spike, respectively (calibration: 5 mV, 50 ms). Application of a larger depolarizing current (100 pA) induced an initial burst followed by single spikes (top trace). Note the pronounced transient reduction of spikes amplitude (asterisk). D, RT-mPCR analysis showing expression of vGluT1 in the neuron presented in C.
Glutamatergic neurons were relatively homogeneous at the electrophysiological and molecular levels, but they revealed heterogeneous morphologies (Fig. 1B,a1–a3), supporting the idea that glutamatergic neurons are composed of more than one neuronal type (McCormick et al., 1985; Connors and Gutnick, 1990; Nelson et al., 2006; Sugino et al., 2006). The same characteristics were used to distinguish three types of morphology as in the study of Staiger et al. (2004). Briefly, spiny neurons in layer IV without an apical dendrite extending out of the barrel into supragranular layers were categorized as (1) spiny stellate cells. Spiny neurons with a prominent apical dendrite were divided into two additional classes: if the other primary dendrites were distributed around the whole perimeter of the cell body, then the cell was classified as (2) star pyramidal cell, and if the other (nonapical) dendrites were clustered in a zone around the basal pole of the cell body, the cell was classified as pyramidal cell. Glutamatergic neurons exhibited spiny stellate (n = 10) (Fig. 1B,a2), star pyramidal (n = 2) (Fig. 1B,a3), or pyramidal cell (n = 16) (Fig. 1B,a1), morphologies that could not be correlated with either adapting or bursting behaviors (McCormick et al., 1985; Connors and Gutnick, 1990; Staiger et al., 2004).
Although Ward's method defined two different classes of VIP-expressing neurons (i.e., adapting VIP and bursting VIP), these two neuronal groups possessed numerous common properties. Both classes were virtually (n = 64 of 65) absent from layer I, as described previously (Bayraktar et al., 2000; Gonchar et al., 2007; Uematsu et al., 2008). However, in contrast with adapting VIP neurons, bursting VIP neurons exhibited smaller and rounder somata that could not generally be categorized as fusiform (Table 2).
Adapting and bursting VIP cells were characterized by a high occurrence of VIP and CR to a lesser extent (Table 3) and exhibited the highest input resistance (Fig. 6A,C; Table 4) and the lowest membrane capacitance (Table 4) of our sample. This suggests that adapting and bursting VIP neurons might correspond to a single neuronal type whose bursting behavior can be viewed as an “uncommon” feature (Tyner, 1975). The Ward subdivision of VIP neurons in two clusters is presumably reflected by electrophysiological features affected by the high firing rate that occurs in bursts of action potentials. Indeed, bursting behavior was defined by high frequency at the onset of firing, followed by a strong adaptation (Ascoli et al., 2008); this results in higher minimal steady-state frequency and a more pronounced adaptation in bursting VIP than in adapting VIP neurons (Fig. 6C; Table 5). Bursting VIP neurons also fired action potentials (Fig. 6C) with shorter spike latency (Table 5) and displayed a more pronounced amplitude reduction and a larger-duration increase (Fig. 6C; Table 7). Conversely, adapting VIP neurons typically (n = 40 of 43) displayed complex repolarization phase of their first two action potentials consisting of a first component AHP, followed by a pronounced ADP and a late AHP component (Fig. 6A). In bursting VIP neurons, this repolarization behavior was almost never observed (n = 1 of 22; p < 0.001) for the first spike (Fig. 6C) and rarely for the second one (n = 9 of 22).
Figure 6.

Electrophysiological and molecular analysis of an adapting VIP and a bursting VIP neuron. A, Current-clamp recordings obtained in response to application of current pulses (bottom traces) of −100, −80, −60, −40, −20, +20, and +80 pA. Just-above-threshold current pulse (20 pA) induced discharge of action potential with a complex repolarization phase (middle trace) consisting of a sharp first component AHP, followed by an ADP and a second component AHP. Top inset, IR videomicroscopy picture of the same neuron that presented a radially oriented soma, pial surface is upward (scale bar, 10 μm). Bottom inset, Details of the AHP of the first spike (calibration: 5 mV, 50 ms). Application of a larger depolarizing current (80 pA) induced frequency adaptation and amplitude accommodation (top trace, asterisk). B, Agarose gel analysis of the RT-mPCR products of the same adapting VIP neuron expressing GAD67 and VIP. C, Voltage responses induced by injection of current pulses (bottom traces) of −100, −80, −60, −40, −20, +30, and +100 pA. Strong hyperpolarizing current (−100 pA) triggered the emission of a low threshold spike (middle trace, arrow). Just-above-threshold current pulse (30 pA) induced a burst of two spikes on a depolarizing hump (top middle trace). Top inset, IR videomicroscopy picture of the same neuron that presented a radially oriented soma, pial surface is upward (scale bar, 10 μm) (see also Fig. 1B, a8). Bottom inset, Details of the repolarization phase of the first two spikes (calibration: 5 mV, 50 ms). Note that the first action potential was followed by a single component AHP contrarily to second spike, which displayed complex AHP. Application of a larger depolarizing current (100 pA) induced a marked frequency adaptation with pronounced amplitude accommodation (top trace, asterisk). D, Molecular analysis of the same bursting VIP neuron expressing vGluT1, GAD65, GAD67, CB, PV, and VIP.
In good agreement with previous reports (Cauli et al., 1997; Porter et al., 1998), both adapting VIP and bursting VIP neurons displayed the lowest and the most polarized number of primary dendrites, which formed a slender vertical dendritic tree (Fig. 1B,a7, a8; Table 8) spanning at least layers I–IV (some of them reaching layer Vb or VI). VIP cells were indeed dominated by bipolar (n = 11 of 23) and tufted (n = 9) somatodendritic morphology, the remaining neurons (n = 3) being multipolar. As previously observed for both adapting and bursting VIP neurons (Kawaguchi and Kubota, 1996; Cauli et al., 1997; Porter et al., 1998), their axonal arbor was mainly descending (Fig. 1B,a7, a8) and, in some cases, reached the border of the white matter (Fig. 1B,a7). The VIP cells with multipolar morphology (n = 3 of 23; data not shown) could belong to the small basket cell population (Kawaguchi and Kubota, 1996; Wang et al., 2002). The difference in firing pattern of VIP neurons was not found to correlate with other differences of connectivity (Porter et al., 1998), pharmacological profile (Porter et al., 1999; Cauli et al., 2000; Férézou et al., 2002, 2007), or morphology (Kawaguchi and Kubota, 1996; Cauli et al., 1997; Porter et al., 1998; Wang et al., 2002). This strongly argues in favor of adapting VIP and bursting VIP neurons as being a single neuronal type that can exhibit an “uncommon” feature (burst of action potential) in a polythetic classification scheme (Tyner, 1975).
Validation of Ward's clustering
The bottom-up approach of Ward's clustering provides a hierarchic classification but can constitute as well a limitation. Indeed, single cells are assigned early to a branch of the tree without the possibility to correct this initial assignment. This can result in a relatively poor accuracy of clusters, especially at higher levels of clustering. In contrast, K-means clustering (MacQueen, 1967; Hartigan and Wong, 1979) generates clusters for a given preimposed number of K clusters (see Materials and Methods) in a top-down manner. Suboptimal attributions of cells to specific clusters can be detected and corrected dynamically across the algorithm iterations. Therefore, this method potentially achieves a more statistically significant discrimination between cellular clusters, the major difficulty being to determine the optimal number of clusters K.
The reliability of Ward's clustering was then assessed by comparing it with the clusters generated by the K-means method (see Materials and Methods). The lowest K value generating clusters matching all the three Ward's clusters of NPY neurons was obtained for K = 7 (Fig. 7A). For this value, 94, 82, and 95% of FS-PV, adapting SOM, and adapting NPY neurons, respectively, were matching the corresponding Ward's clusters (Fig. 7A). In addition, K-means clustering also generated three glutamatergic clusters, strictly included within the Ward's glutamatergic cluster, and were merged into a single glutamatergic cluster for the sake of simplicity. Finally, a single cluster of VIP neurons containing the Ward's adapting and bursting VIP clusters was generated (Fig. 7A,B) (supplemental Tables S1–S5, available at www.jneurosci.org as supplemental material). Interestingly, K means could not generate a separated cluster matching the Ward's bursting VIP cluster. This further indicates that adapting VIP and bursting VIP neurons share important similarities (see above). The smaller K value matching all the clusters of the reference Ward clustering, including the bursting VIP cluster, was K = 12. Interestingly, for this value, additional subdivisions of the Ward adapting VIP and adapting NPY clusters were also generated (supplemental Fig. S1, Tables S6–S10, available at www.jneurosci.org as supplemental material). One of the adapting NPY subclusters (n = 26, adapting NPY 2 subcluster) was characterized by a higher occurrence of NOS-1 associated with a higher rheobase (supplemental Tables S6, S8, available at www.jneurosci.org as supplemental material) and larger spike amplitudes. Interestingly, all neurons of the left branch of the Ward adapting NPY cluster (n = 8) (Fig. 1A) expressed NOS-1. It was, however, difficult for both Ward and K-means clustering to find striking distinctive electrophysiological feature(s) allowing a clear-cut discrimination of adapting NPY (and VIP) neurons into robust subclasses.
Figure 7.
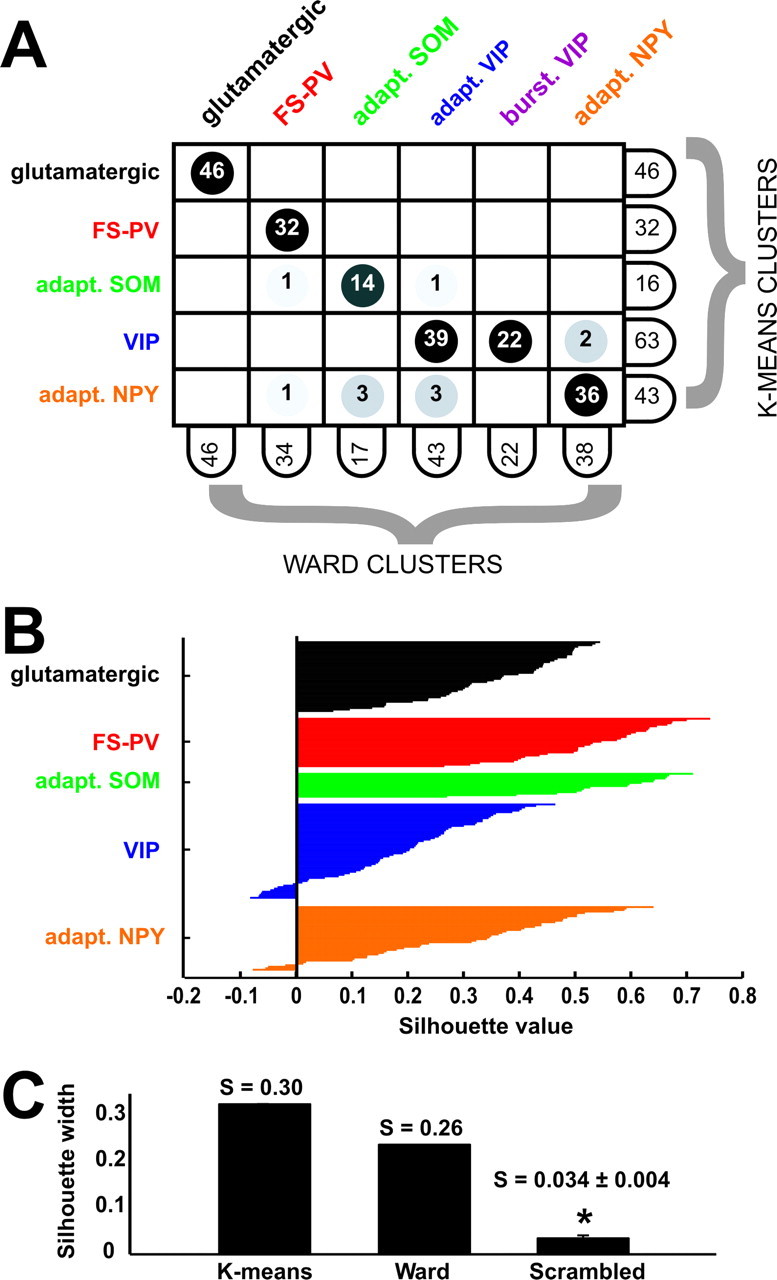
Comparison of clustering algorithms. A, The clustering generated by K means for K = 7 (3 glutamatergic clusters merged) is mostly consistent with the reference Ward's clustering but lacks a distinction between bursting VIP and adapting VIP subtypes. This is shown by this matching table, describing the intersection relations between K-means and Ward clusters. The labels attached to columns and rows display the numbers of cells within the corresponding cluster. Entries of the table indicate how many cells of a K-means cluster are contained within a given Ward cluster. B, Silhouette plot of the K-means clustering. Vertical axis, Within each cluster, cells are ranked in decreasing order of their silhouette values. This provides a graphical representation of the compactness of each individual cluster. Horizontal axis represents the silhouette values S(i) for each individual data point (large silhouette value, data point close to its cluster centroid; negative silhouette, data point closer to the centroid of a different cluster; see Materials and Methods). C, Comparison between the silhouette width for the K-means clustering and the Ward clustering of the original dataset and the average silhouette width of randomized databases. Scrambling of the dataset is associated with a consistent loss of quality in the clustering. Error bar of the scrambled silhouette width is evaluated by SD over 1000 independent randomizations.
Similarly, K-means clustering restricted to the sample of NPY-positive neurons (n = 63) also reliably reproduced the three classes of NPY neurons for a K value as small as K = 3. For this value, 80, 100, and 93% of FS-PV, adapting SOM, and adapting NPY neurons, respectively, were matching the reference Ward's cluster of frequently NPY-expressing neurons (supplemental Fig. S2A, available at www.jneurosci.org as supplemental material). The remaining NPY cells, corresponding mainly to adapting and bursting VIP neurons, were grouped with adapting NPY neurons. A K value of K = 4, for which the matching of the three types of frequently expressing NPY neurons was maintained, was necessary to segregate adapting/bursting VIP neurons from adapting NPY neurons (supplemental Fig. S2B, available at www.jneurosci.org as supplemental material). Interestingly, for K = 5, K-means algorithm also reproduced the subdivision of adapting NPY cells in adapting NPY 1 and NPY 2 neurons but preserved the matching of FS-PV and adapting SOM neurons (supplemental Fig. S2C, available at www.jneurosci.org as supplemental material). These observations indicate that unsupervised clustering limited to NPY-expressing neurons did not improve the discrimination between NPY neuron subtypes but notably matched the cluster subdivision obtained by K means over the whole sample.
The overall quality of the reference Ward's clustering and of the K-means clustering was evaluated by computing their silhouette width (see Materials and Methods). The silhouette width of the Ward's clustering was S(Ward) = 0.26, and the silhouette width of the retained K-means clustering (i.e., K = 7 with merged glutamatergic clusters) was S(K-means) = 0.30 (Fig. 7C). K-means method provided therefore a refined quality unsupervised classification of the analyzed cells, in substantial agreement with the Ward's method, as shown by the elevated degree of matching between the two clusterings (Fig. 7A).
To assess the statistical significance of these unsupervised classifications, comparisons were also performed with clusterings of randomized databases (see Materials and Methods). The average silhouette width of a K-means clustering of a fully randomized database (for K = 7) was S(fully randomized) = 0.034 ± 0.004, which is notably smaller than for the original nonrandomized database (overall quality reduction of 89%) (Fig. 7C). This large decrease in the quality of clustering after global randomization of the database attests that nontrivial structured correlations between the measurements of the different features do exist, leading to the possibility of a significant and robust unsupervised classification.
Relevance of the different groups of properties for the classification
For a subset of n = 68 morphologically recovered GABAergic interneurons, unsupervised clustering was also performed, taking into account the 12 somatodendritic morphological features in addition to the previously used properties (n = 43). Interestingly, the introduction of morphological descriptors did not modify significantly the obtained classification, because, starting from a value of K = 7, most of the obtained clusters matched the Ward's reference classification (supplemental Fig. S3A,B, available at www.jneurosci.org as supplemental material).
Once again, K means uncovered the potential existence of multiple adapting NPY subclusters. For instance, for K = 7, the adapting NPY cluster broke into two subclusters, and few NPY neurons belonging to other Ward's clusters grouped to form an additional adapting NPY subcluster (adapting NPY a, b, and c subclusters) (supplemental information and Tables S11–S16, available at www.jneurosci.org as supplemental material). This multiplicity of NPY clusters reflected, however, the over-representation of NPY neurons into the small database used for the full polythetic clustering (NPY expressed by n = 35 of 68 cells, i.e., 51% of cells in the database, against 31% in the full database of 200 cells). The limited number of morphologically reconstructed cells prevented to give an unambiguous simple description of the specificities of the different adapting NPY subtypes.
The full polythetic clustering over 68 GABAergic interneurons had an overall silhouette width of S = 0.27 (Fig. 8). Databases in which only layer location and morphological properties were randomized bore clusterings with an average silhouette width of S(morphological scrambled) = 0.22 ± 0.01. When only electrophysiological properties were randomized, the average silhouette width was S(electrophysiological scrambled) = 0.09 ± 0.01. Finally, when only molecular properties were randomized, the average silhouette width was S(molecular scrambled) = 0.18 ± 0.01. Thirteen morphological properties (including laminar location), 10 molecular properties, and 32 electrophysiological properties were considered in full polythetic clustering. The loss of clustering quality had therefore to be weighted by the different numbers of scrambled properties (Fig. 8). The scrambling of a single morphological property produced an average quality reduction of 1.5 ± 0.3%, the scrambling of a single electrophysiological property produced an average quality reduction of 2.0 ± 0.1%, and the scrambling of a single molecular property produced an average quality reduction of 3.3 ± 0.4%. This analysis suggests that the measurement of molecular properties is more informative than the measurement of, in order, electrophysiological and morphological properties for the correct classification of a specific cell.
Figure 8.

Full polythetic classification. Unsupervised clusterings of 68 neocortical interneurons based on laminar location and morphological, electrophysiological, and molecular properties. Comparison between the silhouette width for the full polythetic K-means clustering and the average silhouette width of randomized databases. Absolute and relative quality losses are shown for the cases of scrambling limited to morphological properties, to electrophysiological properties, or to molecular properties. Error bars of the scrambled silhouette width are evaluated by SD over 1000 independent randomizations.
Discussion
The aim of the present study was the identification and characterization of different subpopulations of NPY-expressing neurons. Electrophysiological, molecular, and morphological features of recorded neurons were determined by combining whole-cell current-clamp recordings, scRT-multiplex PCR (mPCR), and biocytin labeling. Neuronal types were defined by using two different unsupervised clustering algorithms taking simultaneously into account laminar location, as well as physiological and molecular properties. Remarkably, this classification scheme clearly disclosed an abundant population of interneurons coexpressing NPY and NOS-1 with distinctive electrophysiological, molecular, and morphological properties. In addition, it consistently retrieved two other types of NPY-expressing neurons (adapting SOM and FS-PV).
Polythetic classification schemes of cortical neurons
Our classification of cortical neurons was based on laminar location and electrophysiological and molecular features (see Materials and Methods) chosen to describe physiological and molecular phenotypes described in the literature (Ascoli et al., 2008). To (1) avoid an arbitrary choice of features considered to be “essential” for membership and (2) restrict the number of generated neuronal classes, we used a polythetic classification scheme (Tyner, 1975) that intrinsically tolerates a certain degree of variability within cell classes.
For this same reason, it is not surprising that the clusterings obtained by the Ward's and the K-means methods are slightly different. A small number of individual cells are assigned to different clusters by the two methods, but matching clusters continue to share similar average features, thus corresponding to completely equivalent polythetic classifications. The robustness of such a classification is made manifest by the fact that it is consistently generated by multiple methods belonging to qualitatively different algorithmic families. Although Ward's clustering achieves a statistically lesser significant discrimination between cellular classes than K-means clustering, this algorithm offers the advantage that it does not require any preliminary assumption about the number of cell classes.
Functional diversity of NPY-expressing interneurons types
The relevance of our classification of NPY-expressing interneurons into three main types is further supported by functional evidence. Indeed, specific function is considered to be the ultimate criterion for neuronal type definition (Ascoli et al., 2008). The well established FS-PV type (Kawaguchi and Kubota, 1993; Cauli et al., 1997) was mainly composed of basket cells (Kawaguchi and Kubota, 1993; Wang et al., 2002). These interneurons exert perisomatic inhibition (Reyes et al., 1998; Tamás et al., 2004; Freund and Katona, 2007) and form an electrically coupled network (Galarreta and Hestrin, 1999; Gibson et al., 1999). In good agreement with previous studies, approximately one-third of cortical FS-PV neurons coexpressed NPY at the mRNA (Cauli et al., 1997, 2000; Wang et al., 2002; Gallopin et al., 2006) and protein levels (Fuentealba et al., 2008), a molecular feature that correlates with the first spike latency (present study). These electrophysiological behavior is attributable to an ID-type K+ current mediated by channels composed of Kv1.1 subunits as indicated by modeling (Golomb et al., 2007), pharmacological, and immunocytochemical evidence (Goldberg et al., 2008; Povysheva et al., 2008). Based on their axon, and to a lesser extent dendrites, FS-PV basket cells can be subdivided in two subclasses: large and nest basket cells that also exhibit different firing properties, large basket cells are delayed whereas nest basket cells can be either delayed or continuous (Wang et al., 2002). However, and presumably attributable to the harvesting procedure, the axon of most of our FS-PV cells was not sufficiently stained to determine precisely their morphological subclass. Similarly, no statistically significant differences in the somatodendritic features of NPY-positive and -negative FS-PV neurons could be determined.
Adapting SOM-type interneurons corresponded mainly to Martinotti cells characterized by an ascending axon (Kawaguchi and Kubota, 1996; Cauli et al., 1997; Wang et al., 2004). Adapting SOM interneurons receive facilitating EPSPs from pyramidal cells (Reyes et al., 1998) that result in strong recurrent inhibition (Kapfer et al., 2007). Similarly to FS-PV neurons, adapting SOM cells also form a network of electrically coupled interneurons (Gibson et al., 1999) whose rhythmic activity is synchronized by group I metabotropic glutamate agonists (Beierlein et al., 2000) through the activation of the mGluR1α receptors they express (Baude et al., 1993; Cauli et al., 2000).
Remarkably, adapting NPY neurons exhibited electrophysiological and morphological properties very similar to those of neurogliaform cells (Kawaguchi, 1995; Chu et al., 2003; Simon et al., 2005; Ascoli et al., 2008) known to express α-actinin 2 (Price et al., 2005; Uematsu et al., 2008), NPY, and NOS-1 (Estrada and DeFelipe, 1998; Cauli et al., 2004; Price et al., 2005; Zaitsev et al., 2008). Neurogliaform cells, responsible for the slow GABAergic inhibition of pyramidal cells (Tamás et al., 2003; Szabadics et al., 2007) and interneurons (Oláh et al., 2007), occupy a particular place in the cortical circuit. Indeed and in contrast to FS-PV and adapting SOM interneurons, their electrical coupling is much more complex because neurogliaform cells are not only coupled with other neurogliaform cells (Chu et al., 2003) but also with FS-PV and putative adapting SOM neurons (Simon et al., 2005). Adapting NPY neurons might orchestrate a complex network composed of the three main types of NPY-expressing cells. Furthermore, these neurons exhibit pharmacological profiles distinct from other NPY-expressing interneurons but, interestingly, similar to VIP neurons because they are responsive to nicotinic (Porter et al., 1999; Christophe et al., 2002; Gulledge et al., 2007), μ-opioid (Férézou et al., 2007), and presumably 5-HT3 agonists (Zhou and Hablitz, 1999; Férézou et al., 2002).
Together, their differential connectivity and pharmacological profile indicate that FS-PV, adapting SOM, and adapting NPY neurons constitute three functionally distinct populations of NPY interneurons that now can be easily identified in acute slices within a few minutes of whole-cell recording.
Diversity of NOS-1-expressing neurons
Nitrergic neurons are usually classified according to the intensity of NADPH diaphorase staining and/or NOS-1 immunoreactivity (Dawson et al., 1991; Yan et al., 1996; Gabbott et al., 1997; Yan and Garey, 1997; Judas et al., 1999; Lee and Jeon, 2005) and to the size of their soma as type I (large and heavily labeled somata) or type II (small and lightly stained somata) neurons that differ in areal, laminar distribution and density (Bidmon et al., 1997). Immunohistochemical reports have shown that nitrergic neurons are one of the rarest neuronal population and coexpress NPY and SOM (Dawson et al., 1991; Kubota et al., 1994; Gonchar and Burkhalter, 1997; Estrada and DeFelipe, 1998; Smiley et al., 2000). This is in marked contrast with two recent studies that revealed that nitrergic interneurons constitute an abundant class of cortical neurons coexpressing NPY but not SOM (Price et al., 2005; Fuentealba et al., 2008). It appears that, because of technical considerations inherent to the weak staining of type II neurons (Lee and Jeon, 2005; Gerashchenko et al., 2008), this neuronal population has been essentially neglected, leading to an inaccurate estimation of the degree of coexpression between NOS-1 and other molecular markers. Our study confirmed a high degree of coexpression for NPY (80%, 12 of 15) but not for SOM (13%, 2 of 15). Neurons coexpressing NOS-1, NPY, and SOM were particularly rare (1.3% of our sample of GABAergic neurons) and presented relatively large somata (Table 2), two features shared by type I neurons. In contrast, the other nitrergic neurons were much more frequent and displayed relatively small somata (Table 2), indicating that they correspond to type II neurons. Interestingly, nitrergic adapting NPY neurons do not express SOM and exhibit electrophysiological and molecular features distinct from those of adapting SOM neurons. These observations indicate that type I and type II neurons constitute two functionally different neuronal populations differentially recruited within the cortical network, as suggested by their difference in electrical excitability. Interestingly, type I nitrergic neurons constitute a population of projecting GABAergic neurons (Tomioka et al., 2005; Higo et al., 2007; Tomioka and Rockland, 2007) and were found recently to be activated during sleep states (Gerashchenko et al., 2008). The puzzling coexpression of a vasodilator (NO) and a vasoconstrictor (NPY) of diving arterioles (Cauli et al., 2004) suggest that nitrergic neurons, either adapting SOM and/or adapting NPY, might actively participate in the center/surround pattern of vasodilations/vasoconstrictions that occurs in vivo under sensory stimulations (Devor et al., 2007). The valuable identification of distinctive morphological, electrophysiological, and molecular features for type I and type II nitrergic neurons will help to uncover their respective role(s) in this complex physiological process.
Footnotes
This work was supported by Human Frontier Science Program Grant RGY0070/2007-C (E.M.C.H., B.C.), National Institutes of Health/National Institute of Neurological Disorders and Stroke Grants R21NS053684 and R01NS063226 (E.M.C.H.), Deutsche Forschungsgemeinschaft Grants Sta 431/5-4 and Sta 431/8-1 (J.F.S.), and Agence Nationale de la Recherche Grants “LARSEN” (D.B.) and “Neurovasc” (J.R.). We thank Antonin Blot, Nicolas Brunel, David Hansel, and Bertrand Lambolez for their valuable help.
References
- Abounader R, Hamel E. Associations between neuropeptide Y nerve terminals and intraparenchymal microvessels in rat and human cerebral cortex. J Comp Neurol. 1997;388:444–453. [PubMed] [Google Scholar]
- Allen YS, Adrian TE, Allen JM, Tatemoto K, Crow TJ, Bloom SR, Polak JM. Neuropeptide Y distribution in the rat brain. Science. 1983;221:877–879. doi: 10.1126/science.6136091. [DOI] [PubMed] [Google Scholar]
- Andjelic S, Gallopin T, Cauli B, Hill EL, Roux L, Badr S, Hu E, Tamás G, Lambolez B. Glutamatergic non-pyramidal neurons from neocortical layer VI and their comparison with pyramidal and spiny stellate neurons. J Neurophysiol. 2009;101:641–654. doi: 10.1152/jn.91094.2008. [DOI] [PMC free article] [PubMed] [Google Scholar]
- Aoki C, Pickel VM. Neuropeptide Y in the cerebral cortex and the caudate-putamen nuclei: ultrastructural basis for interactions with GABAergic and non-GABAergic neurons. J Neurosci. 1989;9:4333–4354. doi: 10.1523/JNEUROSCI.09-12-04333.1989. [DOI] [PMC free article] [PubMed] [Google Scholar]
- Ascoli GA, Alonso-Nanclares L, Anderson SA, Barrionuevo G, Benavides-Piccione R, Burkhalter A, Buzsáki G, Cauli B, Defelipe J, Fairén A, Feldmeyer D, Fishell G, Fregnac Y, Freund TF, Gardner D, Gardner EP, Goldberg JH, Helmstaedter M, Hestrin S, Karube F, et al. Petilla terminology: nomenclature of features of GABAergic interneurons of the cerebral cortex. Nat Rev Neurosci. 2008;9:557–568. doi: 10.1038/nrn2402. [DOI] [PMC free article] [PubMed] [Google Scholar]
- Bacci A, Huguenard JR, Prince DA. Differential modulation of synaptic transmission by neuropeptide Y in rat neocortical neurons. Proc Natl Acad Sci U S A. 2002;99:17125–17130. doi: 10.1073/pnas.012481899. [DOI] [PMC free article] [PubMed] [Google Scholar]
- Bannon AW, Seda J, Carmouche M, Francis JM, Norman MH, Karbon B, McCaleb ML. Behavioral characterization of neuropeptide Y knockout mice. Brain Res. 2000;868:79–87. doi: 10.1016/s0006-8993(00)02285-x. [DOI] [PubMed] [Google Scholar]
- Bao L, Kopp J, Zhang X, Xu ZQ, Zhang LF, Wong H, Walsh J, Hökfelt T. Localization of neuropeptide Y Y1 receptors in cerebral blood vessels. Proc Natl Acad Sci U S A. 1997;94:12661–12666. doi: 10.1073/pnas.94.23.12661. [DOI] [PMC free article] [PubMed] [Google Scholar]
- Baraban SC, Hollopeter G, Erickson JC, Schwartzkroin PA, Palmiter RD. Knock-out mice reveal a critical antiepileptic role for neuropeptide Y. J Neurosci. 1997;17:8927–8936. doi: 10.1523/JNEUROSCI.17-23-08927.1997. [DOI] [PMC free article] [PubMed] [Google Scholar]
- Baude A, Nusser Z, Roberts JD, Mulvihill E, McIlhinney RA, Somogyi P. The metabotropic glutamate receptor (mGluR1 alpha) is concentrated at perisynaptic membrane of neuronal subpopulations as detected by immunogold reaction. Neuron. 1993;11:771–787. doi: 10.1016/0896-6273(93)90086-7. [DOI] [PubMed] [Google Scholar]
- Bayraktar T, Staiger JF, Acsady L, Cozzari C, Freund TF, Zilles K. Co-localization of vasoactive intestinal polypeptide, gamma- aminobutyric acid and choline acetyltransferase in neocortical interneurons of the adult rat. Brain Res. 1997;757:209–217. doi: 10.1016/s0006-8993(97)00218-7. [DOI] [PubMed] [Google Scholar]
- Bayraktar T, Welker E, Freund TF, Zilles K, Staiger JF. Neurons immunoreactive for vasoactive intestinal polypeptide in the rat primary somatosensory cortex: morphology and spatial relationship to barrel-related columns. J Comp Neurol. 2000;420:291–304. [PubMed] [Google Scholar]
- Beierlein M, Gibson JR, Connors BW. A network of electrically coupled interneurons drives synchronized inhibition in neocortex. Nat Neurosci. 2000;3:904–910. doi: 10.1038/78809. [DOI] [PubMed] [Google Scholar]
- Beierlein M, Gibson JR, Connors BW. Two dynamically distinct inhibitory networks in layer 4 of the neocortex. J Neurophysiol. 2003;90:2987–3000. doi: 10.1152/jn.00283.2003. [DOI] [PubMed] [Google Scholar]
- Bidmon HJ, Wu J, Gödecke A, Schleicher A, Mayer B, Zilles K. Nitric oxide synthase-expressing neurons are area-specifically distributed within the cerebral cortex of the rat. Neuroscience. 1997;81:321–330. doi: 10.1016/s0306-4522(97)00131-0. [DOI] [PubMed] [Google Scholar]
- Cauli B, Audinat E, Lambolez B, Angulo MC, Ropert N, Tsuzuki K, Hestrin S, Rossier J. Molecular and physiological diversity of cortical nonpyramidal cells. J Neurosci. 1997;17:3894–3906. doi: 10.1523/JNEUROSCI.17-10-03894.1997. [DOI] [PMC free article] [PubMed] [Google Scholar]
- Cauli B, Porter JT, Tsuzuki K, Lambolez B, Rossier J, Quenet B, Audinat E. Classification of fusiform neocortical interneurons based on unsupervised clustering. Proc Natl Acad Sci U S A. 2000;97:6144–6149. doi: 10.1073/pnas.97.11.6144. [DOI] [PMC free article] [PubMed] [Google Scholar]
- Cauli B, Tong XK, Rancillac A, Serluca N, Lambolez B, Rossier J, Hamel E. Cortical GABA interneurons in neurovascular coupling: relays for subcortical vasoactive pathways. J Neurosci. 2004;24:8940–8949. doi: 10.1523/JNEUROSCI.3065-04.2004. [DOI] [PMC free article] [PubMed] [Google Scholar]
- Celio MR. Parvalbumin in most gamma-aminobutyric acid-containing neurons of the rat cerebral cortex. Science. 1986;231:995–997. doi: 10.1126/science.3945815. [DOI] [PubMed] [Google Scholar]
- Celio MR. Calbindin D-28k and parvalbumin in the rat nervous system. Neuroscience. 1990;35:375–475. doi: 10.1016/0306-4522(90)90091-h. [DOI] [PubMed] [Google Scholar]
- Choudhuri R, Cui L, Yong C, Bowyer S, Klein RM, Welch KM, Berman NE. Cortical spreading depression and gene regulation: relevance to migraine. Ann Neurol. 2002;51:499–506. doi: 10.1002/ana.10158. [DOI] [PubMed] [Google Scholar]
- Christophe E, Roebuck A, Staiger JF, Lavery DJ, Charpak S, Audinat E. Two types of nicotinic receptors mediate an excitation of neocortical layer I interneurons. J Neurophysiol. 2002;88:1318–1327. doi: 10.1152/jn.2002.88.3.1318. [DOI] [PubMed] [Google Scholar]
- Chu Z, Galarreta M, Hestrin S. Synaptic interactions of late-spiking neocortical neurons in layer 1. J Neurosci. 2003;23:96–102. doi: 10.1523/JNEUROSCI.23-01-00096.2003. [DOI] [PMC free article] [PubMed] [Google Scholar]
- Clausen TR, Møller M, Woldbye DP. Inhibitory effect of neuropeptide Y on morphine withdrawal is accompanied by reduced c-fos expression in specific brain regions. J Neurosci Res. 2001;64:410–417. doi: 10.1002/jnr.1092. [DOI] [PubMed] [Google Scholar]
- Connors BW, Gutnick MJ. Intrinsic firing patterns of diverse neocortical neurons. Trends Neurosci. 1990;13:99–104. doi: 10.1016/0166-2236(90)90185-d. [DOI] [PubMed] [Google Scholar]
- Dacey RG, Jr, Bassett JE, Takayasu M. Vasomotor responses of rat intracerebral arterioles to vasoactive intestinal peptide, substance P, neuropeptide Y, and bradykinin. J Cereb Blood Flow Metab. 1988;8:254–261. doi: 10.1038/jcbfm.1988.56. [DOI] [PubMed] [Google Scholar]
- Dávid C, Schleicher A, Zuschratter W, Staiger JF. The innervation of parvalbumin-containing interneurons by VIP-immunopositive interneurons in the primary somatosensory cortex of the adult rat. Eur J Neurosci. 2007;25:2329–2340. doi: 10.1111/j.1460-9568.2007.05496.x. [DOI] [PubMed] [Google Scholar]
- Dawson TM, Bredt DS, Fotuhi M, Hwang PM, Snyder SH. Nitric oxide synthase and neuronal NADPH diaphorase are identical in brain and peripheral tissues. Proc Natl Acad Sci U S A. 1991;88:7797–7801. doi: 10.1073/pnas.88.17.7797. [DOI] [PMC free article] [PubMed] [Google Scholar]
- de Kock CP, Sakmann B. High frequency action potential bursts (> or = 100 Hz) in L2/3 and L5B thick tufted neurons in anaesthetized and awake rat primary somatosensory cortex. J Physiol. 2008;586:3353–3364. doi: 10.1113/jphysiol.2008.155580. [DOI] [PMC free article] [PubMed] [Google Scholar]
- Demeulemeester H, Vandesande F, Orban GA, Brandon C, Vanderhaeghen JJ. Heterogeneity of GABAergic cells in cat visual cortex. J Neurosci. 1988;8:988–1000. doi: 10.1523/JNEUROSCI.08-03-00988.1988. [DOI] [PMC free article] [PubMed] [Google Scholar]
- Demeulemeester H, Arckens L, Vandesande F, Orban GA, Heizmann CW, Pochet R. Calcium binding proteins and neuropeptides as molecular markers of GABAergic interneurons in the cat visual cortex. Exp Brain Res. 1991;84:538–544. doi: 10.1007/BF00230966. [DOI] [PubMed] [Google Scholar]
- Devor A, Tian P, Nishimura N, Teng IC, Hillman EM, Narayanan SN, Ulbert I, Boas DA, Kleinfeld D, Dale AM. Suppressed neuronal activity and concurrent arteriolar vasoconstriction may explain negative blood oxygenation level-dependent signal. J Neurosci. 2007;27:4452–4459. doi: 10.1523/JNEUROSCI.0134-07.2007. [DOI] [PMC free article] [PubMed] [Google Scholar]
- Dodt HU, Zieglgänsberger W. Visualization of neuronal form and function in brain slices by infrared videomicroscopy. Histochem J. 1998;30:141–152. doi: 10.1023/a:1003291218707. [DOI] [PubMed] [Google Scholar]
- Dumitriu D, Cossart R, Huang J, Yuste R. Correlation between axonal morphologies and synaptic input kinetics of interneurons from mouse visual cortex. Cereb Cortex. 2007;17:81–91. doi: 10.1093/cercor/bhj126. [DOI] [PubMed] [Google Scholar]
- Estrada C, DeFelipe J. Nitric oxide-producing neurons in the neocortex: morphological and functional relationship with intraparenchymal microvasculature. Cereb Cortex. 1998;8:193–203. doi: 10.1093/cercor/8.3.193. [DOI] [PubMed] [Google Scholar]
- Férézou I, Cauli B, Hill EL, Rossier J, Hamel E, Lambolez B. 5-HT3 receptors mediate serotonergic fast synaptic excitation of neocortical vasoactive intestinal peptide/cholecystokinin interneurons. J Neurosci. 2002;22:7389–7397. doi: 10.1523/JNEUROSCI.22-17-07389.2002. [DOI] [PMC free article] [PubMed] [Google Scholar]
- Férézou I, Hill EL, Cauli B, Gibelin N, Kaneko T, Rossier J, Lambolez B. Extensive overlap of μ-opioid and nicotinic sensitivity in cortical interneurons. Cereb Cortex. 2007;17:1948–1957. doi: 10.1093/cercor/bhl104. [DOI] [PubMed] [Google Scholar]
- Fisher RA, Yates F. Statistical tables for biological, agricultural and medical research. Edinburgh: Oliver and Boyd; 1963. [Google Scholar]
- Freund TF, Katona I. Perisomatic inhibition. Neuron. 2007;56:33–42. doi: 10.1016/j.neuron.2007.09.012. [DOI] [PubMed] [Google Scholar]
- Fuentealba P, Begum R, Capogna M, Jinno S, Márton LF, Csicsvari J, Thomson A, Somogyi P, Klausberger T. Ivy cells: a population of nitric-oxide-producing, slow-spiking GABAergic neurons and their involvement in hippocampal network activity. Neuron. 2008;57:917–929. doi: 10.1016/j.neuron.2008.01.034. [DOI] [PMC free article] [PubMed] [Google Scholar]
- Gabbott PL, Dickie BG, Vaid RR, Headlam AJ, Bacon SJ. Local-circuit neurones in the medial prefrontal cortex (areas 25, 32 and 24b) in the rat: morphology and quantitative distribution. J Comp Neurol. 1997;377:465–499. doi: 10.1002/(sici)1096-9861(19970127)377:4<465::aid-cne1>3.0.co;2-0. [DOI] [PubMed] [Google Scholar]
- Galarreta M, Hestrin S. A network of fast-spiking cells in the neocortex connected by electrical synapses. Nature. 1999;402:72–75. doi: 10.1038/47029. [DOI] [PubMed] [Google Scholar]
- Gallopin T, Geoffroy H, Rossier J, Lambolez B. Cortical sources of CRF, NKB, and CCK and their effects on pyramidal cells in the neocortex. Cereb Cortex. 2006;16:1440–1452. doi: 10.1093/cercor/bhj081. [DOI] [PubMed] [Google Scholar]
- Gerashchenko D, Wisor JP, Burns D, Reh RK, Shiromani PJ, Sakurai T, de la Iglesia HO, Kilduff TS. Identification of a population of sleep-active cerebral cortex neurons. Proc Natl Acad Sci USA. 2008;105:10227–10232. doi: 10.1073/pnas.0803125105. [DOI] [PMC free article] [PubMed] [Google Scholar]
- Gibson JR, Beierlein M, Connors BW. Two networks of electrically coupled inhibitory neurons in neocortex. Nature. 1999;402:75–79. doi: 10.1038/47035. [DOI] [PubMed] [Google Scholar]
- Goldberg EM, Clark BD, Zagha E, Nahmani M, Erisir A, Rudy B. K+ channels at the axon initial segment dampen near-threshold excitability of neocortical fast-spiking GABAergic interneurons. Neuron. 2008;58:387–400. doi: 10.1016/j.neuron.2008.03.003. [DOI] [PMC free article] [PubMed] [Google Scholar]
- Golomb D, Donner K, Shacham L, Shlosberg D, Amitai Y, Hansel D. Mechanisms of firing patterns in fast-spiking cortical interneurons. PLoS Comput Biol. 2007;3:e156. doi: 10.1371/journal.pcbi.0030156. [DOI] [PMC free article] [PubMed] [Google Scholar]
- Gonchar Y, Burkhalter A. Three distinct families of GABAergic neurons in rat visual cortex. Cereb Cortex. 1997;7:347–358. doi: 10.1093/cercor/7.4.347. [DOI] [PubMed] [Google Scholar]
- Gonchar Y, Wang Q, Burkhalter A. Multiple distinct subtypes of GABAergic neurons in mouse visual cortex identified by triple immunostaining. Front Neuroanat. 2007;1:3. doi: 10.3389/neuro.05.003.2007. [DOI] [PMC free article] [PubMed] [Google Scholar]
- Görcs TJ, Léránth C, MacLusky NJ. The use of gold-substituted silver-intensified diaminobenzidine (DAB) and non-intensified DAB for simultaneous electron microscopic immunoperoxidase labeling of tyrosine hydroxylase and glutamic acid decarboxylase immunoreactivity in the rat medial preoptic area. J Histochem Cytochem. 1986;34:1439–1447. doi: 10.1177/34.11.2877022. [DOI] [PubMed] [Google Scholar]
- Gulledge AT, Park SB, Kawaguchi Y, Stuart GJ. Heterogeneity of phasic cholinergic signalling in neocortical neurons. J Neurophysiol. 2007;97:2215–2229. doi: 10.1152/jn.00493.2006. [DOI] [PubMed] [Google Scholar]
- Gupta A, Wang Y, Markram H. Organizing principles for a diversity of GABAergic interneurons and synapses in the neocortex. Science. 2000;287:273–278. doi: 10.1126/science.287.5451.273. [DOI] [PubMed] [Google Scholar]
- Haj-Dahmane S, Andrade R. Calcium-activated cation nonselective current contributes to the fast afterdepolarization in rat prefrontal cortex neurons. J Neurophysiol. 1997;78:1983–1989. doi: 10.1152/jn.1997.78.4.1983. [DOI] [PubMed] [Google Scholar]
- Halabisky B, Shen F, Huguenard JR, Prince DA. Electrophysiological classification of somatostatin-positive interneurons in mouse sensorimotor cortex. J Neurophysiol. 2006;96:834–845. doi: 10.1152/jn.01079.2005. [DOI] [PubMed] [Google Scholar]
- Hartigan JA, Wong MA. Algorithm AS 136: a K-means clustering algorithm. Appl Stat. 1979;28:100–108. [Google Scholar]
- Helmstaedter M, Sakmann B, Feldmeyer D. The relation between dendritic geometry, electrical excitability, and axonal projections of L2/3 interneurons in rat barrel cortex. Cereb Cortex. 2009;19:938–950. doi: 10.1093/cercor/bhn138. [DOI] [PubMed] [Google Scholar]
- Hendry SH, Jones EG, DeFelipe J, Schmechel D, Brandon C, Emson PC. Neuropeptide-containing neurons of the cerebral cortex are also GABAergic. Proc Natl Acad Sci USA. 1984a;81:6526–6530. doi: 10.1073/pnas.81.20.6526. [DOI] [PMC free article] [PubMed] [Google Scholar]
- Hendry SH, Jones EG, Emson PC. Morphology, distribution, and synaptic relations of somatostatin- and neuropeptide Y-immunoreactive neurons in rat and monkey neocortex. J Neurosci. 1984b;4:2497–2517. doi: 10.1523/JNEUROSCI.04-10-02497.1984. [DOI] [PMC free article] [PubMed] [Google Scholar]
- Hestrin S, Armstrong WE. Morphology and physiology of cortical neurons in layer I. J Neurosci. 1996;16:5290–5300. doi: 10.1523/JNEUROSCI.16-17-05290.1996. [DOI] [PMC free article] [PubMed] [Google Scholar]
- Higo S, Udaka N, Tamamaki N. Long-range GABAergic projection neurons in the cat neocortex. J Comp Neurol. 2007;503:421–431. doi: 10.1002/cne.21395. [DOI] [PubMed] [Google Scholar]
- Hodgkin AL. The local electric changes associated with repetitive action in a non-medullated axon. J Physiol. 1948;107:165–181. doi: 10.1113/jphysiol.1948.sp004260. [DOI] [PMC free article] [PubMed] [Google Scholar]
- Jacobowitz DM, Winsky L. Immunocytochemical localization of calretinin in the forebrain of the rat. J Comp Neurol. 1991;304:198–218. doi: 10.1002/cne.903040205. [DOI] [PubMed] [Google Scholar]
- Jin X, Mathers PH, Szabo G, Katarova Z, Agmon A. Vertical bias in dendritic trees of non-pyramidal neocortical neurons expressing GAD67-GFP in vitro. Cereb Cortex. 2001;11:666–678. doi: 10.1093/cercor/11.7.666. [DOI] [PubMed] [Google Scholar]
- Judas M, Sestan N, Kostoviæ I. Nitrinergic neurons in the developing and adult human telencephalon: transient and permanent patterns of expression in comparison to other mammals. Microsc Res Tech. 1999;45:401–419. doi: 10.1002/(SICI)1097-0029(19990615)45:6<401::AID-JEMT7>3.0.CO;2-Q. [DOI] [PubMed] [Google Scholar]
- Kapfer C, Glickfeld LL, Atallah BV, Scanziani M. Supralinear increase of recurrent inhibition during sparse activity in the somatosensory cortex. Nat Neurosci. 2007;10:743–753. doi: 10.1038/nn1909. [DOI] [PMC free article] [PubMed] [Google Scholar]
- Karube F, Kubota Y, Kawaguchi Y. Axon branching and synaptic bouton phenotypes in GABAergic nonpyramidal cell subtypes. J Neurosci. 2004;24:2853–2865. doi: 10.1523/JNEUROSCI.4814-03.2004. [DOI] [PMC free article] [PubMed] [Google Scholar]
- Kawaguchi Y. Groupings of nonpyramidal and pyramidal cells with specific physiological and morphological characteristics in rat frontal cortex. J Neurophysiol. 1993;69:416–431. doi: 10.1152/jn.1993.69.2.416. [DOI] [PubMed] [Google Scholar]
- Kawaguchi Y. Physiological subgroups of nonpyramidal cells with specific morphological characteristics in layer II/III of rat frontal cortex. J Neurosci. 1995;15:2638–2655. doi: 10.1523/JNEUROSCI.15-04-02638.1995. [DOI] [PMC free article] [PubMed] [Google Scholar]
- Kawaguchi Y, Kubota Y. Correlation of physiological subgroupings of nonpyramidal cells with parvalbumin- and calbindinD28k-immunoreactive neurons in layer V of rat frontal cortex. J Neurophysiol. 1993;70:387–396. doi: 10.1152/jn.1993.70.1.387. [DOI] [PubMed] [Google Scholar]
- Kawaguchi Y, Kubota Y. Physiological and morphological identification of somatostatin- or vasoactive intestinal polypeptide-containing cells among GABAergic cell subtypes in rat frontal cortex. J Neurosci. 1996;16:2701–2715. doi: 10.1523/JNEUROSCI.16-08-02701.1996. [DOI] [PMC free article] [PubMed] [Google Scholar]
- Kubota Y, Hattori R, Yui Y. Three distinct subpopulations of GABAergic neurons in rat frontal agranular cortex. Brain Res. 1994;649:159–173. doi: 10.1016/0006-8993(94)91060-x. [DOI] [PubMed] [Google Scholar]
- Kuljis RO, Rakic P. Distribution of neuropeptide Y-containing perikarya and axons in various neocortical areas in the macaque monkey. J Comp Neurol. 1989a;280:383–392. doi: 10.1002/cne.902800305. [DOI] [PubMed] [Google Scholar]
- Kuljis RO, Rakic P. Multiple types of neuropeptide Y-containing neurons in primate neocortex. J Comp Neurol. 1989b;280:393–409. doi: 10.1002/cne.902800306. [DOI] [PubMed] [Google Scholar]
- Lambolez B, Audinat E, Bochet P, Crépel F, Rossier J. AMPA receptor subunits expressed by single Purkinje cells. Neuron. 1992;9:247–258. doi: 10.1016/0896-6273(92)90164-9. [DOI] [PubMed] [Google Scholar]
- Lee JE, Jeon CJ. Immunocytochemical localization of nitric oxide synthase-containing neurons in mouse and rabbit visual cortex and co-localization with calcium-binding proteins. Mol Cells. 2005;19:408–417. [PubMed] [Google Scholar]
- Ma Y, Hu H, Berrebi AS, Mathers PH, Agmon A. Distinct subtypes of somatostatin-containing neocortical interneurons revealed in transgenic mice. J Neurosci. 2006;26:5069–5082. doi: 10.1523/JNEUROSCI.0661-06.2006. [DOI] [PMC free article] [PubMed] [Google Scholar]
- MacQueen JB. Some methods of classification and analysis of multivariate observations. Proceedings of the fifth Berkeley symposium in mathematical statistics and probability; Berkeley, CA: University of California; 1967. pp. 281–297. [Google Scholar]
- McCormick DA, Connors BW, Lighthall JW, Prince DA. Comparative electrophysiology of pyramidal and sparsely spiny stellate neurons of the neocortex. J Neurophysiol. 1985;54:782–806. doi: 10.1152/jn.1985.54.4.782. [DOI] [PubMed] [Google Scholar]
- Morrison JH, Magistretti PJ, Benoit R, Bloom FE. The distribution and morphological characteristics of the intracortical VIP-positive cell: an immunohistochemical analysis. Brain Res. 1984;292:269–282. doi: 10.1016/0006-8993(84)90763-7. [DOI] [PubMed] [Google Scholar]
- Mountcastle VB, Talbot WH, Sakata H, Hyvärinen J. Cortical neuronal mechanisms in flutter-vibration studied in unanesthetized monkeys. Neuronal periodicity and frequency discrimination. J Neurophysiol. 1969;32:452–484. doi: 10.1152/jn.1969.32.3.452. [DOI] [PubMed] [Google Scholar]
- Nelson SB, Sugino K, Hempel CM. The problem of neuronal cell types: a physiological genomics approach. Trends Neurosci. 2006;29:339–345. doi: 10.1016/j.tins.2006.05.004. [DOI] [PubMed] [Google Scholar]
- Oláh S, Komlósi G, Szabadics J, Varga C, Tóth E, Barzó P, Tamás G. Output of neurogliaform cells to various neuron types in the human and rat cerebral cortex. Front Neural Circuits. 2007;1:4. doi: 10.3389/neuro.04.004.2007. [DOI] [PMC free article] [PubMed] [Google Scholar]
- Porter JT, Cauli B, Staiger JF, Lambolez B, Rossier J, Audinat E. Properties of bipolar VIPergic interneurons and their excitation by pyramidal neurons in the rat neocortex. Eur J Neurosci. 1998;10:3617–3628. doi: 10.1046/j.1460-9568.1998.00367.x. [DOI] [PubMed] [Google Scholar]
- Porter JT, Cauli B, Tsuzuki K, Lambolez B, Rossier J, Audinat E. Selective excitation of subtypes of neocortical interneurons by nicotinic receptors. J Neurosci. 1999;19:5228–5235. doi: 10.1523/JNEUROSCI.19-13-05228.1999. [DOI] [PMC free article] [PubMed] [Google Scholar]
- Povysheva NV, Zaitsev AV, Kröner S, Krimer OA, Rotaru DC, Gonzalez-Burgos G, Lewis DA, Krimer LS. Electrophysiological differences between neurogliaform cells from monkey and rat prefrontal cortex. J Neurophysiol. 2007;97:1030–1039. doi: 10.1152/jn.00794.2006. [DOI] [PubMed] [Google Scholar]
- Povysheva NV, Zaitsev AV, Rotaru DC, Gonzalez-Burgos G, Lewis DA, Krimer LS. Parvalbumin-positive basket interneurons in monkey and rat prefrontal cortex. J Neurophysiol. 2008;100:2348–2360. doi: 10.1152/jn.90396.2008. [DOI] [PMC free article] [PubMed] [Google Scholar]
- Price CJ, Cauli B, Kovacs ER, Kulik A, Lambolez B, Shigemoto R, Capogna M. Neurogliaform neurons form a novel inhibitory network in the hippocampal CA1 area. J Neurosci. 2005;25:6775–6786. doi: 10.1523/JNEUROSCI.1135-05.2005. [DOI] [PMC free article] [PubMed] [Google Scholar]
- Reyes A, Lujan R, Rozov A, Burnashev N, Somogyi P, Sakmann B. Target-cell-specific facilitation and depression in neocortical circuits. Nat Neurosci. 1998;1:279–285. doi: 10.1038/1092. [DOI] [PubMed] [Google Scholar]
- Rogers JH. Immunohistochemical markers in rat cortex: co-localization of calretinin and calbindin-D28k with neuropeptides and GABA. Brain Res. 1992;587:147–157. doi: 10.1016/0006-8993(92)91439-l. [DOI] [PubMed] [Google Scholar]
- Rousseeuw PJ. Silhouettes: a graphical aid to the interpretation and validation of cluster analysis. J Comput Appl Math. 1987;20:53–65. [Google Scholar]
- Schubert D, Staiger JF, Cho N, Kötter R, Zilles K, Luhmann HJ. Layer-specific intracolumnar and transcolumnar functional connectivity of layer V pyramidal cells in rat barrel cortex. J Neurosci. 2001;21:3580–3592. doi: 10.1523/JNEUROSCI.21-10-03580.2001. [DOI] [PMC free article] [PubMed] [Google Scholar]
- Schubert D, Kötter R, Zilles K, Luhmann HJ, Staiger JF. Cell type-specific circuits of cortical layer IV spiny neurons. J Neurosci. 2003;23:2961–2970. doi: 10.1523/JNEUROSCI.23-07-02961.2003. [DOI] [PMC free article] [PubMed] [Google Scholar]
- Simon A, Oláh S, Molnár G, Szabadics J, Tamás G. Gap-junctional coupling between neurogliaform cells and various interneuron types in the neocortex. J Neurosci. 2005;25:6278–6285. doi: 10.1523/JNEUROSCI.1431-05.2005. [DOI] [PMC free article] [PubMed] [Google Scholar]
- Smiley JF, McGinnis JP, Javitt DC. Nitric oxide synthase interneurons in the monkey cerebral cortex are subsets of the somatostatin, neuropeptide Y, and calbindin cells. Brain Res. 2000;863:205–212. doi: 10.1016/s0006-8993(00)02136-3. [DOI] [PubMed] [Google Scholar]
- Somogyi P, Hodgson AJ, Smith AD, Nunzi MG, Gorio A, Wu JY. Different populations of GABAergic neurons in the visual cortex and hippocampus of cat contain somatostatin- or cholecystokinin-immunoreactive material. J Neurosci. 1984;4:2590–2603. doi: 10.1523/JNEUROSCI.04-10-02590.1984. [DOI] [PMC free article] [PubMed] [Google Scholar]
- Staiger JF, Schubert D, Zuschratter W, Kötter R, Luhmann HJ, Zilles K. Innervation of interneurons immunoreactive for VIP by intrinsically bursting pyramidal cells and fast-spiking interneurons in infragranular layers of juvenile rat neocortex. Eur J Neurosci. 2002;16:11–20. doi: 10.1046/j.1460-9568.2002.02048.x. [DOI] [PubMed] [Google Scholar]
- Staiger JF, Flagmeyer I, Schubert D, Zilles K, Kötter R, Luhmann HJ. Functional diversity of layer IV spiny neurons in rat somatosensory cortex: quantitative morphology of electrophysiologically characterized and biocytin labeled cells. Cereb Cortex. 2004;14:690–701. doi: 10.1093/cercor/bhh029. [DOI] [PubMed] [Google Scholar]
- Stuart GJ, Dodt HU, Sakmann B. Patch-clamp recordings from the soma and dendrites of neurons in brain slices using infrared video microscopy. Pflugers Arch. 1993;423:511–518. doi: 10.1007/BF00374949. [DOI] [PubMed] [Google Scholar]
- Sugino K, Hempel CM, Miller MN, Hattox AM, Shapiro P, Wu C, Huang ZJ, Nelson SB. Molecular taxonomy of major neuronal classes in the adult mouse forebrain. Nat Neurosci. 2006;9:99–107. doi: 10.1038/nn1618. [DOI] [PubMed] [Google Scholar]
- Szabadics J, Tamás G, Soltesz I. Different transmitter transients underlie presynaptic cell type specificity of GABAA, slow and GABAA, fast. Proc Natl Acad Sci U S A. 2007;104:14831–14836. doi: 10.1073/pnas.0707204104. [DOI] [PMC free article] [PubMed] [Google Scholar]
- Tamás G, Buhl EH, Somogyi P. Fast IPSPs elicited via multiple synaptic release sites by different types of GABAergic neurone in the cat visual cortex. J Physiol. 1997;500:715–738. doi: 10.1113/jphysiol.1997.sp022054. [DOI] [PMC free article] [PubMed] [Google Scholar]
- Tamás G, Lorincz A, Simon A, Szabadics J. Identified sources and targets of slow inhibition in the neocortex. Science. 2003;299:1902–1905. doi: 10.1126/science.1082053. [DOI] [PubMed] [Google Scholar]
- Tamás G, Szabadics J, Lörincz A, Somogyi P. Input and frequency-specific entrainment of postsynaptic firing by IPSPs of perisomatic or dendritic origin. Eur J Neurosci. 2004;20:2681–2690. doi: 10.1111/j.1460-9568.2004.03719.x. [DOI] [PubMed] [Google Scholar]
- Toledo-Rodriguez M, Goodman P, Illic M, Wu C, Markram H. Neuropeptide and calcium binding protein gene expression profiles predict neuronal anatomical type in the juvenile rat. J Physiol. 2005;567:401–413. doi: 10.1113/jphysiol.2005.089250. [DOI] [PMC free article] [PubMed] [Google Scholar]
- Tomioka R, Rockland KS. Long-distance corticocortical GABAergic neurons in the adult monkey white and gray matter. J Comp Neurol. 2007;505:526–538. doi: 10.1002/cne.21504. [DOI] [PubMed] [Google Scholar]
- Tomioka R, Okamoto K, Furuta T, Fujiyama F, Iwasato T, Yanagawa Y, Obata K, Kaneko T, Tamamaki N. Demonstration of long-range GABAergic connections distributed throughout the mouse neocortex. Eur J Neurosci. 2005;21:1587–1600. doi: 10.1111/j.1460-9568.2005.03989.x. [DOI] [PubMed] [Google Scholar]
- Tyner CF. The naming of neurons: applications of taxonomic theory to the study of cellular populations. Brain Behav Evol. 1975;12:75–96. doi: 10.1159/000124141. [DOI] [PubMed] [Google Scholar]
- Uematsu M, Hirai Y, Karube F, Ebihara S, Kato M, Abe K, Obata K, Yoshida S, Hirabayashi M, Yanagawa Y, Kawaguchi Y. Quantitative chemical composition of cortical GABAergic neurons revealed in transgenic venus-expressing rats. Cereb Cortex. 2008;18:315–330. doi: 10.1093/cercor/bhm056. [DOI] [PubMed] [Google Scholar]
- Wang Y, Gupta A, Toledo-Rodriguez M, Wu CZ, Markram H. Anatomical, physiological, molecular and circuit properties of nest basket cells in the developing somatosensory cortex. Cereb Cortex. 2002;12:395–410. doi: 10.1093/cercor/12.4.395. [DOI] [PubMed] [Google Scholar]
- Wang Y, Toledo-Rodriguez M, Gupta A, Wu C, Silberberg G, Luo J, Markram H. Anatomical, physiological and molecular properties of Martinotti cells in the somatosensory cortex of the juvenile rat. J Physiol. 2004;561:65–90. doi: 10.1113/jphysiol.2004.073353. [DOI] [PMC free article] [PubMed] [Google Scholar]
- Ward JH. Hierarchical grouping to optimize an objective function. J Am Stat Assoc. 1963;58:236–244. [Google Scholar]
- Yan XX, Garey LJ. Morphological diversity of nitric oxide synthesising neurons in mammalian cerebral cortex. J Hirnforsch. 1997;38:165–172. [PubMed] [Google Scholar]
- Yan XX, Jen LS, Garey LJ. NADPH-diaphorase-positive neurons in primate cerebral cortex colocalize with GABA and calcium-binding proteins. Cereb Cortex. 1996;6:524–529. doi: 10.1093/cercor/6.3.524. [DOI] [PubMed] [Google Scholar]
- Zaitsev AV, Povysheva NV, Gonzalez-Burgos G, Rotaru D, Fish KN, Krimer LS, Lewis DA. Interneuron diversity in layers 2–3 of monkey prefrontal cortex. Cereb Cortex. 2008 doi: 10.1093/cercor/bhn198. [DOI] [PMC free article] [PubMed] [Google Scholar]
- Zhou FM, Hablitz JJ. Layer I neurons of rat neocortex. I. Action potential and repetitive firing properties. J Neurophysiol. 1996;76:651–667. doi: 10.1152/jn.1996.76.2.651. [DOI] [PubMed] [Google Scholar]
- Zhou FM, Hablitz JJ. Activation of serotonin receptors modulates synaptic transmission in rat cerebral cortex. J Neurophysiol. 1999;82:2989–2999. doi: 10.1152/jn.1999.82.6.2989. [DOI] [PubMed] [Google Scholar]