

Abstract
It has been recognized that fluid-structure interactions (FSI) play an important role in cardiovascular disease initiation and development. However, in vivo MRI multi-component FSI models for human carotid atherosclerotic plaques with bifurcation and quantitative comparisons of FSI models with fluid-only or structure-only models are currently lacking in the literature. A 3D non-Newtonian multi-component FSI model based on in vivo/ex vivo MRI images for human atherosclerotic plaques was introduced to investigate flow and plaque stress/strain behaviors which may be related to plaque progression and rupture. Both artery wall and plaque components were assumed to be hyperelastic, isotropic, incompressible and homogeneous. Blood flow was assumed to be laminar, non-Newtonian, viscous and incompressible. In vivo/ex vivo MRI images were acquired using histologically-validated multi-spectral MRI protocols. The 3D FSI models were solved and results were compared with those from a Newtonian FSI model and wall-only/fluid-only models. A 145% difference in maximum principal stresses (Stress-P1) between the FSI and wall-only models and 40% difference in flow maximum shear stress (MSS) between the FSI and fluid-only models were found at the throat of the plaque using a severe plaque sample (70% severity by diameter). Flow maximum shear stress (MSS) from the rigid wall model is much higher (20–40% in maximum MSS values, 100–150% in stagnation region) than those from FSI models.
Keywords: Finite element method, artery, blood flow, fluid-structure interaction, atherosclerosis
1 Introduction
There has been considerable interdisciplinary effort combining medical image technology and image-based computational modeling to perform mechanical analysis for atherosclerotic plaques and identify critical mechanical conditions related to plaque rupture which often leads to critical events such as stroke and heart attack [Finol, Keyhani, and Amon (2003); Friedman and Giddens (2005); Scotti et al. (2005); Yuan, Mitsumori, Beach, and Maravilla (2001a)]. Computational modeling for engineering applications with meshless and finite element methods have made considerable advances in recent years [Atluri (2004, 2005); Atluri, Yagawa, and Cruse (1995); Bathe (1996, 2002); Shu, Ding, and Yeo (2005)]. A series of meshless local Petrov-Galerkin (MLPG) methods were introduced to solved 3-dimensional elastostatic and dynamical problems [Han and Atluti (2004a, 2004b)] and nonlinear problems with large deformation and rotations [Han, Rajendran and Atluri (2004)]. A “mixed” approach was introduced to improve the MLPG method using finite volume method [Atluri, Han and Rajendran (2004)] and finite difference method [Atluri, Liu, and Han, (2006a, 2006b)]. Numerical methods were also developed to solve problems with free and moving boundaries [Zohouri, Pirooz, and Esmaeily (2005); Mai-Duy and Tran-Cong, (2004)]. While it has been recognized that fluid-structure interactions (FSI) play an important role in blood flow in arteries, MRI-based models for atherosclerotic plaques have been limited mainly to 2D or 3D structure-only/3D fluid-only models with a few exceptions due to the complexity of the problem [Li et al. (2006); Cheng et al. (1993); Tang et al. (2004)]. An iterative method solving problems with fluid-structure interactions was introduced by Rugonyi and Bathe [Rugonyi and Bathe (2001)]. A meshless spatial coupling scheme for large-scale fluid-structure-interaction problems was introduced by [Ahrem, Beckert and Wendland, (2006)]. More complete reviews can be found from [Tang, (2006); Tang, Yang, and Yuan (2006)].
In this paper, non-Newtonian 3D multi-component FSI models based on in vivo/ex vivo MR images of human atherosclerotic plaques with bifurcation were introduced to investigate both flow and structure stress/strain behaviors and seek critical information which may be related to plaque progression and rupture. To our knowledge, this will be the first 3D in vivo MRI-based modeling paper for carotid plaque with bifurcation and fluid-structure interactions. Our special aims are: a) quantify differences between 3D structure-only, fluid-only and FSI models; b) quantify differences between Newtonian and non-Newtonian models based on in vivo MRI patient-specific data. Both flow and structure stress/strain behaviors will be investigated because while low flow shear stress may be more relevant in the plaque initiation and progression process [Ku, Giddens, Zarins, and Glagov (1985); Giddens, Zarins, and Glagov, (1993); Friedman, Bargeron, Deters, Hutchins, and Mark (1987)], high flow shear stress and structure stress/strain distributions may be more closely related to plaque rupture risk analysis. The in vivo MRI-based model together with the flow and stress/strain behaviors in the plaque obtained from the model will serve as starting points and necessary preparations for patient-specific plaque progression and assessment investigations.
2 Models and methods
This interdisciplinary MRI-based modeling project was a collaborative effort from the MRI team led by Dr. Yuan and computational modeling team led by Dr. Tang, both with extensive publications giving details of their methods and model development approaches. Some details of the MRI data acquisition and model construction processes are given below.
2.1 In vivo/Ex vivo MRI data acquisition and 3D geometry re-construction
In vivo MRI images of human carotid atherosclerotic plaques were provided by Dr. Yuan and his group at University of Washington (UW) using protocol approved by University of Washington Institutional Review Board with informed consent obtained. MRI scans were conducted on a GE SIGNA 1.5T whole body scanner using the protocol outline in Yuan and Kerwin [Yuan and Kerwin (2004)]. Multi-contrast images (T1, CTE1, TOF, and PD) of carotid atherosclerosis were generated to characterize plaque tissue composition, luminal and vessel wall morphology [Cai, Hatsukami, Ferguson, Small, Polissar, and Yuan, (2002); Yuan et al, (2001a, 2001b)]. A computer package CASCADE (Computer-Aided System for Cardiovascular Disease Evaluation) developed by the Vascular Imaging Laboratory (VIL) at the University of Washington (UW) was used to perform image analysis and segmentation [Kerwin, Hooker, Spilker, Vicini, Ferguson, Hatsukami, and Yuan, (2003)]. CASCADE analysis tools have been validated by histological studies and are able to accurately identify specific plaque features, including the lumen, wall boundary, lipid rich necrotic core, calcifications, and other components. Fig. 1 gives multiple contrast weighting MR images with contours generated by CASCADE. Ex vivo MRI data of human atherosclerotic plaques were provided by Dr. Woodard and Dr. Zheng’s group using protocol approved by Washington University Institutional Review Board with informed consent obtained. Segmentation was done by a self-developed software package Atherosclerotic Plaque Imaging Analysis (APIA) written in Mat-lab (MathWorks, MATLAB, Natick, MA) and also validated by histological analysis.
Figure 1.

The CASCADE interface permits multiple contrast weighting display, interactive delineation of plaque features, and concise reporting of quantitative lesion indexes among other functions. Contour plots of plaque components shown were generated by CASCADE and digitized for 3D geometry reconstruction. Five different contrast weighting are shown. The lower right figure is the segmented plaque with different plaque components identified.
3D geometry reconstruction and mesh generation were done under ADINA environment. AD-INA (ADINA R & D, Inc., Watertown, MA) is a commercial finite element package which has been validated by many real-life applications and has been used by the authors in several investigations with experimental validations [Bathe (2002); Tang et al., (2004, 2005a, 2005b)]. All segmented 2D slices were read into ADINA input file, pixel by pixel. For in vivo data, the geometry was reduced by 10% before the data is read into ADINA so that the actual in vivo shape could be recovered with initial stress/strain conditions when initial axial pre-stretch and pressurization were applied. The reduction rate was numerically determined for an optimal match with in vivo shape after pressurization. 3D surfaces, volumes and computational meshes were made under AD-INA computing environment. Fig. 2 shows 4 MRI slices (T1W, selected from set of 24 slices) from a human carotid plaque sample, the segmented component contour plots, the re-constructed 3D geometry, and two additional human atherosclerotic plaque samples re-constructed from ex vivo MR images. Some smoothing was applied to correct numerical and MRI artefacts.
Figure 2.

In vivo 3D MRI images of a human carotid plaque and 3D reconstruction. (a) 4 MRI (T1W) slices (S2–S5) selected from a 24-slice set (S0–S23), slice spacing: 0.5mm. Each image shown here is cut from the whole-neck image; (b) segmented contour plots using CASCADE showing plaque components; (c) 3D geometry reconstructed from in vivo images; (d)–(e) two more plaque samples reconstructed from ex vivo MR images.
2.2 The solid and fluid models
Both the artery wall and the components in the plaque were assumed to be hyperelastic, isotropic, incompressible and homogeneous. For the fluid model, the flow was assumed to be laminar, viscous and incompressible. Both Newtonian and non-Newtonian fluids are considered. The incompressible Navier-Stokes equations with arbitrary Lagrangian-Eulerian (ALE) formulation were used as the governing equations which are suitable for problems with fluid-structure interactions and frequent mesh adjustments. Flow velocity at the flow-vessel interface was set to zero for steady flow and set to move with vessel wall (no-slip condition) for unsteady flow. Putting these together, we have [Bathe (1996, 2002); Tang et al. (2004)]:
| (1) |
| (2) |
| (3) |
| (4) |
| (5) |
| (6) |
| (7) |
| (8) |
| (9) |
where u and p are velocity and pressure, ug is mesh velocity, Γ is vessel inner boundary, f·, j stands for derivative of f with respect to the jth variable, σ is stress tensor (superscripts indicate different materials), ε is strain tensor, v is solid displacement vector, Γi stands for all the interfaces, μ is the fluid viscosity, D is the effective deformation rate given by [Bathe (2002)],
| (10) |
and A, n, μ0 and μ∞ are constants chosen to fit experimental data [Fung (1993)]. The 3D nonlinear modified Mooney-Rivlin (M-R) model was used to describe the material properties of the vessel wall and plaque components [Huang et al. (2001); Tang et al. (2004)]. The strain energy function for M-R model is given by (continued after Fig. 2),
| (11) |
| (12) |
where I1 and I2 are the first and second strain invariants, C = [Ci j] = XT X is the right Cauchy-Green deformation tensor, X = [Xi j] = [∂xi/∂aj], (xi) is current position, (ai) is original position [Bathe (1996, 2002)], ci and Di are material parameters chosen to match experimental measurements [Humphrey (2002); Kobayashi et al. (2003)]. The viscosity curve fitting experimental data and stress-stretch curves from the M-R model are given by Fig. 3 [Fung (1993); Johnston et al. (2004); Karner et al. (1999)]. Pressure conditions used in our simulations for the baseline model and the flow rates obtained from the FSI model are given by Fig. 4 [Ku et al. (1985); Karner et al. (1999)].
Figure 3.

(a) Stress-stretch curves derived from the modified Mooney-Rivlin models for fibrous tissue (vessel), lipid pool, and calcifications. Parameter values: Fibrous tissue, c1=368000, c2=0, D1=144000, D2=2.0; Necrotic lipid pool: c1=20000, c2=0, D1=20000, D2=1.5; Calcification: c1=3680000, c2=0, D1=1440000, D2=2.0. Unit: dyn/cm2. (b) Blood viscosity curve compared with experimental data and models used by other authors. Parameter values: our model, μ0=2.3, μ∞ =0.0345, λ=28.28, a=−0.355, b=2; model by Johnston et al., μ0=0.56, μ∞ =0.0345, λ=3.313, a=−0.3216, b=2; model by Johnston et al., μ0=0.1315, μ∞ =0.03, λ=0.5, a=−0.3, b=1.7.
Figure 4.

Prescribed upstream and downstream pressure conditions and the corresponding flow rates obtained from the FSI model. Flow rates are different at the inlet and outlet due to vessel deformation.
2.3 Solution methods
The fully coupled FSI models were solved by ADINA. ADINA uses unstructured finite element methods for both fluid and solid models. Nonlinear incremental iterative procedures are used to handle fluid-structure interactions. The governing finite element equations for both the solid and fluid models were solved by Newton-Raphson iteration method. Proper mesh was chosen to fit the shape of each component, the vessel, and the fluid domain. Finer mesh was used for thin plaque cap and components with sharp angles to get better resolution and handle high stress concentration behaviours. The artery was stretched axially and pressurized gradually to specified conditions. Mesh analysis was performed until differences between solutions from two consecutive meshes were negligible (less than 1% in L2-norm). Three cardiac cycles were needed to obtain periodic solutions. More details of the computational models and solution methods can be found from Tang et al. (2004) and Bathe (1996, 2002).
3 Results
Simulations were conducted using different models to investigate the effects of non-Newtonian and FSI models on flow and wall stress/strain behaviors, with special attention paid to flow wall shear stress variations. Four models were considered: Model 1, non-Newtonian fluid with FSI (baseline model); Model 2, Newtonian fluid with FSI; Model 3, Newtonian fluid-only rigid wall model; Model 4, wall-only model (no flow). Pressure conditions, material properties and plaque morphology (plaque cap thickness, stenosis severity and plaque components) may be varied to observe the corresponding changes of flow and stress/strain behaviors.
3.1 Overview of flow velocity, pressure, shear stress, and structure stress/strain distributions
Figures 5–6 present some basic results obtained from Plaque #1 reconstructed from in vivo MRI images (see Fig. 2(c)). Viscosity for the Newtonian fluid was set to be 0.0345 Poise. Due to the complexity of 3D solutions, two sagittal cut surfaces showing the bifurcation (L-cut) and a Y-cut surface (setting y=constant) showing the lipid core were selected to present the results. Peak velocity was found in the vessel narrowing caused by the plaque (Fig. 5(a)). Minimum pressure occurred at the plaque stenosis throat (Fig. 5(b)). In this paper, flow maximum-shear-stress (MSS) is used to investigate flow shear stress behaviors. MSS is defined as [Fung (1994); Bathe (2002)]:
| (13) |
where σ1 and σ3 are the flow maximum and minimum principal stresses respectively. For flow shear stress along an axisymmetric tube wall, τmss reduces to the regular definition (Fung, 1994),
Figure 5.

Overview of flow characteristics from the non-Newtonian FSI model showing flow velocity, pressure, maximum shear stress, and blood viscosity distributions corresponding to maximum inlet pressure.
Figure 6.

Overview of flow variables and stress/strain distributions on a Y-cut surface which has a better view of the location of the lipid pool and the solution behaviors.
| (14) |
where u is the axial component of the velocity and the radial component of the velocity is zero. Eq. (13) defines MSS in a 3D setting and is more suitable for our purpose due to complexity of plaque geometries. Fig. 5(c) gives an MSS band plot for the base model. MSS maximum was observed in the internal carotid artery (ICA) on the proximal side of the plaque. MSS is higher where the vessel is narrower. Minimum MSS is found near the centerline of the vessel as expected. Fig. 5(d) shows viscosity distribution in the fluid, with maximum and minimum occurring where minimum and maximum MSS were found. Maximum viscosity is about 300% of the minimum viscosity found at the maximum MSS location.
Fig. 6 shows flow and stress/strain characteristics on a Y-cut surface. A flow re-circulation region distal to the stenosis is clearly seen. To better quantify this region, a band plot of the axial velocity (velocity component in z-direction) is given by Fig. 6(b). Band plot will be used again to compare the differences of the cases considered. Figigues 6(c)–(d) give maximum principal stress and strain distributions (Stress-P1 and Strain-P1) on the Y-cut surface showing their maximum values at a healthy site where vessel curvature is large. Because this plaque sample has a thick plaque cap, the plaque is stable. No critical stress/strain conditions were observed. More details about stress/strain analysis with cap thickness variations can be found from Tang et al. (2004; 2005b).
3.2 Flow velocity comparisons
Fig. 7 gives band plots of axial velocity (w-component) which is a simple way to identify flow stagnation and re-circulation regions. Plots for Cases 1–3 with minimum pressure conditions are given to observe flow pattern differences with special attention paid to flow re-circulations. Our results indicated that lower pressure condition corresponds to large flow stagnation regions. The stagnation region (marked by w=0 contour) from the Newtonian flow model is considerably larger that from the non-Newtonian model as shown by Figures 7(a) and 7(b). The rigid-wall model has a narrower lumen because it did not have vessel stretch and expansion. However, the velocity pattern is similar to those from FSI models. Maximum w-velocity from the non-Newtonian model (Model 1) is 3.5% lower than that from the Newtonian model (Model 2), and is about the same as that from the rigid-wall model (Model 3). Fig. 8 shows that flow rates from FSI models (Models 1 & 2) are about 35% higher than that from the rigid wall model. Flow rate from the non-Newtonian model is about 2% lower than that from the Newtonian model (Model 2) because of the non-Newtonian viscosity effect.
Figure 7.

Comparison of flow velocity (longitudinal or w-component) from three models: Model 1, non-Newtonian fluid with FSI (baseline model); Model 2, Newtonian fluid with FSI; Model 3, Newtonian flow-only rigid wall model. Differences in maximum velocity values are small. Flow stagnation regions with different sizes were observed from all three models.
Figure 8.
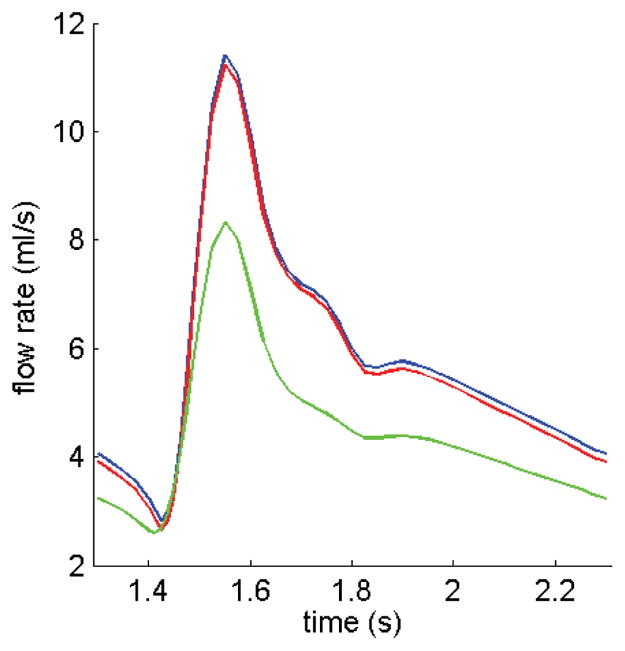
Comparison of flow rates obtained from three models. Flow rate from the Non-Newtonian FSI model is lower because of the higher viscosity. The rigid wall model gives lower flow rate because of its narrower lumen.
3.3 Shear stress behaviors
As shear stress is the most closely examined flow variable, Fig. 9 presents MSS band plots (Fig. 9(a)) and MSS tracked at two locations over one cardiac cycle (Figures 9(b)–(c)) where maximum and minimum MSS were found on the Y-cut surface. Results from the Newtonian and non-Newtonian FSI models and the rigid wall model are compared. Fig. 9(a) shows that small geometrical unevenness (e.g., the small waviness along the lower boundary of the Y-cut) causes large MSS variations. Maximum MSS values from the Newtonian and non-Newtonian FSI models are almost the same as seen from Figures 9(b)–(c), with non-Newtonian model giving higher MSS values. The differences of MSS values from the three models tracked at Site 2 are more noticeable (Fig. 9(c)). MSS from the non-Newtonian model is about 40% higher at the minimum MSS location during diastole. The MSS from the rigid wall model is much higher (100–150%, while the absolute difference is only about 2–4 dyn/cm2) than those from FSI models due to narrower lumen. Low flow shear stress is known to be related to atherosclerotic plaque initiation and progression [Ku et al. (1985); Friedman et al. (1987)]. The biological significance of these differences is to be revealed and quantified from experimental and clinical investigations.
Figure 9.

(a) MSS distributions from the non-Newtonian FSI model corresponding to maximum upstream pressure conditions; (b)–(c). MSS from Models 1–3 tracked at two sites (tracking site 1 corresponds to maximum MSS site; tracking site 2 corresponds to flow-stagnation region) over a cardiac cycle showing rigid-wall model has higher MSS (more than 100%) than that from FSI models and that non-Newtonian FSI model has higher MSS at Site 2 compared to MSS from the Newtonian FSI model.
Simulations were also conducted using other two plaque samples (Plaques #2 & #3 as given in Fig. 2). Our results confirmed that Newtonian and non-Newtonian models for blood flow in large arteries do not lead to considerable differences. Differences for flow velocity and shear stresses were all within 5% range.
3.4 Plaque with more severe stenosis and larger pressure drop
Blood pressure is the driving force for blood flow in arteries. For the three plaque samples given in Fig. 2 and the simulations conducted up to now, vessel lumen reductions were all gradual and pressure drop was small (less than 1 mmHg). Because the pressure fields are almost uniform in the three plaques considered, wall stresses obtained from the FSI models and the wall-only models were almost the same (figures not shown). However, for plaques with more severe stenosis and larger pressure drop, the situation is different. A modified carotid plaque with 70% stenosis severity (by diameter) was used to investigate the model differences (Fig. 10). For Models 1–3 (defined at the beginning of Section 3), the pressure given in Fig. 3 was used as the inlet pressure, and the outlet pressure was set at 40 mmHg which is still within physiological range [Tang et al. (2001)]. For Model 4 (the wall-only no flow model), the lumen pressure was set the same as the inlet pressure from Models 1–3. Fig. 10 gives Stress-P1 from Models 1,2,4 and MSS from Models 1–3 tracked at the stenosis throat over a cardiac cycle. Stress-P1 from the wall-only model at the tracking point (TP) is 145% higher than that from the FSI models. MSS at TP from the fluid-only rigid-wall model is about 40% higher than that from the FSI models. Differences between the Newtonian and non-Newtonian FSI models are so small that those curves are totally overlapped in Figures 10(b)–(c).
Figure 10.

Results from a severely stenosed plaque (modified from Plaque #2) demonstrate that plaque morphology and pressure drop conditions have considerable effects on flow and wall stress/strain behaviors. (a) Modified plaque with stenosis severity 70% by diameter; (b) Stress-P1 at the tracking point (throat of the plaque) from the non-Newtonian FSI model is about 145% higher than that from the wall-only model; (c) MSS at the tracking point from the flow-only model is about 40% higher than that from the non-Newtonian FSI model. MSS from Newtonian FSI model almost overlaps the non-Newtonian curve.
4 Discussion
4.1 FSI models compared with wall-only and fluid-only models, fluid and structural stresses
We believe this is the first time in vivo MRI multi-component FSI models with bifurcation was introduced for patient-specific carotid atherosclerotic plaques and model comparison was made using those models. It has been gradually recognized that fluid-structure interactions play an important role in many biological processes and should be included in computational models for more accurate mechanical analysis and predictions [Tang et al. (2005a)]. However, it is less clear that the FSI impact is closely linked to plaque structure and pressure conditions for the specific model considered. For example, the wall stress distributions in the three plaque samples (Fig. 2) from the FSI models and wall-only model are almost the same because the pressure distributions obtained from the FSI models are almost uniform and do not differ much from the uniform lumen pressure specified in the wall-only model. Compared to pressure, flow shear stress is several order of magnitude lower (1 mmHg = 1332 dyn/cm2) and its contribution to wall stress distribution could be ignored unless flow shear stress on lumen surface becomes important (damage to endothelium, rupture of very thin cap, etc.). Larger differences in Stress-P1 and MSS from different models were found from a modified plaque sample with severe stenosis and large pressure drop conditions. Our results indicate that wall-only and fluid-only models may be adequate for normal or mild/moderately diseased arteries when properly used. FSI models should be used for severely stenosed arteries.
4.2 Controlling factors and effect of the non-Newtonian model
In our previous papers, controlling factors in computational FSI models affecting mechanical forces (both fluid and structure) in atherosclerotic plaques were classified into three groups: a) plaque morphology and structure; b) material properties of the vessel and plaque components; c) flow forces (pressure). The non-Newtonian FSI bifurcation model is adding in vivo vessel bifurcation and blood viscosity to the list. In vivo MRI-based models are much closer to clinical applications because vessel geometry based on ex vivo MRI data may be considerably different from its original in vivo morphology. Our results indicated that MSS differences between the Newtonian and non-Newtonian models are almost negligible for the plaque samples considered other than when MSS values become very low (< 10 dyn/cm2). Even though MSS differences from these models are small in the flow re-circulation region, their relative differences are not so small and the biological and clinical significance of those differences for plaque progression is to be revealed and quantified from experimental and clinical investigations.
5 Conclusion
A 3D non-Newtonian multi-component FSI model based on in vivo MRI images for human atherosclerotic plaques with bifurcation was introduced to investigate flow and plaque stress/strain behaviors which may be related to plaque progression and rupture. Solution differences between Newtonian and non-Newtonian FSI models, wall-only (no flow) and fluid-only (rigid wall) models were quantified using human atherosclerotic plaque geometries re-constructed from in vivo/ex vivo MR images. Our results indicate that solution differences between the FSI models and wall-only/fluid-only models are closely linked to plaque morphology and pressure drop conditions. For a plaque sample with 70% stenosis, a 145% difference in Stress-P1 values between the FSI and wall-only models and 40% difference in MSS values between the FSI and fluid-only models were found at the throat of the plaque. MSS values from the rigid wall model could be much higher (100–150% for plaque #1) than those from FSI models due to narrower lumen. Effects of model difference, plaque morphology, fluid-structure interactions, and blood pressure conditions on computational predictions for flow and stress/strain behaviors are far more noticeable for advanced atherosclerotic plaques compared to healthy or mildly/moderately diseased arteries.
Acknowledgments
This research was supported in part by NIH grant NIH/NIBIB, R01 EB004759 as part of the NSF/NIH Collaborative Research in Computational Neuroscience Program, and in part by NSF grant DMS-0540684. Drs Vasily Yarnykh, Baocheng Chu, and Fei Liu contributed in the in vivo MRI data acquisition and image processing and their efforts are happily acknowledged.
References
- Ahrem R, Beckert A, Wendland H. A meshless spatial coupling scheme for large-scale fluid-structure-interaction problems. CMES: Computer Modeling in Engineering & Sciences. 2006;12(2):121–136. [Google Scholar]
- Atluri SN. Methods of Computer Modeling in Engineering & the Sciences-Part I. Tech Science Press; Forsyth, GA: 2005. [Google Scholar]
- Atluri SN. The Meshless Local-Petrov-Galerkin Method for Domain & BIE Discretizations. Tech Science Press; Forsyth, GA: 2004. [Google Scholar]
- Atluri SN, Han ZD, Rajendran AM. A new implementation of the meshless finite volume method, through the MLPG “Mixed” approach. CMES: Computer Modeling in Engineering & Sciences. 2004;6(6):491–513. [Google Scholar]
- Atluri SN, Liu HT, Han ZD. Meshless local Petrov-Galerkin (MLPG) mixed collocation method for elasticity problems. CMES: Computer Modeling in Engineering & Sciences. 2006a;14(3):141–152. [Google Scholar]
- Atluri SN, Liu HT, Han ZD. Meshless local Petrov-Galerkin (MLPG) mixed finite difference method for solid mechanics. CMES: Computer Modeling in Engineering & Sciences. 2006b;15(1):1–16. [Google Scholar]
- Atluri SN, Yagawa G, Cruse TA, editors. Computational Mechanics ‘95. I & II. Springer-Verlag; New York: 1995. [Google Scholar]
- Bathe KJ. Finite Element Procedures. Prentice Hall, Inc.; New Jersey: 1996. [Google Scholar]
- Bathe KJ, editor. Theory and Modeling Guide. I & II. ADINA and ADINA-F, ADINA R & D, Inc.; Watertown, MA: 2002. [Google Scholar]
- Cai JM, Hatsukami TS, Ferguson MS, Small R, Polissar NL, Yuan C. Classification of human carotid atherosclerotic lesions with in vivo multicontrast magnetic resonance imaging. Circulation. 2002;106:1368–1373. doi: 10.1161/01.cir.0000028591.44554.f9. [DOI] [PubMed] [Google Scholar]
- Cheng GC, Loree HM, Kamm RD, Fishbein MC, Lee RT. Distribution of circumferential stress in ruptured and stable atherosclerotic lesions, a structural analysis with histopathological correlation. Circulation. 1993;87:1179–1187. doi: 10.1161/01.cir.87.4.1179. [DOI] [PubMed] [Google Scholar]
- Finol EA, Keyhani K, Amon CH. The effect of asymmetry in abdominal aortic aneurysms under physiologically realistic pulsatile flow conditions. J Biomech Eng. 2003;125(2):207–17. doi: 10.1115/1.1543991. [DOI] [PubMed] [Google Scholar]
- Friedman MH, Bargeron CB, Deters OJ, Hutchins GM, Mark FF. Correlation between wall shear and intimal thickness at a coronary artery branch. Atherosclerosis. 1987;68:27–33. doi: 10.1016/0021-9150(87)90090-6. [DOI] [PubMed] [Google Scholar]
- Friedman MH, Giddens DP. Blood flow in major blood vessels - modeling and experiments. Annals of Biomedical Engineering. 2005;33(12):1710–1713. doi: 10.1007/s10439-005-8773-1. [DOI] [PubMed] [Google Scholar]
- Fung YC. A First Course in Continuum Mechanics. 3. Englewood Cliffs; New Jersey: 1994. [Google Scholar]
- Fung YC. Biomechanics: Mechanical properties of Living Tissues. Springer-Verlag; New York: 1993. p. 68. [Google Scholar]
- Giddens DP, Zarins CK, Glagov S. The role of fluid mechanics in the localization and detection of atherosclerosis. Journal of Biomechanical Engineering. 1993;115:588–594. doi: 10.1115/1.2895545. [DOI] [PubMed] [Google Scholar]
- Gillard JH, Hatsukami TS, Graves M, Yuan C, editors. Carotid Disease: The Role of Imaging in Diagnosis and Management. Cambridge University Press; Cambridge, England: 2006. pp. 323–339. [Google Scholar]
- Han ZD, Atluri SN. Meshless local Petrov-Galerkin (MLPG) approaches for solving 3D problems in elasto-statics. CMES: Computer Modeling in Engineering & Sciences. 2004a;6(2):169–188. [Google Scholar]
- Han ZD, Atluri SN. A meshless local Petrov-Galerkin (MLPG) approach for 3-dimensional elasto-dynamics. CMC: Computers, Materials & Continua. 2004b;1(2):129–140. [Google Scholar]
- Han ZD, Rajendran AM, Atluri SN. Meshless local Petrov-Galerkin (MLPG) approaches for solving nonlinear problems with large deformations and rotations. CMES: Computer Modeling in Engineering & Sciences. 2005;10(1):1–12. [Google Scholar]
- Huang H, Virmani R, Younis H, Burke AP, Kamm RD, Lee RT. The impact of calcification on the biomechanical stability of atherosclerotic plaques. Circulation. 2001;103:1051–1056. doi: 10.1161/01.cir.103.8.1051. [DOI] [PubMed] [Google Scholar]
- Humphrey JD. Cardiovascular Solid Mechanics. Springer-Verlag; New York: 2002. [Google Scholar]
- Johnston BM, Johnston PR, Corney S, Kilpatrick D. Non-Newtonian blood flow in human right coronary arteries: steady state simulations. J Biomechanics. 2004;37(5):709–20. doi: 10.1016/j.jbiomech.2003.09.016. [DOI] [PubMed] [Google Scholar]
- Karner G, Perktold K, Hofer M, Liepsch D. Flow characteristics in an anatomically realistic compliant carotid artery bifurcation model. Comput Methods Biomech Biomed Engin. 1999;2(3):171–185. doi: 10.1080/10255849908907986. [DOI] [PubMed] [Google Scholar]
- Kerwin W, Hooker A, Spilker M, Vicini P, Ferguson M, Hatsukami T, Yuan C. Quantitative magnetic resonance imaging analysis of neovasculature volume in carotid atherosclerotic plaque. Circulation. 2003;107(6):851–856. doi: 10.1161/01.cir.0000048145.52309.31. [DOI] [PubMed] [Google Scholar]
- Kobayashi S, Tsunoda D, Fukuzawa Y, Morikawa H, Tang D, Ku DN. Flow and compression in arterial models of stenosis with lipid core. Proceedings of 2003 ASME Summer Bioengineering Conference; Miami, FL. 2003. pp. 497–498. [Google Scholar]
- Ku DN, Giddens DP, Zarins CK, Glagov S. Pulsatile flow and atherosclerosis in the human carotid bifurcation: positive correlation between plaque location and low and oscillating shear stress. Arteriosclerosis. 1985;5:293–302. doi: 10.1161/01.atv.5.3.293. [DOI] [PubMed] [Google Scholar]
- Li ZY, Howarth SPS, Tang T, Gillard JH. How Critical Is Fibrous Cap Thickness to Carotid Plaque Stability? A Flow-Plaque Interaction Model. Stroke, American Heart Association. 2006;37:1195–1199. doi: 10.1161/01.STR.0000217331.61083.3b. [DOI] [PubMed] [Google Scholar]
- Mai-Duy N, Tran-Cong T. Boundary integral-based domain decomposition technique for solution of Navier-Stokes equations. CMES: Computer Modeling in Engineering & Sciences. 2004;6(1):59–76. [Google Scholar]
- Rugonyi S, Bathe KJ. On Finite Element Analysis of Fluid Flows Fully Coupled with Structural Interactions. CMES: Computer Modeling in Engineering & Sciences. 2001;2(2):195–212. [Google Scholar]
- Scotti CM, Shkolnik AD, Muluk SC, Finol EA. Fluid-structure interaction in abdominal aortic aneurysms: effects of asymmetry and wall thickness. Biomed Eng Online. 2005;4:64–70. doi: 10.1186/1475-925X-4-64. [DOI] [PMC free article] [PubMed] [Google Scholar]
- Shu C, Ding H, Yeo KS. Computation of incompressible Navier-Stokes equations by local RBF-based differential quadrature method. CMES: Computer Modeling in Engineering & Sciences. 2005;7(2):195–206. [Google Scholar]
- Tang D. Modeling Flow in Healthy and Stenosed Arteries. In: Metin Akay Hoboekn., editor. Wiley Encyclopedia of Biomedical Engineering. John Wiley & Sons, Inc; New Jersey: 2006. pp. 1–16. Article 1525. [Google Scholar]
- Tang D, Yang C, Kobayashi S, Ku DN. Steady flow and wall compression in stenotic arteries: a 3-D thick-wall model with fluid-wall interactions. Journal of Biomechanical Engineering. 2001;123:548–557. doi: 10.1115/1.1406036. [DOI] [PubMed] [Google Scholar]
- Tang D, Yang C, Yuan C. Mechanical Image Analysis Using Finite Element Method. In: Jonathan H, Gillard JH, Hatsukami TS, Graves M, Yuan C, editors. Carotid Disease: The Role of Imaging in Diagnosis and Management. Cambridge University Press; Cambridge, England: 2006. pp. 323–339. [Google Scholar]
- Tang D, Yang C, Zheng J, Woodard PK, Saffitz JE, Petruccelli JD, Sicard GA, Yuan C. Local maximal stress hypothesis and computational plaque vulnerability index for atherosclerotic plaque assessment. Annals of Biomedical Engineering. 2005a;33(12):1789–1801. doi: 10.1007/s10439-005-8267-1. [DOI] [PMC free article] [PubMed] [Google Scholar]
- Tang D, Yang C, Zheng J, Woodard PK, Saffitz JE, Sicard GA, Pilgram TK, Yuan C. Quantifying effects of plaque structure and material properties on stress behaviors in human atherosclerotic plaques using 3D FSI models. Journal of Biomechanical Engineering. 2005b;127(7):1185–1194. doi: 10.1115/1.2073668. [DOI] [PMC free article] [PubMed] [Google Scholar]
- Tang D, Yang C, Zheng J, Woodard PK, Sicard GA, Saffitz JE, Yuan C. 3D MRI-based multi-component FSI models for atherosclerotic plaques, a 3-D FSI model. Annals of Biomedical Engineering. 2004;32(7):947–960. doi: 10.1023/b:abme.0000032457.10191.e0. [DOI] [PubMed] [Google Scholar]
- Yuan C, Kerwin WS. MRI of atherosclerosis. Journal of Magnetic Resonance Imaging. 2004;19(6):710–719. doi: 10.1002/jmri.20070. [DOI] [PubMed] [Google Scholar]
- Yuan C, Mitsumori LM, Beach KW, Maravilla KR. Special review: carotid atherosclerotic plaque: noninvasive MR characterization and identification of vulnerable lesions. Radiology. 2001a;221:285–299. doi: 10.1148/radiol.2212001612. [DOI] [PubMed] [Google Scholar]
- Yuan C, Mitsumori LM, Ferguson MS, Polissar NL, Echelard DE, Ortiz G, Small R, Davies JW, Kerwin WS, Hatsukami TS. In vivo accuracy of multispectral MR imaging for identifying lipid-rich necrotic cores and intraplaque hemorrhage in advanced human carotid plaques. Circulation. 2001b;104:2051–2056. doi: 10.1161/hc4201.097839. [DOI] [PubMed] [Google Scholar]
- Zohouri S, Pirooz MD, Esmaeily A. Predicting wave run-up using full ALE finite element approach considering moving boundary. CMES: Computer Modeling in Engineering & Sciences. 2004;7(1):107–118. [Google Scholar]