Abstract
1,4-Butanediol (BD), a substance of abuse, is bioactivated to γ-hydroxybutyrate (GHB), but its fundamental pharmacokinetics (PK) have not been characterized. Because this bioactivation is partly mediated by alcohol dehydrogenase, we hypothesized that there may also be a metabolic interaction between ethanol (ETOH) and BD. We therefore studied, in rats, the plasma PK of GHB, BD and ETOH each at two intravenous (IV) doses, when each substance was given alone, and when GHB or BD was co-administered with ETOH. Results showed that bioconversion of intravenously administered BD to GHB was complete, and that both GHB and BD exhibited nonlinear PK. Various population PK models were analyzed using NONMEM VI, and the best disposition model was found to include two PK compartments each for BD, an (unmeasured) putative semialdehyde intermediate (ALD), GHB and ETOH, the presence of nonlinear (Michaelis–Menten) elimination for each compound, and several mutual inhibition processes. The most prominent mutual metabolic inhibition was found between ETOH and BD, while that between GHB and ETOH was not significant. In vitro studies using liver homogenates confirmed mutual metabolic inhibitions between GHB and BD. Oral absorption of BD was best described by a first-order process with lag-time and pre-systemic metabolism from BD to ALD. Oral absorption of BD (as BD plus ALD) was rapid and complete. The fraction of the absorbed dose entering the central compartment as BD was 30% for the 1.58 mmol/kg dose and 55% for the 6.34 mmol/kg dose. At 6.34 mmol/kg IV, the onset of loss of righting reflex (LRR) for BD was significantly delayed vs. that produced by GHB (72.0 ± 9.1 min vs. 6.7 ± 0.6 min, respectively, p < 0.001), and the total duration of LRR was prolonged for BD vs. GHB (192 ± 28 min vs. 117 ± 2 min, respectively, p < 0.05). Relative to IV dosing, oral BD produced similar but more variable LRR effects. These results may provide a quantitative PK framework for the understanding of the toxicokinetics and toxicodynamics of both BD and GHB.
Key words: 1,4-butanediol; drugs of abuse; ethanol; GHB; metabolic inhibition; population pharmacokinetics
INTRODUCTION
γ-Hydroxybutyric acid (GHB), a brain-permeant analog of the neurotransmitter γ-aminobutyric acid, is approved for clinical use in the treatment of narcolepsy. However, it is more commonly used as an illicit drug of abuse particularly among young people, primarily for euphoria and enhanced energy by males, and for weight loss by females (1). Because GHB induces sedation and purportedly amnesia, criminals also use it as a date-rape drug.
The commercial sale of GHB is strictly controlled, thus substance abusers sometimes turn to either 1,4-butanediol (BD) or γ-butyrolactone (GBL) as alternate GHB sources, because these compounds are converted in vivo to GHB, and because they can still be obtained legally, ostensibly as industrial solvents. The oral bioavailability and concentration-dependent pharmacokinetics (PK) of GHB and GBL (and its conversion to GHB) in rats have previously been described by us (2–4), but the corresponding PK properties of BD in animal models have not yet been reported.
Because the metabolic conversion of BD to GHB is mediated in part by alcohol dehydrogenase (5), the co-administration of ethanol (ETOH), which is likely to occur in abuse situations with either BD or GHB, is expected to produce significant metabolic interactions. The PK interactions among these three compounds, viz., BD, ETOH, and GHB, which are likely to be nonlinear in nature, have not been examined and described in the literature.
In this report, we describe a liquid chromatography-mass spectrometric (LCMS) assay that allowed for the simultaneous determination of BD and GHB in rat plasma. We used this assay to study the PK of BD and GHB, and their interactions with ETOH, in rats. Population PK methodology was applied to assess the time course and extent of various potential interactions quantitatively.
METHODS
Materials
BD and deuterated BD (d8-BD) were obtained from Aldrich (Milwaukee, WI), while deuterated GHB (d6-GHB) was obtained from Cerillant (Round Rock, TX). Sodium GHB, β-NAD, β-NADP, and protease inhibitor cocktail were purchased from Sigma (St. Louis, MO). ETOH was obtained from Pharmco (Brookfield, CT), and Tris buffer was obtained through J.T. Baker (Phillipsburg, NJ). HPLC grade water and methanol were obtained from EMD (Gibbstown, NJ).
Animal experiments
All animal studies employed adult male Sprague Dawley rats, of about 300 g in body weight (Harlan, Indianapolis, IN). The animal protocols were reviewed and approved by the University at Buffalo Institutional Animal Care and Use Committee.
In vivo interaction studies
Rats were cannulated at both the jugular vein for blood withdrawal and femoral vein for intravenous (IV) dosing. Compounds in the drug interaction studies were dosed via a 5-min infusion to groups of 3 or 4 rats. Blood samples (0.2 mL each) were collected into heparinized tubes (at a final heparin concentration of 25 U/mL of blood) at selected intervals after dosing, and the plasma separated and frozen at −20°C until assay. Table I shows the compounds and doses employed in each of the 11 separate IV studies and 2 oral dosing studies, and the compound(s) for which the PK was determined.
Table I.
Dosing Regimens and PK Analyses Employed in this Work
| Study # | Compound Administered-(mmol/kg) | PK Determined | ||||
|---|---|---|---|---|---|---|
| BD | GHB | ETOH | BD | GHB | ETOH | |
| 1 | 6.34 | Yes | ||||
| 2 | 12.7 | Yes | ||||
| 3 | 1.79 | Yes | ||||
| 4 | 6.34 | Yes | ||||
| 5 | 1.58 | Yes | Yes | |||
| 6 | 6.34 | Yes | Yes | |||
| 7 | 1.58 | 6.34 | Yes | Yes | ||
| 8 | 1.58 | 12.7 | Yes | Yes | Yes | |
| 9 | 6.34 | 6.34 | Yes | Yes | Yes | |
| 10 | 1.58 | 6.34 | Yes | |||
| 11 | 6.34 | 6.34 | Yes | Yes | ||
| 12 | 1.58POa | Yes | Yes | |||
| 13 | 6.34POa | Yes | Yes | |||
Except otherwise stated, doses were administered intravenously as a 5-min infusion
aAdministered by oral intubation
Oral bioavailability of BD
The oral bioavailability of BD was also examined (Table I, studies 12 and 13). The animals were cannulated at the jugular vein for blood collection, and the dose was administered by gastric gavage.
In vitro interaction studies
Fresh rat liver was first washed in cold normal saline to remove residual blood, minced and placed into a teflon homogenizer. Then, 3 mL of 50 mM Tris buffer (pH 7.4) with 1:100 protease inhibitor was added per gram of liver. With the homogenizer immerged in ice, the liver was homogenized using a Tri-R stir-R Model S63C variable speed homogenizer set to speed 5, and 7 up and down passes were sufficient to create a uniform suspension. The homogenate was then centrifuged twice at 3,000×g for 20 min at 4°C to remove particulates. The supernatant was then aliquoted in 1 mL portions and stored at −20°C. Protein concentration was determined by the Lowry assay (6).
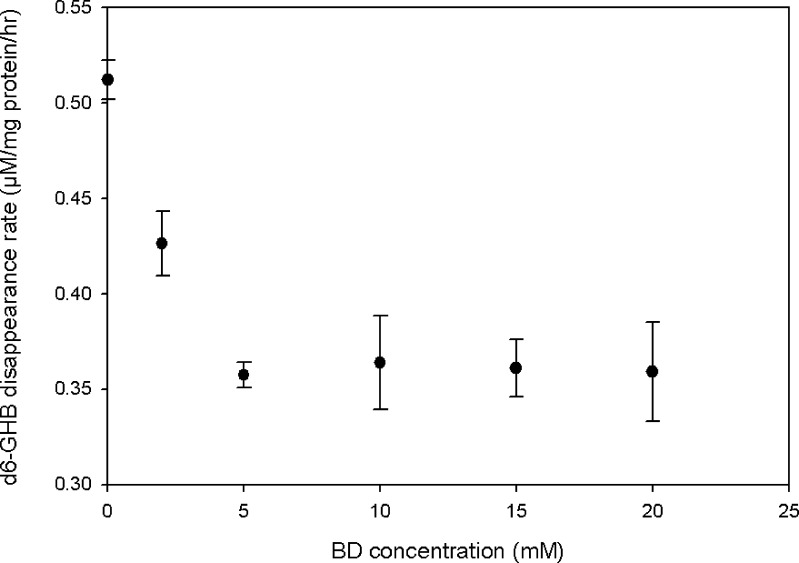
In vitro inhibition studies were carried out using the following general conditions: each 100 μL sample contained the indicated concentration of the substrate and inhibitor, 50 mM Tris (pH 7.4), 1 mM NAD and NADP, and 90 μL rat liver homogenate. The reagents were combined in a 650 μL microcentrifuge tube, vortexed and incubated in a water bath at 37°C. At 0 and 4 h, 35 μL of the mixture was added to 90 μL ice cold methanol containing the appropriate internal standards and vortexed to precipitate the proteins. The tube was then centrifuged at 16,000×g for 20 min at 4°C. The supernatant was transferred to vials and stored at −20°C prior to LCMS analysis. Two sets of experiments were performed to determine the inhibition profile of ETOH and GHB (n = 3 at each inhibitor concentration) on the disappearance of 90 μM of BD, using 20 μM d8-BD and 250 μM d6-GHB as internal standards for each compound. To study the effect of BD on GHB disappearance, d6-GHB (70 μM) was used as the substrate since the added BD degraded to (unlabeled) GHB as a metabolic product during the study period. In these studies, 20 μM d8-BD was used as the internal standard for the assay of d6-GHB concentration. Substrate disappearance rate was calculated as μM/mg protein/h.
LCMS analysis of plasma samples
A volume of 50 μL of plasma was aliquoted into a pre-chilled centrifuge tube and the following solutions were added: 5 μL each of d8-BD (1.2 mM) and d6-GHB (6 mM), 10 μL of water and 70 μL of methanol. The sample was capped, vortexed, shaken by a mechanical shaker for 20 min, and centrifuged at 4° C at 10,000×g for 20 min. An aliquot of the supernatant solution was then used for LCMS assay.
LC-MS analysis was conducted on a PE/SCIEX API 3000 triple quadrupole mass spectrometer (Forster City, CA), equipped with a turbo electrospray ionization source and Perkin Elmer Series 200 HPLC system (Norwalk, CT). HPLC was carried out at room temperature with an Aqua C18 125A column (150 × 4.6 mm internal diameter, 5 μm particle size) from Phenomenex (Torrance, CA) and a Security Guard cartridge (C18, 4.0 × 3.0 mm internal diameter, Catalog # AJ0-4287, Phenomenex, Torrance, CA). The mobile phase consisted of 67% of methanol (Burdick & Jackson, Muskegon, MI) and 33% 5 mM formic acid (Sigma, St. Louis, MO). The effective column flow rate was set at 200 μL per min, and the sample injection volume at 10 μL. The retention time for the analytes and internal standards was about 2.7 min and the run time of the assay was 5 min. The turbo electrospray ionization source was set at a voltage of 5,000 V and a temperature of 400°C with the curtain gas and the nebulizing gas both set at 8. The mass spectrometer was used in the positive ion mode and multiple reaction monitoring (MRM). Q1/Q3 m/z ratios for the parent/daughter ions of GHB, d6-GHB, BD and d8-BD were 105/87, 111/93, 91/73 and 99/81, respectively. All data were acquired and analyzed using the Analyst® 1.3.1 software (Applied Biosystems, Forster City, CA). Plasma standards comprising of GHB (60 μM to 7.2 mM) and BD (60 μM to 4.8 mM), in various combinations, and the indicated amounts of each of the deuterated internal standards, were prepared and used for calibration. GHB and BD concentrations in liver homogenates were assayed similarly.
Ethanol measurement
Blood ETOH was measured using a modified gas chromatography method with flame ionization detection (GC-FID) (7). Blood samples were precipitated with equal volume of 10% trichloroacetic acid containing propanol as internal standard, and the supernatant was injected directly on column. Good linearity (r2 > 0.99) was obtained in the range of 0.375 to 12 mM blood ETOH concentration.
Loss and regaining of righting reflex
Dose-related loss of righting reflex (LRR) after GHB or BD dosing was observed. The times for the onset and regaining of the righting reflex were recorded.
Population PK modeling
Nonlinear mixed-effects modeling in NONMEM VI (level 1.1, NONMEM Project Group, Icon Development Solutions, Ellicott City, Maryland, USA) (8) was applied. The first order conditional estimation method with the interaction estimation option and the ADVAN9 differential equation solver were used for all modeling in NONMEM.
We used visual predictive checks (VPC), the objective function in NONMEM, individual fits, and standard diagnostic plots for model development. For the VPC, the PK profiles were simulated from 0 to 300 min for each treatment and compound for 3,000 virtual rats based on the population PK model. The median and interquartile range (25–75 percentile) were calculated at every time point for each treatment and compound. These percentiles were plotted together with the observations against time to assess if the model described the central tendency and variability of the observations adequately.
Structural model
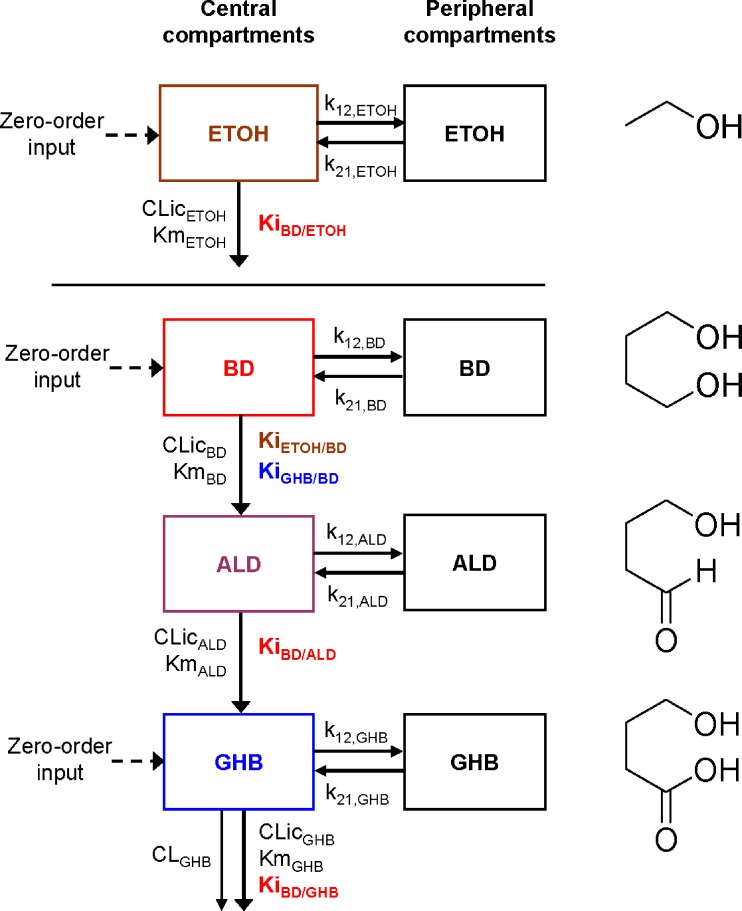
The structural models were built for the individual compounds (BD, GHB, and ETOH) separately based on the IV data for one compound at a time. One- or two- compartment models with mixed-order elimination (Michaelis–Menten) or parallel first-order and mixed-order elimination (Fig. 1) were considered. Data for BD, GHB, and BD+GHB were then modeled simultaneously (i.e., all treatments without ETOH). These data were modeled 1) without the putative semialdehyde (ALD) intermediate (5), 2) with a one-compartment model for ALD, or 3) with a two-compartment model for ALD. All six mutual interactions between BD, ALD, and GHB were considered.
Fig. 1.
Final structural model of the population PK analysis. The constant rate of infusion of BD, GHB, and ETOH was modeled as a time-delimited zero order input process. The disposition of each compound was described by a two-compartment model with mixedorder elimination for BD, ALD, and ETOH and by a parallel first-order and mixed-order elimination for GHB. The k12 and k21 are first-order intercompartmental transfer rate constants between the central and peripheral compartments. The CLic describes the intrinsic clearance and the Michaelis–Menten constant Km describes the molar drug concentration at which the rate of elimination is half-maximal. The inhibition constant KiX/Y denotes the inhibition of the elimination of compound Y by compound X. See Table II for all other parameter explanations
The individual structural models for BD, ALD, and GHB were then combined with the model for ETOH (Fig. 1). All mutual interactions between ETOH and BD, ALD, or GHB were assessed initially. The disposition parameters of all four compounds were estimated simultaneously for the model shown in Fig. 1. Forward inclusion and backward elimination techniques were systematically applied to determine the extent and significance of specific interactions.
The differential equations for the model depicted in Fig. 1 are shown below. Equations include several processes of competitive inhibition of elimination, viz., those of BD by ETOH, of BD by GHB, of ALD by BD, of GHB by BD, and of ETOH by BD. The initial conditions for all of the following differential equations are zero.
 |
1 |
 |
2 |
 |
3 |
 |
4 |
 |
5 |
 |
6 |
 |
7 |
 |
8 |
The A1NN are the amounts of compound NN in molar units in the central compartment and A2NN are the respective amounts in the peripheral compartment. The C1NN are the molar drug concentrations of compound NN in the central compartment. RInfusion,NN is the rate of infusion for compound NN and KiX/Y denotes the inhibition of the Michaelis–Menten elimination of compound Y by compound X. All other parameters are explained in Table II.
Table II.
Population PK Parameters for the Model shown in Fig. 1
| Parameter | Unit | Description | Estimates (%CV for Between Subject Variability) | |||
|---|---|---|---|---|---|---|
| BD | ALD | GHB | ETOH | |||
| CL | L/min | Clearance (first-order) | – | – | 0.00046 | – |
| Vmax | mmol/min | Maximum elimination rate | 0.0362a | 0.0168 | 0.00361a | 0.0410a |
| Clic | L/min | Intrinsic clearance | 0.0232 (11%) | 0.0377a | 0.0398 | 0.0550 (1.9%) |
| Km | mmol/L | Michaelis–Menten constant | 1.56 | 0.446 | 0.0906 (35%) | 0.746 (14%) |
| V | L | Volume of central compartment | 0.248 (11%) | 0.0476 | 0.010b (16%) | 0.205 (20%) |
| K12 | 1/min | Intercompartmental rate constant | 0.00231 | 0.0526c | 0.551 | 0.0338 |
| K21 | 1/min | Intercompartmental rate constant | 0.0150 | 0.0105 | 0.0554 | 0.0589 |
| Vss | L | Volume at steady state | 0.286a,c | 0.109a | 0.323a | |
| Inhibition constants | ||||||
| KiBD/ALD | mmol/L | BD inhibiting ALD | 3.67 (46%) | |||
| KiBD/GHB | mmol/L | BD inhibiting GHB | 3.56 (69%) | |||
| KiBD/ETOH | mmol/L | BD inhibiting ETOH | 2.24 (37%) | |||
| KiGHB/BD | mmol/L | GHB inhibiting BD | 15.2 (25%) | |||
| KiETOH/BD | mmol/L | ETOH inhibiting BD | 0.615 | |||
| CVCP | Proportional error | 17.5% | 12.8% | 2.32% | ||
| SDCP | mmol/L | Additive error | 0.0030 | 0.0186 | 0.233 | |
Since the average weight of each rat was about 300 g, volume estimates can be converted to a per kilogram basis by multiplying the listed volume estimates by 3.33. Parameter estimates for ALD are conditional on the assumptions made for volume of distribution of ALD, because the concentrations of this putative intermediate were not monitored in the present study
aCalculated from estimated model parameters. This parameter was not estimated by NONMEM
bVolume of the central compartment for GHB was fixed to the average plasma volume of rats
cVolume of distribution at steady-state for ALD was assumed to be the same as the volume of distribution at steady-state for BD
Oral absorption of BD
The area under the curve (AUC) was initially calculated by the log-linear trapezoidal method. To estimate the oral bioavailability of BD in rats, the time course of BD and GHB after oral administration of BD was modeled in NONMEM. The mean and between-subject variability of the structural model parameters were fixed to the values from the IV dataset for estimation of the absorption parameters, because only limited data were available after oral administration (n = 3 each dose) and because the absorption of BD was quite variable. Oral absorption was described by a first order process with or without a lag-time. The bioavailability and its variability were estimated using a logistic transformation to constrain the individual estimates between zero and 100%. Models with pre-systemic metabolism of BD to ALD, to GHB directly, or to both ALD and GHB were considered.
Parameter variability model
An exponential model was used to describe the inter-individual variability, Pi = θ exp(ηi), where Pi is the individual parameter estimate for the ith rat, θ is the population mean, and ηi is the individual random effect that describes the inter-individual variability. The ηi’s denote the differences of the individual PK parameter estimates from their population mean on the log scale for the ith rat. We estimated the variance of ηi and reported its square root, as this parameter is an approximation of the apparent coefficient of variation of a normal distribution on the natural log-scale.
Observation model
The residual unidentified variability was described by a combined proportional and additive error model,  . In this equation, C is the individual predicted concentration with no error and Y is the individual prediction including a proportional (CVC) and additive (SDC) residual error component. The ɛCVC and ɛSDC are random variables with mean zero and standard deviation CVC and SDC.
Statistics and non-compartmental analysis
Data are reported as average ± SD. Student’s t-test and ANOVA (Minitab 14, State College, PA) were applied where appropriate. For comparison of effects of GHB and BD on righting reflex, one-way ANOVA was followed by the post-hoc Bonferroni test. WinNonlin™ Professional version 5.0 (Pharsight Corporation, Palo Alto, CA) was used for statistics, graphical analysis, and non-compartmental analysis. Standard formulas as implemented in WinNonlin were applied.
RESULTS
LCMS assay
Because of the unique mass spectrometric characteristics of each analyte and internal standard, it was not necessary to separate these compounds by liquid chromatography. No degradation of BD was found after 24 h of storage in rat blood at 37°C. Plasma standards were also found to be stable at −20°C for at least 6 weeks. Because of the wide dynamic assay ranges for BD (60 to 5,000 μM) and GHB (60 to 7,200 μM), samples with concentrations lower than 600 μM GHB or 120 μM BD were determined using standard curves extending only to these limits. The intra-day assay variability (CV%) of GHB and BD at 60 μM (the standard with the lowest concentration) was found to be <7.7 and <2%, respectively (done on three separate days). The inter-day assay variability (CV%) for GHB and BD at 60 μM was less than 10.3 and 5.6% (n = 3), respectively. Linearity of the calibration curve was generally characterized by r2 ≥ 0.99. Recovery was within ± 10% of theoretical BD and GHB concentrations in quality control samples.
PK of BD, GHB, and ETOH when given alone
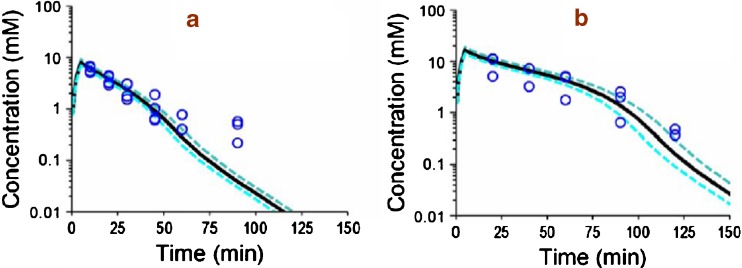
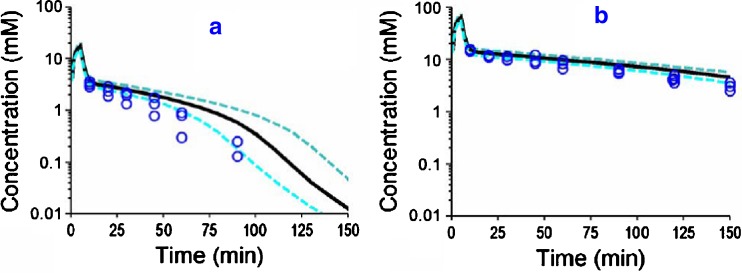
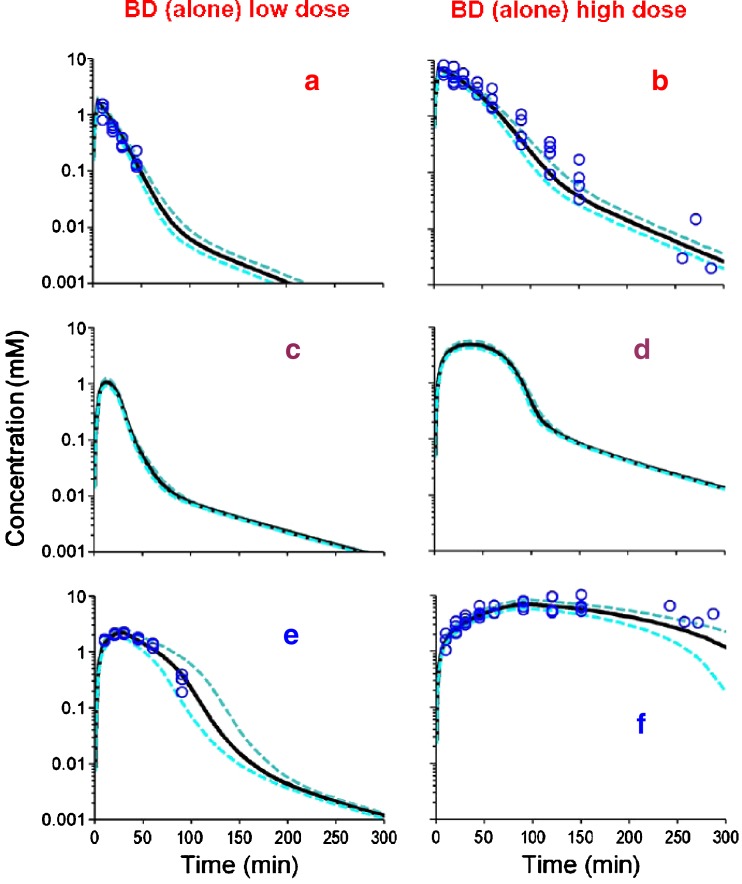
Figures 2, 3 and 4 show the individual experimental concentration-time observations for ETOH (Fig. 2), GHB (Fig. 3) and BD (Fig. 4) when each of the drugs was given alone at two dose levels (Table I, studies 1–6). The black lines in the figures denote the median predictions from the population model depicted in Fig. 1, while the blue lines denote the 25–75 percentiles of predictions from the model. The VPC shown in Fig. 2, 3 and 4 represent simulated model predictions. These simulated curves are only based on the population mean parameters and on the between subject variability and do not represent individual curve fits. To test the suitability of various models for describing the PK of each compound, the data from studies 1 to 6 (Table I) was modeled without the GHB data obtained from study 5 and 6 (which was metabolically generated from BD administration). Compared to a one-compartment model, a two-compartment model yielded an improvement in the objective function by 18.1 for GHB, by 11.4 for BD, and by 20.9 for ETOH (p < 0.05 for all comparisons, likelihood ratio test). Adding a first-order elimination component in parallel to the mixed-order (Michaelis–Menten) elimination improved the objective function by 5.5 (p = 0.02) for a one-compartment model and by 14.0 (p < 0.001) for a two-compartment model for GHB. The objective function neither improved for a one-compartment nor for a two-compartment model for BD or ETOH when a parallel first-order elimination pathway was included. Therefore, we chose a two-compartment model with mixed-order elimination for BD and ETOH and a two-compartment model with parallel first-order and mixed-order elimination for GHB.
Fig. 2.
VPC for ETOH after IV ETOH dosing for the final population PK model shown in Fig. 1 and Table II. This plot was based on 3,000 simulated concentration time curves for each treatment. The median and interquartile range were calculated from the predicted concentrations and should resemble the central tendency and variability of the observations. a ETOH (alone) low dose. b ETOH (alone) high dose
Fig. 3.
VPC for GHB after IV GHB dosing for the final population PK model shown in Fig. 1 and Table II. See legend for Fig. 2 for further details related to the modeling. a GHB (alone) low dose. b GHB (alone) high dose
Fig. 4.
VPC for BD and GHB after BD IV dosing for the final population PK model shown in Fig. 1 and Table II. See legend for Fig. 2 for further details related to the modeling. Theoretical concentration-time profiles for an unmonitored metabolic intermediate (ALD) are also presented (Panels c and d). a, b BD. c, d ALD. e, f GHB
PK of BD and GHB at two dose levels
A population PK model was then estimated based on all data from GHB given alone (studies 3 and 4; Fig. 3), and BD and the generated GHB after dosing BD (studies 5 and 6, Fig. 4, panels a–b, e–f). We found that a model including a central and peripheral compartment for the unmonitored semialdehyde intermediate (ALD) was significantly (delta obj.: 67.5, p < 0.001) superior to that without invoking this intermediate, and to that with a single ALD compartment (delta obj.: 9.7, p = 0.01). The inhibition of BD elimination by ALD and of GHB elimination by ALD only improved the objective function insignificantly (delta obj. < 1) and these terms were also shown to be insignificant by forward inclusion based on the full dataset. All other interactions improved the objective function and were considered for analysis of the full dataset including the ETOH data. Statistical significance of each interaction was assessed by backward elimination and forward inclusion based on the full dataset. Preliminary modeling showed that use of competitive inhibition processes described our data better than models involving non-competitive inhibition (results not shown), and subsequent model development therefore only employed competitive inhibition.
PK of ETOH, BD and GHB at various dose levels
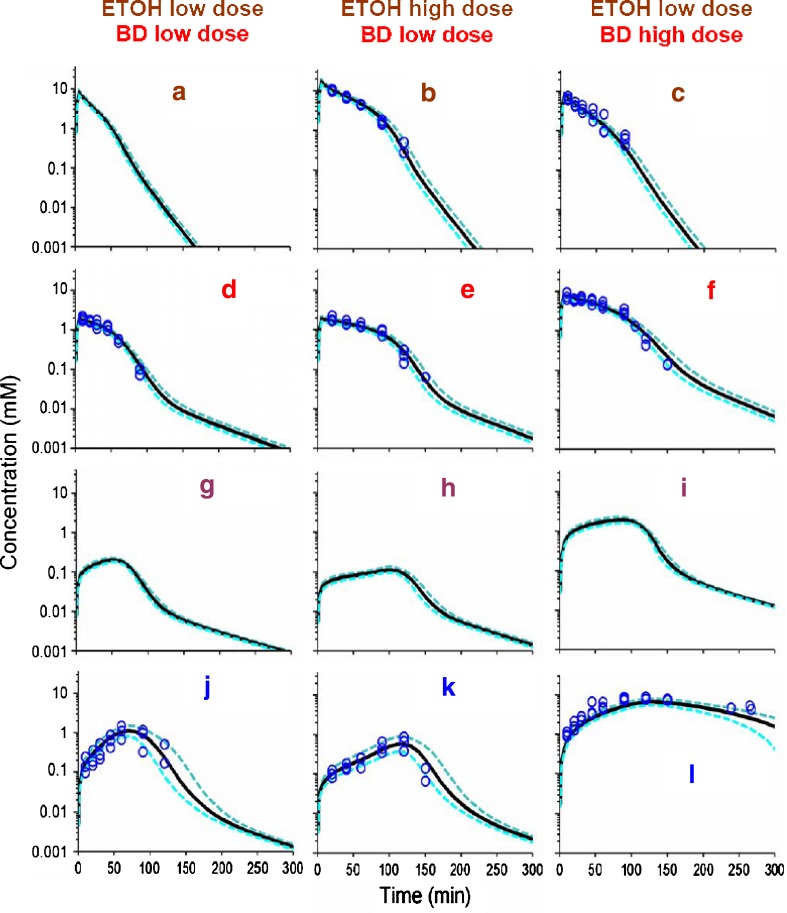
Figure 5 shows the concentration-time observations for all three compounds when ETOH was co-administered with BD and GHB separately. A composite population PK model for ETOH, BD, ALD, and GHB was then built by simultaneous estimation of all data from studies 1 to 11 (Table 1), by combining the PK model for ETOH with that obtained from simultaneous estimation of BD and GHB (see above), and by studying all possible mutual interactions of ETOH with BD, ALD, and GHB. The parameters of the combined model for ETOH, BD, ALD, and GHB were re-estimated for each interaction model of interest. The mutual interaction of ETOH and BD was most significant. The increase in the objective function in NONMEM and the associated p-value (likelihood ratio test) after backward elimination of the respective interaction term from the final model were: inhibition of BD elimination by ETOH (+181, p < 0.001), inhibition of ETOH elimination by BD (+14.3, p = 0.001), inhibition of ALD elimination by BD (+7.3, p = 0.026), inhibition of BD elimination by GHB (+6.4, p = 0.042), and inhibition of GHB elimination by BD (+3.0, p = 0.221). The latter two interaction terms were included in the final model, since additional in vitro data showed the presence of this interaction and since the estimates for KiBD/GHB and KiGHB/BD were within the range of concentrations for BD and GHB. Inclusion of the mutual interaction between ALD and ETOH, GHB and ETOH, or GHB and ALD did not improve the objective function significantly and was not supported by additional experimental data. Table II shows the mean population PK parameters and their between-subject variability.
Fig. 5.
VPC for ETOH, BD and GHB after BD/ETOH coadministration for the final population model shown in Fig. 1 and Table II. See legend for Fig. 2 for further details related to the modeling. Data for ETOH in panel a (study #7) were not experimentally monitored, and the curves represent simulated model predictions from the population PK model. Theoretical concentration-time profiles for an unmonitored metabolic intermediate (ALD) are also presented (Panels g–i). a–c ETOH. d–f BD. g–i ALD. j–l GHB
In arriving at our final model, we fixed the volume of ALD arbitrarily to retain mathematical identifiability because the concentrations of this putative intermediate were not measured. As an approximation, the volume of distribution at steady-state (Vss) of ALD was arbitrarily set to that of BD rather than that of GHB, using the rationale that BD and ALD are of similar molecular weight, and that they (but not GHB) are both unionized at physiological pH. It was difficult to estimate the volume of the central compartment for GHB, as we had no observations before 10 min after start of the 5 min infusion for GHB. Therefore, we fixed the volume of the central compartment for GHB to the average rat plasma volume of 10 mL for a 300 g rat.
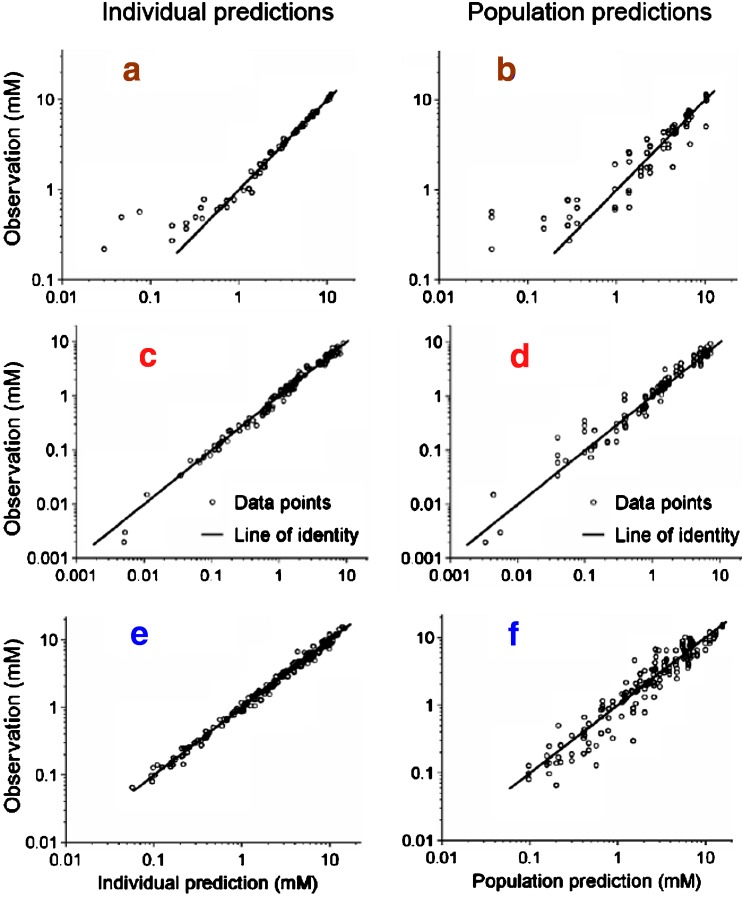
Comparisons of the observations vs. individual predictions and observations vs. population predictions, shown in Fig. 6, revealed precise curve fits and no systematic bias for all compounds except some low concentrations for ETOH. The three most obviously misfit ETOH concentrations were derived from the low dose ETOH group when ETOH was given alone (study 1, Table I). The VPC (Figs. 2, 3, 4 and 5) showed that the model had a highly sufficient predictive performance for all compounds and dose levels studied. There were minor mispredictions for the low dose group when ETOH was given alone (Fig. 2, panel a) and when GHB was given alone (Fig. 3, panel a). Parameter estimates shown in Table II indicated that the intrinsic clearance of ETOH was about 2.4 times that of BD and about 1.4 times that of GHB. The mixed-order elimination was saturable at lower molar concentrations for GHB (KmGHB = 0.0906 mM) than for ETOH (KmETOH = 0.746 mM) and BD (KmBD = 1.56 mM). Although the first-order elimination of GHB contributed a minor fraction to the total GHB clearance at concentration far below the Michaelis–Menten constant (KmGHB = 0.0906 mM), the first-order elimination of GHB was more important at the higher GHB concentrations achieved by all dosage regimens involving GHB (Figs. 3, 4e–f, 5j–l). The average GHB concentration was above KmGHB for at least 2 h for all studied dosage regimens that included GHB.
Fig. 6.
Observations vs. individual predictions (left column) and observations vs. population predictions (right column) for BD, GHB, and ETOH for the final population PK model shown in Table II. a, b ETOH. c, d BD. e, f GHB
The mutual interaction of ETOH and BD was found to be the most significant among those studied. The average ETOH concentration exceeded the inhibitory constant for the inhibition of BD elimination by ETOH (KiETOH/BD = 0.615 mM) for about 1 to 2 h depending on the ETOH dose (Fig. 5a–c) and the average BD concentration exceeded KiBD/ETOH (2.24 mM) for about 1 to 1.5 h (Fig. 5f) at the high BD dose of 6.34 mmol/kg but not at the low BD dose (Fig. 5d–e). The hypothetical inhibition of ALD elimination by BD had a slightly higher inhibitory constant (KiBD/ALD = 3.67 mM) compared to the inhibition of ETOH elimination by BD. Elimination of GHB was inhibited to some degree by BD (KiBD/GHB = 3.56 mM) and the inhibition of BD elimination by GHB (KiGHB/BD = 15.2 mM) was less extensive, given the achieved concentrations of GHB (Figs. 4e–f, 5j–l).
BD Oral Bioavailability
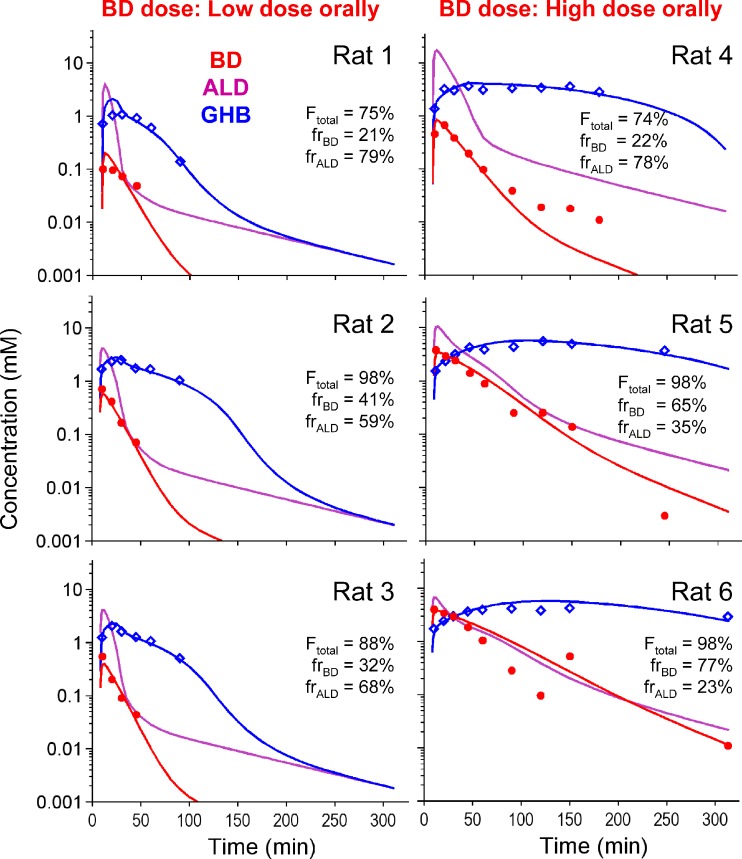
Figure 7 shows the individual plasma concentrations of BD and GHB observed after oral BD dosing at 1.58 and 6.34 mmol/kg. Substantial inter-animal variability was observed. Non-compartmental analysis yielded extrapolated areas from time of last measured concentration to infinity of less than 10% of total AUC. The average ± SD AUC0–∞ for BD were 8.72 ± 5.33 and 117 ± 82 mM min (a 13-fold difference) for the 1.58 or 6.34 mmol/kg single oral dose, respectively (a 4-fold difference in dose). The corresponding AUC after IV infusion at the same doses were 23.2 ± 3.1 and 303 ± 82.4 mM min (also about a 13-fold difference). These results indicated that nonlinear PK were also operative after oral BD administration. Thus, the ratio of oral/IV AUC will yield a biased estimate of F, and its appropriate estimation would require modeling (4). Based on this area ratio from non-compartmental analysis, the oral bioavailability of BD was 40.1 ± 28.0% for the low dose and 48.5 ± 35.2% for the high dose.
Fig. 7.
BD, ALD, and GHB concentration after an oral dose of 1.58 or 6.34 mmol/kg BD. The plot shows the individual observations in each rat and the individual predictions for BD, ALD and GHB. Ftotal is the sum of the fraction of drug available to the systemic circulation as BD or ALD. frBD: Fraction of available BD dose that becomes available as BD. frALD: Fraction of available BD dose that becomes available as ALD
Modeling results indicated that the estimated half-life of absorption was 0.98 min with a lag-time of 7.5 min (10% between-subject variability). The total bioavailability of the dose absorbed (i.e., as BD plus ALD) was 93%, with individual values ranging from 74 to 98% including both dose levels, and was not apparently dose-dependent. Inclusion of pre-systemic metabolism of BD to ALD in the model was statistically significant and improved the curve fits (Fig. 7). The presence of pre-systemic metabolism was additionally supported by the fact that the AUC(po)/AUC(iv) ratio of the metabolite GHB was about 1.6 times higher than the same ratio for BD (results not shown). Direct pre-systemic metabolism to GHB was estimated to be negligible and not included in the final model. For the 1.58 mmol/kg dose, 70% of the available dose was estimated to enter the system as ALD (individual values ranging from 59 to 79%). For the 6.34 mmol/kg dose, 45% of the available dose was estimated to enter the system as ALD (individual values ranging from 23 to 78%).
In vitro metabolism of BD and GHB in liver homogenates
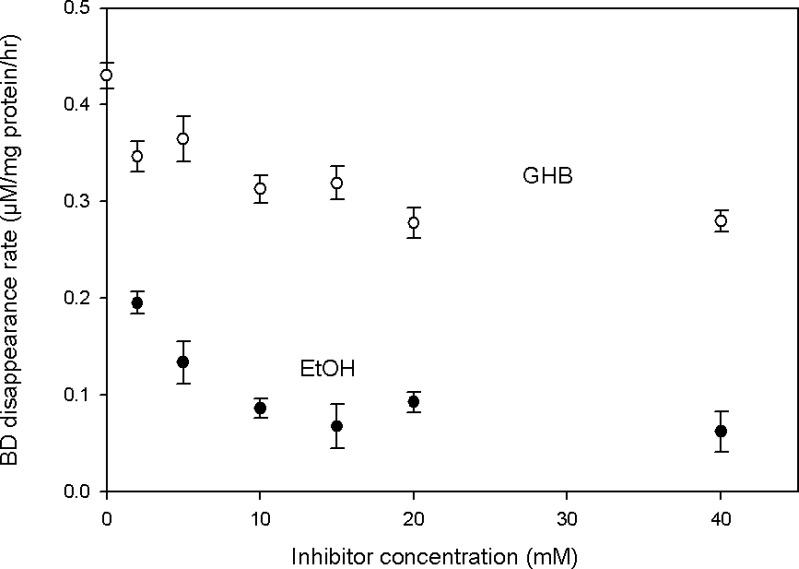
Figure 8 shows that BD disappearance in rat liver homogenates was concentration-dependently inhibited by both GHB and ETOH. Two-way ANOVA indicated that the inhibitory effects of both compounds were significant (p < 0.001) and that the effect of ETOH was substantially greater than that of GHB (p < 0.001), qualitatively consistent with the results obtained from PK analysis of the in vivo interaction studies (Table II). Added BD also significantly and concentration-dependently inhibited d6-GHB metabolism in liver homogenates (Fig. 9, p = 0.001, one-way ANOVA).
Fig. 8.
Effect of added GHB and ETOH on the in vitro disappearance of 90 μM BD in supernatents of liver homogenates (n = 3 for each inhibitor concentration)
Fig. 9.
Effect of added BD on the in vitro disappearance of 70 μM d6-GHB in supernatents of liver homogenates (n = 3 for each inhibitor concentration)
Effects of GHB and BD on LRR
At the lower dose (1.58 mmol/kg IV) of GHB and BD, LRR was not observed in any of the animals, either in the absence or presence of ETOH, at the doses examined. LRR was observed at 6.34 mmol/kg IV GHB and BD. The onset of LRR was significantly faster after GHB vs. BD (Table III), and the total duration of LRR trended to be longer for the BD-dosed vs. GHB-dosed animals. The co-administration of ETOH did not alter the time to LRR significantly. However, the total duration of LRR was significantly longer for the GHB + ETOH group compared to the GHB group (Table III).
Table III.
Effects of BD and GHB on Loss or Regain of Righting Reflex (LRR or RRR) in Rats
| Treatment | Time to LRR (min)a,b | Time to RRR (min)a,b | Total duration of LRR (min)a,c |
|---|---|---|---|
| GHB | 6.7 ± 0.6 | 124 ± 3 | 117 ± 2 |
| GHB + ETOH | 6.3 ± 0.6 | 142 ± 4 | 135 ± 3 |
| BD | 72.0 ± 9.1 | 264 ± 19 | 192 ± 28 |
| BD + ETOH | 87.3 ± 7.2 | 257 ± 16 | 169 ± 20 |
All compounds were dosed intravenously at 6.34 mmol/kg, n = 3–4 in each group
a p < 0.003, among all four groups for this parameter
b p < 0.001, by post-hoc analysis, between both GHB groups vs. both BD groups
c p < 0.05, by post-hoc analysis, between GHB group vs. both BD groups, and GHB+ETOH group vs. BD group
One of the three animals dosed with oral 6.34 mmol/kg BD did not exhibit LRR. For the remaining two animals, the times to LRR were 113 and 115 min, and the total duration of LRR were 132 and 198 min respectively. There were no apparent relationship between plasma GHB concentration and LRR.
DISCUSSION
The use of deuterated derivatives of BD and GHB allowed for unambiguous and simultaneous determination of both compounds in a relatively simple LCMS assay, removing the requirement for on-column separation of the analytes. The plasma samples were sufficiently free from contamination by extraneous substances after protein precipitation with methanol that solid phase extraction for GHB (9) was not needed. Assay recovery of both BD and GHB was complete, since calibration curves for plasma and aqueous standards were essentially super-imposable. In most studies, the lower limit of quantification was set at 60 μM for both compounds, which was the lowest concentration used in constructing the standard curves, and at which intra-day and inter-day assay variabilities were obtained and judged to be satisfactory.
Both one- or two-compartment models were described in the literature for ETOH and GHB (4,10) but they were estimated by naïve averaging or naïve pooling. In the present study, population PK modeling identified two-compartment models for all compounds to be significantly superior to one-compartment models: this technique is probably superior to those used in prior modeling efforts because it estimated the model parameters from all data simultaneously and accounted for between-subject variability. The observed and fitted concentrations shown in Fig. 6 for the population PK model indicated precise and unbiased curve fits for ETOH, BD and GHB. The three misfits at low ETOH concentrations for the group receiving the low ETOH dose are probably of minor relevance for the PK interaction. VPC indicated that the population PK model predicted the central tendency (and variability) of the observed concentrations well (Figs. 2, 3, 4 and 5). The minor mis-predictions for the low dose ETOH group and for the low dose GHB group are probably of minor importance for the PK interaction, as primarily low concentrations were mis-predicted and as predictions were unbiased for the other regimens including ETOH and GHB. For VPC based on a small sample size (Figs. 2, 3, 4 and 5), the observations might not represent the central tendency of the whole population due to random between subject variability. Therefore, these VPC should be interpreted conservatively.
The presence of saturable elimination was revealed by administering BD at two dose levels (Fig. 4). Population PK modeling could estimate the parameters of the ALD, except for its volume of distribution which is mathematically not identifiable. Although this intermediate was not monitored experimentally, its inclusion as a PK intermediate improved the objective function and overall goodness of fit.
Our estimates for ETOH (Table II) were comparable to those from Matsumoto et al. (11) and Shimada et al. (12) The saturable elimination of ETOH has been well described in the literature (13–15). Our PK parameter estimates for ETOH generally agree with those reported in two previous studies (11,12): Vss (present study: 1.08 L/kg [0.323 L for a 300 g rat], literature estimates: 0.78 and 0.79 L/kg), and Km (present study: 0.746 mmol/L, literature estimates: 1.52 and 2.57 mmol/L). Although our Vmax estimate was lower (present study: 0.0410 mmol/min, literature estimates: 0.197 and 0.307 mmol/min), the intrinsic clearance (the ratio of Vmax and Km) of the saturable elimination process at low concentrations was comparable (present study: 0.0550 L/min, literature estimates: 0.13 and 0.12 L/min). A potential reason for this difference is the use of a naïve averaging approach in literature studies vs. that of population PK methodology in the present study.
The current study confirmed the presence of saturable GHB elimination previously reported in rats (4). Our estimate for Vss for GHB of 0.363 L/kg (0.109 L for a 300 g rat, Table II) was slightly lower than the literature estimates of 0.575 L/kg from Lettieri et al. (4) and of 0.690 L/kg from Van Sassenbroeck et al. (10) The intrinsic clearance of the saturable elimination process was 0.0398 L/min in this study, which fell well within the range of literature estimates (4,10) of 0.012 L/min and 0.046 L/min. Our estimated Michaelis–Menten constant of 0.0906 mmol/L indicated that GHB elimination was saturated at lower concentrations compared to the estimates of 3.25 and 0.721 mmol/L reported in literature (4,10). The differences in the estimated Michaelis–Menten constants might be due to the use of a two-compartment model in our study and a one-compartment model in the study by Lettieri et al. (4) However, the GHB clearance at low concentrations was similar between this study and literature reports. Similar to a previous analysis (10), we also found a 2-compartment model to fit the GHB PK results better than a 1-compartment model, although our sampling schedule did not include experimental data points during the fast initial disposition phase.
All mutual competitive interactions among BD, ALD, GHB, and ETOH were considered in the population PK analysis of this study. Although cross reactivity of these enzymes for BD, GHB, and their intermediate metabolic products has not been defined, the presence of mutual competitive inhibition is in principle possible based on the similarity of their chemical structures (Fig. 1) and the metabolic pathways involved.
Follow-up in vitro metabolic studies using liver homogenates supported the presence of mutual metabolic inhibition between GHB and BD, as well as inhibition of BD metabolism by ETOH. Under our experimental conditions, GHB was shown to inhibit the metabolic disappearance of BD (Fig. 8) in a concentration-dependent manner. ETOH predictably also inhibited BD metabolism (Fig. 8), more strongly than GHB, consistent with a lower value for KiETOH/BD (0.615 mmol/L) than for KiGHB/BD (15.2 mmol/L), as reported in Table II. The disappearance of d6-GHB was also shown to be inhibited by added BD (Fig. 9). However, since BD is metabolized to form GHB, the extent of inhibition exerted by BD, as such, could not be clearly defined in these in vitro experiments, because increased GHB accumulation (as a result of BD breakdown) might slow down its further degradation due to a shift into more involvement of saturable kinetics. The inhibitory effect of ETOH co-administration on BD clearance was apparent by visual inspection (Fig. 5), and supported by PK modeling. This competitive interaction was consistent with our in vitro data showing an inhibitory effect of ETOH on BD elimination. In brain or liver alcohol dehydrogenase preparation from rats, ETOH has also been shown to be a competitive inhibitor of BD metabolism (16).
The estimates of the population PK model (Table II) identified the mutual competitive inhibition of ETOH and BD as the most significant among those studied. The similarity of KiETOH/BD and KmETOH suggests that the affinity (KmETOH) of ETOH to the enzyme(s) metabolizing ETOH was similar to that (those) involved in ETOH-mediated inhibition of BD elimination (KiETOH/BD). The same conclusion applies to BD and the similarity of KiBD/ETOH and KmBD. Overall, this result suggests that BD and ETOH were oxidized by similar oxidative enzymes.
These modeling results showed that co-administration of BD and ETOH may prolong the exposure to both compounds and may therefore increase their toxicity. Indeed, Poldrugo et al. (17) had reported that ethanol increased the mortality rate and tissue damage observed in rats after BD administration.
Population PK modeling showed that BD inhibited both ALD and GHB elimination with inhibitory constants (KmBD/ALD and KmBD/GHB) that were about 2.3 times larger than the Michaelis–Menten constant for BD (KmBD) elimination (Table II). Therefore, this inhibition was less pronounced compared to the inhibition of ETOH elimination by BD. Larger estimates for KiBD/ALD and KiBD/GHB compared to KmBD could be rationalized if BD did not affect all metabolic pathways of ALD and GHB. ALD is likely to be oxidized by aldehyde dehydrogenase(s) and possibly other enzymes, and it is possible that BD could only competitively inhibit some of these reactions. As our model only included the net elimination from all metabolizing enzymes as one Michaelis–Menten process, it seems reasonable that the inhibitory constant KiBD/ALD is estimated to be larger than KmBD.
Poldrugo and Snead (18) showed that chronic ETOH dosing produced a marked increase in GHB in the liver but not in the brain. Van Sassenbroeck et al. (10) found no significant change in GHB AUC following IV ETOH infusions to steady-state concentrations of 300 to 3,000 μg/ml, i.e., 6.52 to 65.2 mM. Our interaction experiments resulted in peak plasma ETOH concentration of less than 10 mM, and we also did not observe any PK interaction between ETOH and GHB.
Since BD is abused by ingestion, it was important to understand its oral absorption rate and bioavailability. Due to the saturable elimination of BD and GHB, the ratio of AUC from non-compartmental analysis after oral and iv dosing is inappropriate for the calculation of relative extent of bioavailability. In this situation, modeling of oral dosing data to estimate F and absorption rate is preferred (19). The population PK model that included the nonlinear disposition of BD, ALD, and GHB was used to evaluate the rate and extent of BD absorption. The final absorption model indicated a rapid absorption of BD (half-life: 0.98 min) after a 7.5 min lag-time. Inclusion of pre-systemic metabolism significantly improved the objective function and the goodness of fit plots for the simultaneous fit of BD and GHB after oral BD administration. The individual predictions vs. observations (Fig. 7) indicated a good fit of the model to the data. The model estimated a significant component of pre-systemic metabolism from BD to ALD, whereas direct pre-systemic metabolism to GHB appeared negligible. The total bioavailability (sum of absorbed BD and ALD) was estimated at 93%. At the lower dose, an average of 70% (range: 59 to 79%) of the dose were estimated to enter the system as ALD and this fraction was 45% (23 to 78%) at a 4-fold higher dose. These results suggest that pre-systemic metabolism to ALD might have become more saturated at the higher dose, although further studies are required to confirm this speculation.
Although the experiments were not designed to test the pharmacological effects produced by these compounds, we did observe LRR at the higher dose (6.34 mmol/kg) of GHB and BD (Table III). As we have reported previously (4), plasma GHB concentration bore little apparent relationship with the onset and regaining of righting reflex, and our present study confirmed this observation. One possible explanation would be a pharmacodynamic effect of the ALD intermediate. However, additional data are required to support this hypothesis. Our study indicated that BD administration, either intravenously or orally, led to a slower onset of LRR, consistent with the need for metabolic activation to GHB. The total duration of LRR from BD dosing is slightly less than 2-fold longer than that from GHB dosing at 6.34 mmol/kg, indicating that BD might be a more sustained sedating agent than GHB, albeit with a slower onset (Table III). At the ETOH doses administered, the onset and duration of LRR were not substantially altered with either GHB or BD dosing. However, the duration of LRR was significantly longer for the GHB + ETOH group than for the GHB group, in agreement with literature findings (10).
CONCLUSIONS
In summary, we have developed a sensitive LCMS assay to simultaneously measure BD and GHB in plasma. This assay allowed us to examine the PK of BD and its interaction with GHB and ETOH. The proposed population PK model incorporated the metabolic pathway from BD via ALD to GHB. The final model included two compartments each for ETOH, BD, ALD, and GHB, saturable elimination of each compound, and several mutual inhibitory processes among these compounds. The mutual inhibition between ETOH and BD was found to be the most significant. Thus, co-administration of these two substances of abuse may result in enhanced in vivo drug exposure to both. Our studies therefore provided a PK rationale for the increased toxicity observed when ETOH and BD were co-administered (17), although at the doses studied here, a pharmacodynamic parameter (LRR) was not significantly affected by ETOH co-administration. The PK model proposed here may serve as a framework for further understanding of the pharmacology and toxicity of GHB and BD in humans, particularly at toxicological doses when the effects of metabolic inhibition and saturation of metabolic pathways are likely to be more important.
Acknowledgements
This work was supported in part by NIH grant DA14988.
References
- 1.Camacho A., Matthews S. C., Murray B., Dimsdale J. E. Use of GHB compounds among college students. Am. J. Drug Alcohol Abuse. 2005;31(4):601–607. doi: 10.1081/ADA-200062545. [DOI] [PubMed] [Google Scholar]
- 2.Lettieri J., Fung H. L. Absorption and first-pass metabolism of 14C-gamma-hydroxybutyric acid. Res. Commun. Chem. Pathol. Pharmacol. 1976;13(3):425–437. [PubMed] [Google Scholar]
- 3.Lettieri J., Fung H. L. Improved pharmacological activity via pro-drug modification: comparative pharmacokinetics of sodium gamma-hydroxybutyrate and gamma-butyrolactone. Res. Commun. Chem. Pathol. Pharmacol. 1978;22(1):107–118. [PubMed] [Google Scholar]
- 4.Lettieri J. T., Fung H. L. Dose-dependent pharmacokinetics and hypnotic effects of sodium gamma-hydroxybutyrate in the rat. J. Pharmacol. Exp. Ther. 1979;208(1):7–11. [PubMed] [Google Scholar]
- 5.R. D. Irwin. NTP summary report on the metabolism, disposition, and toxicity of 1,4-butanediol (CAS No. 110-63-4). Toxic. Rep. Ser. 54:1–28, A21–28, B21–25 (1996). [PubMed]
- 6.Lowry O. H., Rosebrough N. J., Farr A. L., Randall R. J. Protein measurement with the Folin phenol reagent. J. Biol. Chem. 1951;193(1):265–275. [PubMed] [Google Scholar]
- 7.Boje K. M., Fung H.L. Characterization of the pharmacokinetic interaction between nifedipine and ethanol in the rat. J. Pharmacol. Exp. Ther. 1989;249(2):567–571. [PubMed] [Google Scholar]
- 8.S. L. Beal, L. B. Sheiner, A. J. Boechmann (eds.). NONMEM Users Guides. Version 6, Icon Development Solutions, Ellicott City, 1989–2006.
- 9.Fung H. L., Haas E., Raybon J., Xu J., Fung S. M. Liquid chromatographic-mass spectrometric determination of endogenous gamma-hydroxybutyrate concentrations in rat brain regions and plasma. J. Chromatogr. B Anal. Technol. Biomed. Life Sci. 2004;807(2):287–291. doi: 10.1016/j.jchromb.2004.04.022. [DOI] [PubMed] [Google Scholar]
- 10.Van Sassenbroeck D. K., De Paepe P., Belpaire F. M., Buylaert W. A. Characterization of the pharmacokinetic and pharmacodynamic interaction between gamma-hydroxybutyrate and ethanol in the rat. Toxicol. Sci. 2003;73(2):270–278. doi: 10.1093/toxsci/kfg079. [DOI] [PubMed] [Google Scholar]
- 11.Matsumoto H., Fujimiya T., Fukui Y. Role of alcohol dehydrogenase in rat ethanol elimination kinetics. Alcohol Alcohol Suppl. 1994;29(1):15–20. [PubMed] [Google Scholar]
- 12.Shimada J., Miyahara T., Otsubo S., Yoshimatsu N., Oguma T., Matsubara T. Effects of alcohol-metabolizing enzyme inhibitors and beta-lactam antibiotics on ethanol elimination in rats. Jpn. J. Pharmacol. 1987;45(4):533–544. doi: 10.1254/jjp.45.533. [DOI] [PubMed] [Google Scholar]
- 13.Mumenthaler M. S., Taylor J. L., Yesavage J. A. Ethanol pharmacokinetics in white women: nonlinear model fitting versus zero-order elimination analyses. Alcohol Clin. Exp. Res. 2000;24(9):1353–1362. doi: 10.1111/j.1530-0277.2000.tb02103.x. [DOI] [PubMed] [Google Scholar]
- 14.Matsumoto H., Minowa Y., Nishitani Y., Fukui Y. An allometric model for predicting blood ethanol elimination in mammals. Biochem. Pharmacol. 1999;57(2):219–223. doi: 10.1016/S0006-2952(98)00292-5. [DOI] [PubMed] [Google Scholar]
- 15.Wagner J. G., Wilkinson P. K., Ganes D. A. Parameters Vm' and Km for elimination of alcohol in young male subjects following low doses of alcohol. Alcohol Alcohol. 1989;24(6):555–564. doi: 10.1093/oxfordjournals.alcalc.a044959. [DOI] [PubMed] [Google Scholar]
- 16.Poldrugo F., Snead O. C., 3rd 1,4-Butanediol and ethanol compete for degradation in rat brain and liver in vitro. Alcohol. 1986;3(6):367–370. doi: 10.1016/0741-8329(86)90055-8. [DOI] [PubMed] [Google Scholar]
- 17.Poldrugo F., Barker S., Basa M., Mallardi F., Snead O. C. Ethanol potentiates the toxic effects of 1,4-butanediol. Alcohol Clin. Exp. Res. 1985;9(6):493–497. doi: 10.1111/j.1530-0277.1985.tb05589.x. [DOI] [PubMed] [Google Scholar]
- 18.Poldrugo F., Snead O. C., 3rd Effect of ethanol and acetaldehyde on gamma-hydroxybutyric acid in rat brain and liver. Subst. Alcohol Actions Misuse. 1984;5(5):263–271. [PubMed] [Google Scholar]
- 19.Jusko W. J., Koup J. R., Alvan G. Nonlinear assessment of phenytoin bioavailability. J. Pharmacokinet. Biopharm. 1976;4(4):327–336. doi: 10.1007/BF01063122. [DOI] [PubMed] [Google Scholar]


