Abstract
The present study analyzed the thickening properties of Carbopol 974 and 971 in a 50:50 mixture of water/Silsense™ A-21, a new cationic silicon miscible in any proportion with water. Samples were prepared by simply dispersing different Carbopol amounts (0.5–4%) at room temperature or at 70°C without neutralizing. Temperature sweep and time sweep analysis did not reveal significant structural changes at increasing temperature in the samples prepared following the first procedure. On the other hand systems obtained at 70°C possessed higher elastic character particularly at polymer concentration higher than 2% (w/v). Analysis of the G′ and G″ vs frequency curves by using different fitting equations (linear fitting, power law) gave information about the viscoelastic properties of the systems. The fitting of the frequency spectra and the calculation of the relaxation times from the master curves outlined the structural differences within the samples prepared with the two different procedures, confirming stronger gel-like behaviour for the samples prepared by the heating procedure. High preparation temperature promoted the polymer–solvent interactions, aiding the solvation of Carbopol. Heating facilitated polymer–solvent and polymer–polymer interaction, giving rise to a better organised structure typical of gel-like systems. Furthermore this preparation method provided good stability properties as shown by the stress sweeps tests performed during the three months of storage. The interpretation of the rheological results was supported by statistical analysis. A design methodology (screening and optimisation) was also applied in order evaluate the influence on dynamic rheological moduli of several parameters (polymer type and concentration, preparation method, temperature of the tests). This last method showed the relevance of the interaction of two main factors: polymer concentration and preparation procedure. Thus, statistical analysis confirmed that temperature increased the polymer–solvent interaction and improved the viscoelastic properties of the systems, particularly when Carbopols were present in considerable amounts.
Key words: carbopol, factorial design, rheology, semisolid, silicone, viscoelasticity
INTRODUCTION
Silsense™ A-21 is a cationic silicone prepared by the alkoxylation of amino-functional silicones. The introduction of amine functionality into a silicone polyether represents an innovation to overcome the hydrophobic nature of these traditional compounds and create a cationic silicone. This modification enhances the molecule’s ability to form ionic bonds with keratinaceous substrates and makes this amino-functional silicone miscible at any proportion with ethanol, propylene glycol and, most interestingly, with water (1). Thus pure Silsense™ A-21 or different Silsense™ A-21/water ratios could be used as a vehicle in order to create an easily prepared model system that is able to incorporate and dissolve a large number of drugs that are usually insoluble or poorly soluble in the water medium. As an example, pure Silsence™ A-21 at room temperature can produce saturated solutions (Cs) of 28, 6.5 and 5 g/100 ml of ibuprofen, probenecid and nimesulide respectively, as measured in our laboratory. A drug concentration equal to Cs/2 can be maintained in solution even after aqueous dilution to final water contents of 66, 66 and 20%, for ibuprofen, probenecid and nimesulide, respectively.
These systems could be very effective for dermal and transdermal drug delivery or for controlled drug delivery systems if thickened and transformed into gels. Carbopols, which are very high molecular weight polymers of acrylic acid, have been used mainly in liquid or semisolid pharmaceutical formulations, such as gels, suspensions and emulsions, as a thickening and viscosity agent, in order to modify flow characteristics. In particular, Carbomer grades with no residual benzene content and polymerised in ethyl acetate can be used in oral preparations, in suspensions, in tablets (2,3) and certainly in topical preparations.
After neutralization of the ionized carboxylic groups, Carbopol aqueous dispersion gives rise (3) to the formation of strong gels whose rheological and mucoadhesive properties were well characterised in previous works (4–7). In addition, neutralized Carbopol 934P polymeric systems were studied in different mixtures of propylene glycol and glycerol, with the addition of a certain amount of water necessary for the neutralization. These studies showed that the addition of water to non-aqueous Carbopol samples strongly increased their elasticity, since it promoted polymer–solvent interaction and affected the degree of entanglement between different polymer chains (8,9).
Previous works have already demonstrated the possibility of formulating Carbopol systems using different hydrophilic solvents (PEG 400, Glycerine and Tetraglycol; 10,11) without neutralization.
Therefore, this study investigated the behaviour of these polymers in a water-silicone medium, avoiding neutralization and the influence of temperature, particularly during the preparation step. Pure Silsense™ A-21 proved ineffective for Carbopol dispersion and gel formation since Carbopol precipitated after neutralisation in a Silsense/water/Carbopol system. In fact, water-Silsense ratios with a high percentage of silicon (over 80%) give rise to difficulties in polymer dispersion, while systems with high water percentages are at a disadvantage in dissolving drugs with poor water solubility. For these reasons, the 50:50 ratio was considered a good compromise.
Thus, the aim of this paper was to characterize these Carbopol/Silsense systems. A statistical approach was used in addition to the rheological analysis in order to facilitate interpretation of the results, and to improve critical evaluation of the results, giving a more complete picture of the systems. This approach allows the simultaneous study of the effects that several factors and their interactions may have on a process, and has also been successfully used in the formulation of semisolid products (12–14).
Therefore, the rheological behaviour of samples was tested at increasing temperatures (temperature sweep), times (time sweep) at a fixed temperature (70°C), and frequency (frequency sweep). In particular, the latter test permitted determination of the mechanical spectra of the dynamic moduli G′ and G″ vs frequency. This data made it possible to characterise, using different modelling approaches, the microrheological behaviour of the systems. In addition, the identification of the importance of the single parameter and the quantification of their influence on the specific characteristics of the studied samples is made possible by the statistical approach.
MATERIALS AND METHODS
Carbopol 974, Carbopol 971 and Silsense A-21 were obtained from Noveon Inc. (Cleveland, Ohio). Deionised water was obtained from an ion-exchange system MF3 (San Salvatore di Cogorno, Genova, Italy).
Gel Preparation
Different methods of gel preparation were used with both Carbopol C974 and C971, in order to verify if this could influence the rheological characteristics of the gel. In the first preparation method, the selected amount of Carbopol was dispersed in a 50:50 water/Silsense™ A-21 mixture at 25°C. The dispersion was homogenised using an Ultraturrax T25 for 5 min at 12500 rpm, degassed under vacuum and then left at rest for one day before being analysed. In the second preparation method, after a complete dispersion with Ultraturrax T25 at the same conditions described above, the sample was then heated at 70°C (10,11) and the system was stirred mechanically until a homogeneous and transparent dispersion was formed (60 min.). In order to complete the statistical analysis, samples were also prepared at the temperature of 47.5°C to allow the development of a more extensive experimental design. Carbopol concentration in all systems ranged between 0.5 and 4% w/v.
Rheological Characterization
Rheological analyses were performed in triplicate using a stress control rheometer (Stress-Tech, Reologica) equipped with a 4/40 cone-plate geometry (cone diameter was 40 mm, cone angle was 4°) operating in the oscillation mode. The gap was 150 μm. The following tests were carried out:
Oscillation stress sweep
The sample was exposed to increasing stress at a constant frequency; at 20°C, 1 Hz frequency and different ranges of stresses (0.05–10, 0.05–100, 0.05–500 Pa).
This test allows the determination of the linear viscoelastic regime (LVR) of the sample, and therefore the consequent choice of the stress value to use in the other oscillation tests;
Temperature sweep
The test was performed to determine sample behaviour at constant frequency and stress in a range of temperatures: 1 Hz frequency, 1 Pa stress, temperature range 10–70°C and heating rate 0.5°C/min were the experimental parameters. A cooling step followed the heating procedure at the same conditions in the temperature range 70–10°C;
Frequency sweep
The sample was exposed to a frequency scan at a constant stress (1 Pa); 0.05–50 Hz frequency range, in the field of linear viscoelasticity, at different temperatures between 10 and 70°C. The frequency range and the G′–G″ values were plotted in logarithmic scale. In order to better understand the influence of temperature on the rheological properties and microstructure of the tested systems, different parameters were calculated by fitting the experimental data with specific models. By applying a linear fitting, slope values of log G′ and log G″ vs log frequency were calculated in order to investigate the frequency dependence of dynamic moduli (15). Afterwards, the study of the power law dependence of both mechanical moduli was performed. It is known that at the gel point, chemical cross-linked systems are characterised by a scaling relation between dynamic moduli and frequency (G′(ω)~G″(ω)~ωn) and G′ and G″ curves become parallel to each other (16,17). Finally, IRIS software (version 8.0) was used to build master curves from the frequency spectra performed at different temperatures using the time-temperature superposition principle and selecting 20°C as reference temperature. The master files after the time-temperature superposition were expressed as discrete relaxation time spectrum where the relaxation modulus was obtained as a sum of N Maxwell modes:
 |
where gi is the relaxation strength,  is the relaxation time and Ge is the equilibrium modulus, which was finite for a viscoelastic solids and zero for viscoelastic liquids. Thus the relaxation-time spectrum may be written as a continuous function or as a sum of discrete terms, each of them having a characteristics time constant
  .
.
The time dependent part of the relaxation modulus is the Laplace transformation of the relaxation time spectrum H(λ) defined by the following equation:
 |
The relaxation spectrum cannot be measured directly in an experiment and for this reason dynamic mechanical data such as G′ and G″ moduli are converted from the frequency domain to the time domain (18). A method was developed (18) for the representation of the relaxation spectrum with the fewest possible Maxwell-modes, since the discrete relaxation times should be freely adjustable and should converge to values that are characteristic for the material. This representation is called the “parsimonious” model (PM-spectrum). According to this model, it is possible to optimise the number of modes N and to convert the regression algorithm identifying the calculated spectra as PM-spectra having PM-modes and PM-standard deviations (19).
Time sweep
The test was performed to see the changes in the samples with time at constant temperature (70°C), stress (1 Pa) and frequency (1 Hz). Time ranged from 0–90 min.
Experimental Design
Analysis of the rheological behaviour of the Silsense™/Carbopol systems using an experimental design procedure was performed in two different steps: screening and optimisation.
The aim of the screening stage was to determine the influence of four factors (polymer concentration and type, preparation method, and temperature of the tests) on the viscoelastic parameters G′ and G″ obtained from the frequency sweep analysis of the different systems. For the screening a 24 full factorial design was applied, with the four parameters settled at two levels each. The values of the two levels were expressed using coded variables (20), where –1 represents the level of the lower value and +1 the level of the higher value (for the qualitative factors like the polymer type, the coded variables were assigned arbitrarily) as shown in Table I. The complete scheme of the performed tests is reported in Table II.
Table I.
The Values for the Upper and Lower Levels of the Variables used in the Experimental Design
| Polymer type | Prep. Temperature | Polymer concentration | Tests temperature | ||||
|---|---|---|---|---|---|---|---|
| Carbopol C974 | Carbopol C971 | 25°C | 70°C | 1% w/v | 4% w/v | 20°C | 50°C |
| −1 | +1 | −1 | +1 | −1 | +1 | −1 | +1 |
Table II.
Experimental Plan and Obtained G′, G″ Values for the Factorial Design
| Sample | Carbopol type | Preparation temperature (°C) | Polymer concentration (% w/v) | Test temperature (°C) | G′ (Pa) | G″ (Pa) |
|---|---|---|---|---|---|---|
| 1 | −1 | −1 | −1 | −1 | 0.50 | 3.30 |
| 2 | +1 | −1 | −1 | −1 | 45.9 | 42.6 |
| 3 | −1 | +1 | −1 | −1 | 9.80 | 10.5 |
| 4 | +1 | +1 | −1 | −1 | 4.70 | 12.8 |
| 5 | −1 | −1 | +1 | −1 | 933 | 289 |
| 6 | +1 | −1 | +1 | −1 | 197 | 139 |
| 7 | −1 | +1 | +1 | −1 | 7,590 | 1,690 |
| 8 | +1 | +1 | +1 | −1 | 8,680 | 1,010 |
| 9 | −1 | −1 | −1 | +1 | 3.80 | 4.90 |
| 10 | +1 | −1 | −1 | +1 | 18.6 | 20.2 |
| 11 | −1 | +1 | −1 | +1 | 45.1 | 18.6 |
| 12 | +1 | +1 | −1 | +1 | 16.8 | 18 |
| 13 | −1 | −1 | +1 | +1 | 1,060 | 266 |
| 14 | +1 | −1 | +1 | +1 | 119 | 87 |
| 15 | −1 | +1 | +1 | +1 | 8,960 | 1,370 |
| 16 | +1 | +1 | +1 | +1 | 25,600 | 41,80 |
Experimental results were evaluated and fitted with a polynomial model (using multiple-linear regression), which in this case was a linear third order interaction model (fourth order interaction were considered negligible):
 |
1 |
Where xi are the coded variables, bi are the coefficients corresponding to the variables xi (which are the response of the pure component i), bij are the coefficients associated with the interaction effects of the variables xi and xj, while bijz are the coefficients of the third order interaction effects of the variables xi, xj, xz and b0 is the model constant while y is the response. Analysis of variance (ANOVA) was performed to determine the significance of the equation terms, and Pareto charts (21) were used to show the results.
A screening stage can only give an indication about the influence of the different factors and their interactions. An optimisation stage is necessary for a better understanding of the system, as it allows the construction of a more realistic model. For this stage, a response surface methodology (RSM) was chosen, which was built from data of the factorial design (using only tests related to factors that proved important) and adding central points and star (axial) points (20–22). The results were processed by a multiple linear regression on the basis of a full quadratic model (Eq. 2), which was considered in order to evaluate a possible curvature of the response surface.
 |
2 |
ANOVA tests were performed both to determine the significance of the regression and to calculate the significance of the single contribution: linear, interaction and square. Results were presented using 3-D surface plots. The analysis of the results was performed with the statistical program MINITAB ® Release 14.1 (Minitab Inc., 1972–2003).
RESULTS AND DISCUSSION
Rheological Characteristics
Non-destructive oscillatory measurements performed in this study made it possible to obtain rheological main parameters such as the storage or elastic modulus (G′) and the loss or viscous modulus (G″). The elastic or storage modulus represents the elastic storage of energy and is a measure of how well-structured a material is. The loss or viscous modulus represents the viscous energy dissipation and becomes large when the sample is highly viscous (4). These parameters were monitored as a function of frequency, time, and temperature, indicating the thickening properties of Carbopol in 50:50 Silsense™ A-21/water mixture chosen as medium.
Both types of Carbopol showed the same behaviour in the water/Silsense systems. The only difference was the higher values of the elastic moduli in presence of C974 instead of C971 at the same polymer concentration. This is in agreement with the fact that C974 is a highly cross-linked polymer compared to C971 (3). For this reason, only the rheological results concerning C974 are presented in the figures. The graphical data was reported as the mean of the triplicates, but standard deviation bars were omitted to avoid overlapping, since the SD values were extremely low.
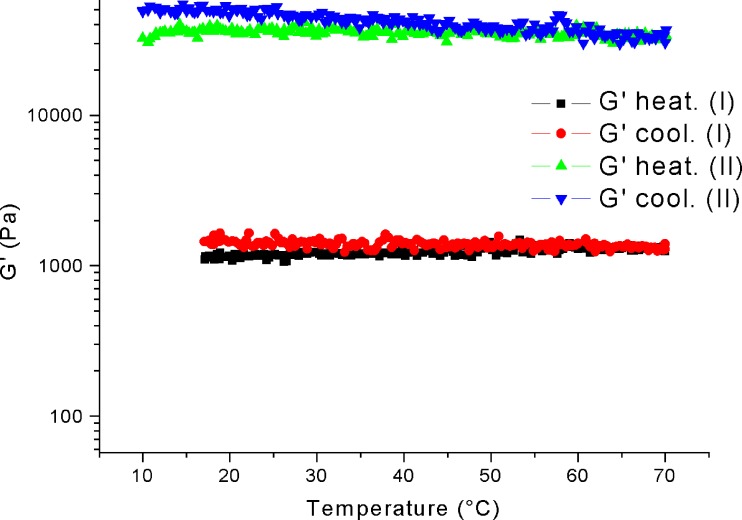
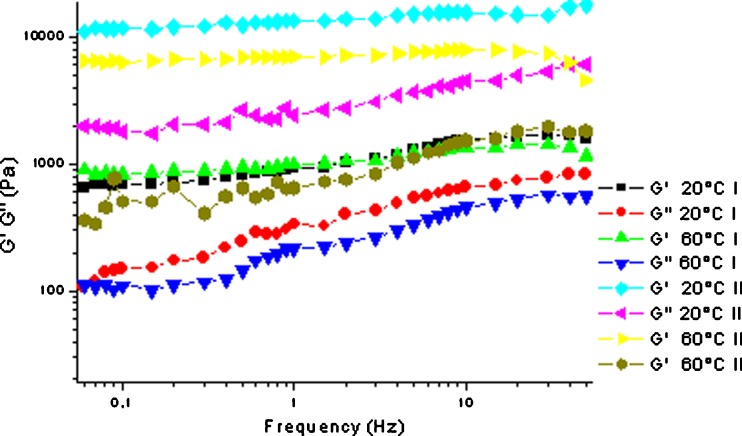
The temperature sweep tests did not show a significant increase in the elastic character of the samples during the heating step, independently of the preparation method (Fig. 1). In addition, the value of the elastic modulus at the beginning of the heating step is clearly higher for the samples prepared at 70°C. The frequency sweep results outlined a change in the mechanical spectra of the systems prepared by heating, compared to that of the corresponding samples obtained at room temperature (Fig. 2). As observed from the temperature sweep, when the system prepared at room temperature was tested at increasing temperatures there was practically no difference within the different spectra. On the contrary, from the analysis of the samples obtained with the heating procedure at 70°C, it was evident that the preparation method strongly influenced the system’s elastic character with definitely greater values, in particular for the G’ modulus, and a definitely lower frequency dependence.
Fig. 1.
Temperature sweep of C974 samples obtained at room temperature (I) and at 70°C (II)
Fig. 2.
Frequency sweep at 20 and 60°C of Carbopol 974 4% samples prepared at room temperature (I) and at 70°C (II). SD bars were omitted to avoid overlapping
Next, the influence of the preparation time on the rheological characteristics of samples has been analysed by performing a time sweep test. At all concentration systems, the data did not exhibit any significant modification in the rheological parameters when tested at 70°C for 90 min of time, even though during the preparation step the samples were left at that temperature for only 60 min (data not shown). Surely, the intense stirring performed during the preparation step also plays an important role together with the temperature used.
Data of the frequency sweep tests were then used to better examine the system’s structural characteristics. The analysis of the slope values of the log G′–log G″ vs log frequency plots of the different curves confirmed the behaviour mentioned above. For example, with the samples prepared at room temperature, slope values of log G′ and log G″ vs log frequency of the 4% w/v system confirmed that both viscous and elastic moduli were slightly dependent on frequency at 20°C and, as expected, when the test was performed at 60°C, the slope remained quite similar for both moduli (Table III).
Table III.
Values of Slopes and n Exponents Calculated from the Fitting of the G′–G″ vs Frequency Curves of the Systems Prepared at Room Temperature (I) and at 70°C (II)
| Parameter | T. test (°C) | C974 I | C974 II | |
|---|---|---|---|---|
| Slopes | G′ | 20 | 0.165 | 0.070 |
| 60 | 0.101 | 0.040 | ||
| G″ | 20 | 0.336 | 0.180 | |
| 60 | 0.308 | 0.299 | ||
| n | n 1 | 20 | 0.185 | 0.068 |
| 60 | 0.102 | 0.044 | ||
| n 2 | 20 | 0.321 | 0.197 | |
| 60 | 0.330 | 0.334 | ||
This type of spectrum is a pattern typical of a weak gel (15), with rheological behaviour at an intermediate point between that of a solution and that of a strong gel: a weak gel is characterised by a progressive breakdown of the three dimensional network as deformation increases.
In addition, as already stated, cross-linked systems possess a dynamic mechanical behaviour at gel point usually characterised by a scaling relation between dynamic moduli and frequency (G′(ω)~ G″(ω)~ωn) i.e. a power law dependence is observed. On the contrary, in our case, all the systems had different n values for G′ and G″, in agreement with the assertion that the samples’ behaviour is typical of a weak gel and that a real gel point is not present. However, n values calculated from the fitting of the elastic modulus are generally lower than the corresponding n related to the viscous modulus (Table III), showing a lower frequency dependence for the G′ modulus, confirming the presence of an important elastic component.
The slope analysis of the curves obtained when samples were prepared at 70°C showed a trend similar to that observed for the corresponding samples prepared at room temperature, even though the results obtained for G′ indicated a definitely lower dependence on frequency. Therefore, despite the lesser frequency dependence, compared to the corresponding samples obtained at room temperature (in particular for the elastic modulus), the general behaviour is not typical of a cross-linked structure. The increasing elasticity is not due to the formation of a stable three-dimensional network, but to a topological entangled system characterised by a transient elastic character.
Once again, the systems studied cannot be considered “gels” from a rheological point of view. As observed for the samples prepared at room temperature, the above results were confirmed by the analysis of the power law dependence of dynamic moduli vs frequency. Even if n exponents indicated an increased elasticity and a lower dependence on frequency, in particular for G′ modulus, values are similar even though they remain slightly different for the two moduli. Therefore, on the basis of their mechanical spectra they can be considered as weak gels, despite the heat treatment during the preparation step and the general increase in sample elastic character associated with this preparation procedure.
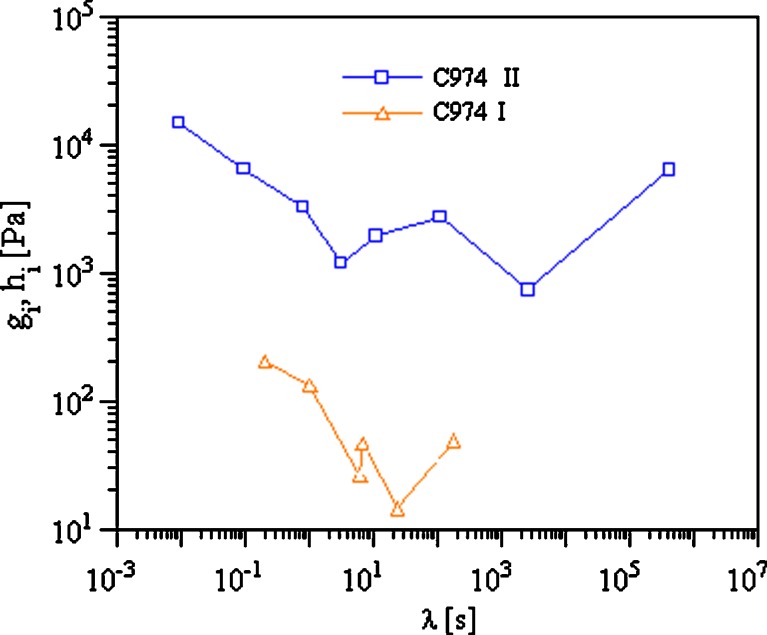
The analysis of the discrete relaxation spectra performed on the master curve of the 4% (w/v) samples provided additional information on the structural differences within the systems prepared at room temperature and those prepared by the heating procedure. As can be observed in Table IV, the values of the zero shear viscosity for the sample obtained at 70°C are six and four orders of magnitude higher respectively for C974 and C971 than the corresponding values of the samples prepared at room temperature. In the same way, the heating procedure influenced two other important parameters, namely, the plateau modulus, in particular when the thickening polymer was C974, and the characteristic relaxation times. All these changes in sample characteristics, due to the heating of the system itself, depend on stronger polymer/solvent interactions (i.e. a better solvation), which considerably improve the thickening properties of Carbopol. These better polymer/solvent interactions proportionally slow down polymer chain relaxation after these weak gels have been stressed. In fact, the discrete relaxation spectrum of the C974 system prepared by heating is shifted towards higher gi values and the range of relaxation times is broader (Fig. 3).
Table IV.
Rheological Parameters from the Calculation of the Discrete Relaxation Spectra of the Systems prepared at Room Temperature (I) and at 70°C (II)
| Sample | Zero-shear viscosity | Plateau modulus | Characteristic relaxation time |
|---|---|---|---|
| C974 I | 9.72 × 10³ | 4.70 × 10² | 1.59 × 10² |
| C974 II | 2.69 × 10⁹ | 3.73 × 10⁴ | 4.26 × 10⁵ |
| C971 I | 9.72 × 10³ | 7.93 × 10² | 1.59 × 10² |
| C971 II | 8.70 × 10⁷ | 3.78 × 10⁴ | 2.31 × 10⁴ |
Fig. 3.
Discrete relaxation times spectra of C974 systems obtained at room temperature (I) and by the heating procedure (II)
Furthermore, from the analysis of the results (Table IV) on the relaxation time values, it appeared that C974 was more highly structured than C971.
So, from the rheological analyses it is possible to conclude that at a microstructural level, heating and stirring seemed to promote the polymer–solvent interactions, aiding the solvation of Carbopol. The effect is quite similar to that obtained by the neutralization procedure, though in this case, the unrolling of the polymeric chains was probably incomplete, giving rise to a less structured sample.
Finally, this preparation method provides good stability properties. G′ and G″ curves of Silsense A21/water/Carbopol systems, obtained from the stress sweep tests carried out during three months of storage, showed no significant variation in comparison with those of the corresponding samples analysed after 24 h from the preparation (data not shown). At the same time no precipitation phenomena were observed during the same period.
Factor Screening and Design
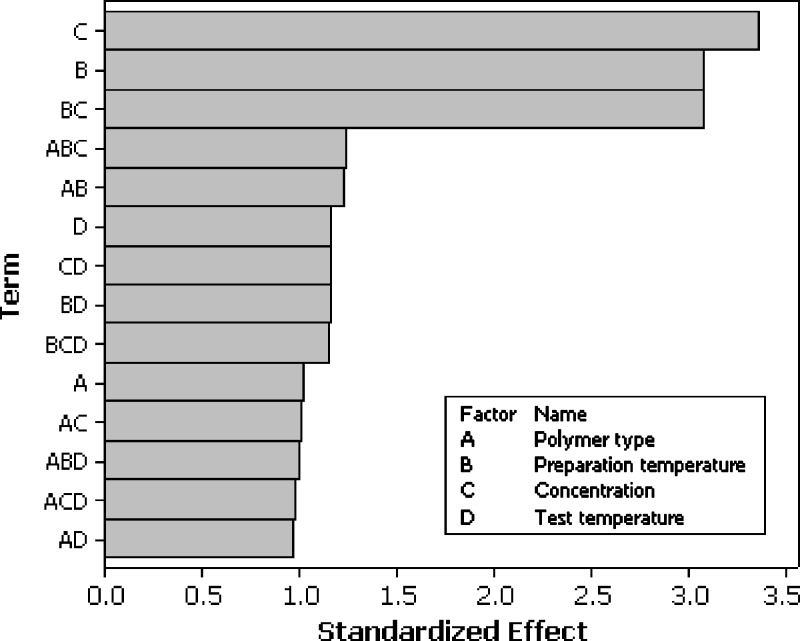
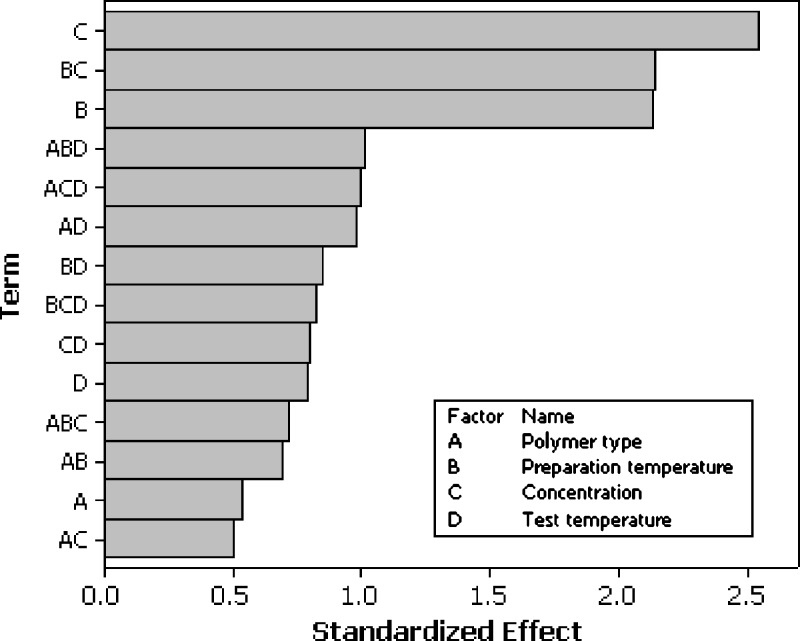
A statistical approach was used to define the influence of some main parameters in the characteristics of the final product. Thus, mean values of G′ and G″ moduli calculated at the frequency of 1 Hz were utilised to build both the screening step and the RSM design. The first step of the statistical approach was screening, which allowed selection of the factors influencing the rheological behaviour of the studied systems. From the Pareto charts (Figs. 4 and 5) it is possible to observe that all the factors had a certain influence on the final behaviour of the systems, but three of them affected it strongly: polymer concentration, preparation method, and the interaction between these two effects. Therefore, these last three factors were further investigated by applying a RSM design to one temperature among those used to perform the frequency sweep test (20°C) only on Carbopol C974 (Table V). We need to point out that, the star points were not set to the values usually adopted for this kind of design (a value of α = 1.414; 23) because the individual limits of the polymer concentrations made it very difficult to bring them above a 4% (w/v) concentration, with problems in both preparation and analysis. For this reason, a cubic shape domain was chosen, with an α value equal to 1 (face centred design). The resulting design, with all points on the surface of the cube, is of excellent quality despite the fact that rotability is practically neglected (20).
Fig. 4.
The effects of the different factors on the values of G′ modulus represented with a Pareto chart (r 2 = 97.77)
Fig. 5.
The effects of the different factors on the values of G″ modulus represented with a Pareto chart (r 2 = 95.79)
Table V.
Experimental Plan and Obtained G′, G″ Values for the RSM Design
| Sample | Points in the RSM design | Preparation temperature (°C) | Polymer concentration (% w/v) | G′ (Pa) | G″ (Pa) |
|---|---|---|---|---|---|
| 1 | Factorial points | −1 | −1 | 0.50 | 3.30 |
| 2 | +1 | −1 | 9.80 | 10.5 | |
| 3 | −1 | +1 | 933 | 289 | |
| 4 | +1 | +1 | 7,590 | 1,690 | |
| 5 | Star points | −1 | 0 | 887 | 274 |
| 6 | +1 | 0 | 893 | 304 | |
| 7 | 0 | −1 | 78.4 | 61.4 | |
| 8 | 0 | +1 | 1,570 | 358 | |
| 9 | Central points | 0 | 0 | 966 | 295 |
| 10 | 0 | 0 | 913 | 306 | |
| 11 | 0 | 0 | 873 | 267 | |
| 12 | 0 | 0 | 919 | 278 | |
| 13 | 0 | 0 | 871 | 247 |
0 is the code variable and is equal to 47.5°C (preparation temperature) and to 2.5% (w/v) concentration.
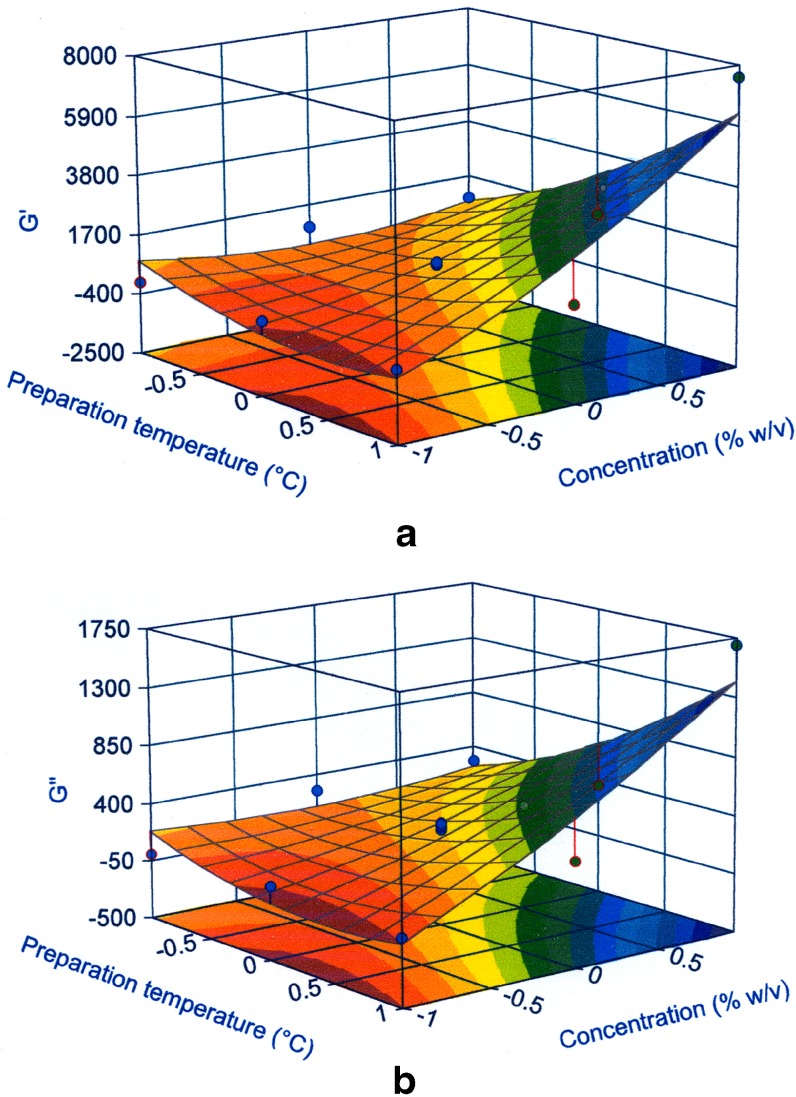
The experimental results were then analysed using a full quadratic model (Eq. 2). ANOVA indicated that only the linear and the interaction terms of the equation were statistically significant at p < 0.05. The non significant terms however were not eliminated from the equation because they were necessary to describe the effects (r2 values did not increase in any case; 24). The predictive equations for the G′ and G″ moduli are reported above and are represented by the surface response shown in Fig. 6.
 |
3 |
 |
4 |
where PT is the preparation temperature and C the polymer concentration.
Fig. 6.
Graphical representation of G′ a and G” b moduli vs preparation temperature and concentration in a 3-D surface plot. The circle represents the experimental results
From Eq. 3 and 4, or from Fig. 6, it is possible to assert that the main term is the polymer concentration, consistent with the result previously obtained with the factorial design. This factor as a single term increased the G′ modulus by a factor equal to 1.67 kPa Pa and G″ modulus by 0.38 kPa when the concentration rose above 2.5% (w/v). The most interesting aspect is the influence of the interaction between the polymer concentration and the preparation temperature. The greatest increase in the moduli values occurred when both factors increased, particularly when the temperature was higher than 47.5°C and the concentration was greater than 2.5% (w/v).
As already stated, Carbopol is a well-known thickening polymer, and this property is obviously dependent on its concentration. An elevated polymer concentration may lead to a slower and more complex process of solvation. The fact that the preparation temperature bore stronger influence at greater polymer content means that its impact on solvation was more evident for concentrations higher than 2%, in agreement with rheological analyses. High preparation temperature probably helped the polymer–polymer and particularly the polymer–solvent interactions, giving rise to a better organised structure typical of gel-like systems. While this effect of preparation temperature is valid under all conditions (and is confirmed as a statistically significant term in the model), its influence is particularly important when the Carbopol concentration is high when the solvation phenomena is rather slow. This is confirmed by the fact that when the preparation temperature was low (room temperature), the increase in polymer concentration did not influence the values of the dynamic moduli. The same consideration can be made when the Carbopol amount was up to 1–1.5%, since in this case the temperature did not affect the systems’ rheological behaviour.
CONCLUSION
The aim of this paper was to characterise the thickening properties of Carbopol in a mixture of Silsense™ A-21/water 50:50 as model solvent. The rheological analysis indicated, in general, a certain thickening ability of these kinds of polymers, which was particularly evident when samples were prepared at 70°C and when the polymer concentration was higher than 2% (w/v).
Different modelling of the frequency sweep curves allowed the characterization of the structural properties of the analysed systems and demonstrated the importance of the preparation method. In fact, systems prepared at 70°C showed a progressively lower dependence on frequency and confirmed a remarkable increase in system elasticity, which gave rise to stronger gel-like behaviour. The G′ modulus in particular was independent of the applied frequency, while the G″ modulus indicated a slight dependence: this type of spectrum is usually associated with a weak-gel behaviour. In fact, the analyses showed no real and considerable variation of the persistence of the elastic properties, which means they were not associated with the formation of a true and stable three-dimensional network. Thus, despite the consistent increase due to the preparation temperature, the structure remained that of a weak gel, allowing us to suggest that the polymer–solvent interactions were more important than those of polymer–polymer, thus causing a lack of a real network even after heat treatment.
Consistent with the rheological analysis and in particular with the frequency sweep tests and the relaxation time spectra, our statistical approach showed the high importance of the polymer concentration and also a significant influence of the preparation procedure. Furthermore, this study pointed out the relevance of the interaction between these two factors. This interaction appeared to be related to the rate of polymer solvation, which was obviously slower at higher polymer concentration when samples were prepared at room temperature. Hence, a temperature increase during the preparation step facilitated polymer–solvent interaction and was particularly effective when Carbopol was present in considerable amounts. Temperature therefore was an important factor when involved in the preparation method rather than as an analytical parameter.
References
- 1.Noveon Silsense bulletins (http://www.pharma.noveoninc.com/products).
- 2.Wade A., Weller P. Handbook of Pharmaceutical Excipients, Second Edition. American Pharmaceutical Association. London: The Pharmaceutical Press; 1994. pp. 71–73. [Google Scholar]
- 3.Noveon bulletins (http://www.pharma.noveoninc.com/products).
- 4.Tamburic S., Craig D. Q. M. Rheological evaluation of polyacrylic acid hydrogels. J Pharm Sci. 1995;1:107–109. [Google Scholar]
- 5.Tamburic S., Craig D. Q. M. An investigation into the rheological, dielectric and mucoadhesive properties of poly(acrylic acid) J Controlled Rel. 1995;37:59–68. doi: 10.1016/0168-3659(95)00064-F. [DOI] [PubMed] [Google Scholar]
- 6.Blanco-Fuente H., Anguiamo-Igea S., Otero-Espinar F. J., Blanco-Méndez J. In-vitro bioadhesion of carbopol hydrogels. Int J Pharm. 1996;142:169–174. doi: 10.1016/0378-5173(96)04665-0. [DOI] [Google Scholar]
- 7.Riley R. G., Smart J. D., Tsibouklis J., Dettmar P. W., Hampson F., Davis J. A., Kelly G., Wilber W. R. An investigation of mucus/polymer rheological synergism using synthesised and characterised poly(acrylic acid)s. Int J Pharm. 2001;217:87–100. doi: 10.1016/S0378-5173(01)00592-0. [DOI] [PubMed] [Google Scholar]
- 8.Chu S., Amidon G. L., Weiner N. D., Goldberg A. H. Mixture experimental design in the development of mucoadhesive gel formulation. Pharm Res. 1991;8:1401–1407. doi: 10.1023/A:1015853223929. [DOI] [PubMed] [Google Scholar]
- 9.Chu S., Yu D. M., Amidon G. L., Weiner N. D., Goldberg A. H. Viscoelastic properties of polyacrilic acid gels in mixed solvents. Pharm Res. 1992;9:1659–1663. doi: 10.1023/A:1015841214591. [DOI] [PubMed] [Google Scholar]
- 10.Bonacucina G., Martelli S., Palmieri G. F. Rheological, mucoadhesive and release properties of Carbopol gels in hydrophilic cosolvents. Int J Pharm. 2004;282:115–130. doi: 10.1016/j.ijpharm.2004.06.012. [DOI] [PubMed] [Google Scholar]
- 11.Bonacucina G., Cespi M., Misici-Falzi M., Palmieri G. F. Rheological, adhesive and release characterisation of semisolid Carbopol/Tetraglycol systems. Int J Pharm. 2006;307:129–140. doi: 10.1016/j.ijpharm.2005.09.034. [DOI] [PubMed] [Google Scholar]
- 12.Contreras M. D., Sánchez R. Application of a factorial design to the study of specific parameters of a Carbopol ETD 2020 gel. Part I. Viscoelastic parameters. Int J Pharm. 2002;234:139–147. doi: 10.1016/S0378-5173(01)00953-X. [DOI] [PubMed] [Google Scholar]
- 13.Contreras M. D., Sánchez R. Application of a factorial design to the study of the flow behaviour, spreadability and transparency of a Carbopol ETD 2020 gel. Part II. Int J Pharm. 2002;234:149–57. doi: 10.1016/S0378-5173(01)00954-1. [DOI] [PubMed] [Google Scholar]
- 14.Cafaggi S., Leardi R., Parodi B., Caviglioli G., Bignardi G. An example of application of a mixture design with constraints to a pharmaceutical formulation. Chemometr Intell Lab. 2003;65:139–147. doi: 10.1016/S0169-7439(02)00045-X. [DOI] [Google Scholar]
- 15.Rosalina I., Bhattacharya M. Dynamic rheological measurements and analysis of starch gels. Carbohydr Polym. 2002;48:191–202. doi: 10.1016/S0144-8617(01)00235-1. [DOI] [Google Scholar]
- 16.Goodwin J. W., Hughes R. W. Rheology for chemists. Cambridge: The Royal Society of Chemistry; 2000. [Google Scholar]
- 17.Desbrières J. Autoassociative natural polymer derivatives: the alkylchitosans. Rheological behaviour and temperature stability. Polymer. 2004;45:3285–3295. doi: 10.1016/j.polymer.2004.03.032. [DOI] [Google Scholar]
- 18.Baumgaertel M., Winter H. H. Determination of discrete relaxation and retardation time spectra from dynamic mechanical data. Rheologica Acta. 1989;20:511–519. doi: 10.1007/BF01332922. [DOI] [Google Scholar]
- 19.Baumgaertel M., Winter H. H. Interrelations between continuous and discrete relaxation spectra. J Non-Newtonian Fluid Mech. 1992;44:15–36. doi: 10.1016/0377-0257(92)80043-W. [DOI] [Google Scholar]
- 20.G. A. Lewis, D. Mathieu, and R. Phan-Tan-Luu. Pharmaceutical experimental design. Drugs Pharm. Sci. 92, Marcel Dekker Inc, 1999.
- 21.N. Draper, and H. Smith. Applied regression analysis. Wiley-Interscience, 1981.
- 22.Lundstedt T., Seifert E., Abramo L., Thelin B., Nyström Å., Pettersen J., Bergman R. Experimental design and optimization. Chemometr Intell Lab. 1998;42:3–40. doi: 10.1016/S0169-7439(98)00065-3. [DOI] [Google Scholar]
- 23.G. E. P. Box, and K. B. Wilson. On the experimental attainment of optimum condition. J. Roy Statist. Soc. Ser. B:1–45 (1951).
- 24.Bolton S. Factorial design, in: Swarbrick, J. (Ed.), Pharmaceutical statistics. Practical and clinical application. Drugs and the pharmaceutical sciences, Vol. 44, Marcel Dekker, 1990.


