

Abstract
The high levels of oxidative stress (OS) and inflammation associated with cardiovascular disease are linked to pro-oxidants such as advanced glycation end products (AGEs). AGEs interact with multiple receptors, including receptor 1 (AGER1), which promotes AGE removal and blocks OS and inflammation, and RAGE, which enhances inflammation. In this study, we evaluated metabolic and vascular changes in AGER1 transgenic mice (AGER1-tg) subjected to an atherogenic diet and arterial wire-injury. Both baseline and postatherogenic diet serum and tissue AGEs as well as plasma 8-isoprostane levels were lower in AGER1-tg mice than in wild-type mice. The levels of injected 125I-AGE in tissues were decreased as well in AGER1-tg mice. After ingesting a high-fat diet, AGER1-tg mice had a normal glucose tolerance and only 7% were hyperglycemic, whereas 53% of wild-type mice had stable hyperglycemia. After wire-injury, intimal lesions in AGER1-tg mice were small, whereas wild-type mice had diffuse intimal hyperplasia, a high intima/media ratio, and inflammatory cell infiltrates. In addition, AGER1 staining, prominent in AGER1-tg mice, was attenuated in 30 to 40% of wild-type cells, although all cells were strongly positive for AGEs. Thus, AGER1 overexpression in mice reduces basal levels of AGEs and OS, enhances resistance to diet-induced hyperglycemia and OS, and protects against injury-induced arterial intimal hyperplasia and inflammation, providing protection against OS and inflammation induced by AGEs and high-fat diets in vivo.
Atherosclerosis, one of the principal underlying lesions in cardiovascular disease (CVD), is a multistep process in which high oxidative stress (OS) and inflammation play a crucial role.1,2,3 OS may play a role in vascular progenitor function and contributes to alterations in vascular injury repair and insulin resistance.4,5 A characteristic feature of OS is an imbalance between reactive oxygen species (ROS) generation and antioxidant status. While ROS are necessarily generated during normal metabolism, abnormally increased levels may arise from excess metabolites, ie, glucose or fatty acids, but also from exogenous oxidants consumed with the diet.3,6,7 Advanced glycation end products (AGEs), known contributors to CVD and chronic kidney disease, are derived either from metabolism or from the diet.6,8,9,10
AGEs, resulting from nonenzymatic additions of reducing sugars to Lys or Arg of proteins (AGEs), lipids (advanced lipoxidation end products) and nucleic acids, can generate increased levels of intracellular ROS, further promoting AGE formation in a “vicious cycle.”6,8,9,11
Abnormal accrual of AGEs, previously thought to be restricted to diabetes, is now known to occur in persons considered to be in good health.12 A role for AGE-enriched Western diets in the causation of increased systemic AGE, OS, and CVD, first studied in animals, has been documented in clinical studies that include subjects with diabetes and/or kidney disease.8,11,13,14,15 This association is also present in healthy individuals.11,13
Several cell surface AGE receptors have been identified, each of which mediates different responses. Among these, AGE receptor 1 (AGER1) promotes the uptake and removal of AGEs and blocks cellular AGE-mediated ROS generation and inflammation,16,17,18 whereas receptor for AGEs (RAGE) promotes ROS generation and inflammatory responses.19,20 Because AGER1 and RAGE compete for AGEs, the binding of AGEs to RAGE may increase when AGER1 levels are decreased, resulting in the induction of increased OS. In this instance RAGE signaling is unopposed by AGER1.17,18
AGER1 is a type I transmembrane receptor found on the plasma membrane16 and in the endoplasmic reticulum.21 The cell surface membrane-associated AGER1 blocks responses to AGEs by blocking the induction of ROS-mediated activation of mitogen-activated protein kinases/Ras and inflammatory molecules, induced in part via RAGE.17 In addition, AGER1 suppresses AGE-induced ROS by inhibiting phosphorylation of epidermal growth factor receptors, Grb-2/Shc and extracellular signal-regulated kinases.18 Downstream actions of AGER1 include the inhibition of ser-36 phosphorylation of p66shc,22 a highly OS-responsive isoform of Shc, involved in the AGE-mediated inactivation of forkhead box transcription factors and manganese superoxide dismutase suppression in vitro, as well as in vascular disease and lifespan in vivo.23,24,25 Suppression of these pathways by AGER1 is thought to support intracellular anti-oxidant systems, to enhance tissue resistance to ROS, and to prolong lifespan.18
Circulating monocyte AGER1 levels correlate strongly with systemic AGEs and OS, independent of age in healthy adults.13 However, AGER1 was found to be down-regulated in states of chronic high OS, such as diabetes and kidney disease.26,27 The reasons for this paradoxical decrease are unknown. However, studies in mice and humans suggest that dietary AGEs may be involved, because dietary restriction of AGE intake preserves AGER1 expression, reduces circulating AGEs and OS levels, and decreases age-related metabolic, vascular, and renal changes in aging mice.28,29 This is also associated with an extended lifespan in mice. These data complement clinical studies in which reduced dietary AGE intake normalized abnormally low AGER1 levels and reduced OS and inflammation in patients with high AGEs and OS due to chronic kidney disease.13 The findings underscore the potential significance of AGER1 expression levels and the critical role it may play in maintaining systemic anti-oxidant balance. However, this evidence is inferential, and direct in vivo links between AGER1 expression, AGE levels, and OS have not been established.
The present studies, using mice transgenic for murine AGER1, show that the overexpression of AGER1 in mice is associated with (a) decreased basal levels of circulating and tissue AGEs and OS, (b) decreased serum AGE levels and enhanced anti-oxidant reserves after exposure to a high-fat diet, as evidenced by resistance to hyperglycemia, and (c) significant protection against wire injury-induced femoral artery intimal hyperplasia and inflammation.
Materials and Methods
Generation of AGER1 Transgenic Mice
Full-length murine AGER1 cDNA was generated by PCR by using mouse embryonic stem cells with the following primers: forward, 5′-GAAGCTTGCTGCTGGGAGATGAAGATGGAT-3′, and reverse, 5′-CTCTAGACGGTCAGACTTCTCCTTCTCCTTCATG-3′. PCR products were purified, subcloned into a pcDNA3.1 vector (Invitrogen; Carlsbad, CA) and confirmed by sequence analysis. A CMV promoter was used. Because we introduced murine AGER1 cDNA into mouse ova, a V5-tag was included in the 3′-end of construct for the purpose of identifying the transgene (Figure 1A). The resultant 2.236kb hybrid gene was linearized with SalI and SphI sites between the CMV promoter and the bGH polyA sequence and microinjected into fertilized eggs. The founder transgenic mice were identified by PCR of DNA isolated from tail snips with a 5′ primer of AGER1 (5′-TTGTCCGCATTGATCCTTTTGT-3′) and a 3′ primer of V5-tag (5′-AGAGGGTTAGGGATAGGCTTAC-3′). Nine out of 43 newborn offspring carried the murine AGER1-V5 tag cDNA. Founder mice expressing high levels of AGER1 were used for propagation. AGER1 mice were born in the expected Mendelian ratio and have not shown a survival advantage or disadvantage during more than 3 years of study. F1–4 mice had normal fecundity, litter size, and birth weight. Transgenic mice were backcrossed with C57B6 mice for more than six generations, having free access to water and a regular chow diet (5% fat/g, PicoLab Rodent Diet 20, #5053, Purina Mills; St. Louis, MO). To evaluate the anti-AGE and anti-OS properties of AGER1 during sustained OS burden, AGER1 transgenic (AGER1-tg; 12 months, n = 8 male and n = 9 female) and age- and sex-matched C57B6 mice were placed on a high-fat diet (21.2% fat/g, TD.88137, Harlan Teklad; Madison, WI) (Table 1), which is shown to raise AGEs and OS in addition to lipids or glucose,30 for 8 weeks.
Figure 1.

A: Schematic representation of the AGER1 construct. B: Relative AGER1 mRNA levels in various tissues. Real time-PCR data are expressed as the mean ± SEM gene copies in AGER1-tg above those in wild-type (WT) mice.
Table 1.
Characteristics of Dietary Formulas
| Regular diet | High-fat diet | |
|---|---|---|
| Protein, % by weight, g | 20 | 17.3 |
| Fat, % by weight, g | 4.5 | 21.2 |
| Carbohydrate, % by weight, g | 54.8 | 48.5 |
| Total calories/day, kcal | 4.02 | 4.5 |
| Lipid-CML, U/g | 225 | 2.7 × 10⁴ |
| Lipid-MG, nmol/g | 5.9 | 21.2 |
PCR and Real-Time PCR
Total RNA was extracted from tissues and purified with the SV Total RNA Isolation System (Promega; Madison, WI) according to the manufacturer’s instructions. One μg of total RNA was reverse transcribed by using the Transcriptor First Strand cDNA Synthesis Kit (Roche; Indianapolis, IN). PCR was performed with the genotyping AGER1 primers or primers internal to the AGER1 gene (forward 5′-CTGCTGAAGGCCCCAACCATC-3′, reverse 5′-GCGGGAGAGGGCCACAGCTAGTTC-3′), by using the TaqPCR Master Mix Kit (Qiagen; Valencia, CA) under the following conditions: initial denaturation 94°C × 3′; denaturation 94°C × 45′, annealing 55°C × 45′, elongation 72°C × 1′ for 36 cycles, and final elongation 72°C × 10′. Real-Time PCR was performed by using the Sybr Green PCR Master Mix (Applied Biosystems; Warrington, UK) under standard conditions.17,18,22
Western Analysis
Cellular or tissue samples (20 mg) were manually macerated in CelLytic MT Mammalian Tissue Lysis/Extraction Reagent (Sigma; St. Louis, MO) after the addition of a Protease Inhibitor Cocktail (Pierce; Rockford, IL), EDTA (Pierce) and Phosphatase Inhibitor (Pierce). Samples were centrifuged at 10,000 rpm for 10 minutes and supernatant was recovered. The protein concentration was measured by a colorimetric assay (DC Protein Assay, Bio-Rad; Hercules, CA) according to the manufacturer’s instruction. Fifty μg of protein for each sample was heated at 100°C with Laemmli sample buffer containing 2% β-mercaptoethanol for 5 minutes and electrophoresed on a 10% SDS-polyacrylamide electrophoresis gel. Separated proteins were transferred onto polyvinylidene fluoride membranes, which were blocked with PBS-Tween20 with 5% nonfat dry milk for 1 hour and then incubated with the primary antibody (rabbit polyclonal anti-OST48, Santa Cruz Biotechnologies, Santa Cruz, CA, dilution 1:1000; Mouse monoclonal anti-β-actin, Sigma, dilution 1:4000), followed by a 1-hour incubation with a 1:2000 dilution of the appropriate secondary antibody (goat anti-mouse IgG HRP-conjugate or Goat anti-rabbit HRP-conjugate from Bio-Rad). Bands were detected by using an enhanced chemiluminescence method (Roche).17,22
Serum and Tissue AGE
AGE concentrations in mouse sera and tissues were determined by enzyme-linked immunosorbent assay, by using monoclonal antibodies reacting with Nε-Carboxymethyl-Lysine (CML) (4G9; Alteon; Northvale, NJ) or methylglyoxal (MG)-derived AGEs (3D11).22,28,31 The CML-bovine serum albumin (BSA) standard contained 23 modified lysines/mol, whereas the MG-BSA standard contained 22 modified arginines/mol, based on high pressure liquid chromatography/gas chromatography-mass spectrometry.31
Plasma 8-isoprotane, Blood, and Tissue GSH/GSSG Levels
Blood was collected at sacrifice by cardiac puncture and endogenous lipid peroxidation products (8-isoprostanes) were determined in fresh plasma samples by using an enzyme immunoassay kit, which correlates with values determined by GC-MS (Cayman Chemical; Ann Arbor, MI). Reduced glutathione and oxidized gluthathione were analyzed with a colorimetric reaction kit (OxisResearch; Portland, OR) according to the manufacturer’s instructions.22,28
Preparation of 125I-AGE-BSA
AGE-BSA were iodinated as previously described16,17,26 by incubating AGE-BSA with 125I in the presence of IODO-Beads (Pierce) at room temperature for 1 hour.32 Samples were then passed through a Sephadex G-25 PD-10 column (GE Health Care; Piscataway, NJ), 10 1-ml fractions were collected, and the radioactivity was measured (Top Count NXT scintillation counter, Packard; Meriden, CT). Protein fractions with the highest radioactivity were extensively dialyzed against PBS with a Slide-A-Lyzer Cassette (Pierce) and precipitated with trichloroacetic acid. Samples with a specific activity ≥94% were used.
AGE Kinetics in Vivo
AGER1-tg and age- and sex-matched C57B6 mice (3 months old, n = 5/group) were anesthetized by Halothane and placed in a supine position with the lower extremities extended. After making a groin incision and exposing the femoral vein, 125I-AGE-BSA (150 μg of protein in PBS) was infused into the vein. Two hours after injection, the mice were perfused with PBS until the perfusate from the inferior vena cava was clear. Tissues were isolated and aliquots (∼20 mg) were used for total protein extraction and assessment of tissue-bound radioactivity, as described with minor modifications.16,32 Briefly, the degraded AGE-BSA (<30 kDa) was separated by using a Microcon 30 column (Amicon; Beverly, MA). The protein concentration and radioactivity were determined in each fraction (Top Count NXT scintillation counter, Packard) and normalized to the weight of the initial tissue sample.
Glucose Tolerance Test
After 2 months on a high-fat diet and after an overnight fast, mice were injected i.p. with a 20% glucose solution (2 g glucose/kg body weight). Blood samples were collected before, and at 15, 30, 60, and 120 minutes after the injection. Blood glucose levels were measured with an Elite glucometer (Bayer; Mishawaka, IN).28,30
Insulin Tolerance Test
After a 3-hour fast, mice were injected with insulin (Novolin R 100 U/ml, i.p.) at a concentration of 5 U/kg BW in sterile 0.9% NaCl solution. Blood samples were collected before, and at 15, 30, 60, and 120 minutes after the injection. The blood glucose concentration was measured with an Elite glucometer (Bayer).28,30
Femoral Artery Injury
After 4 weeks on a high-fat diet (21.2% fat/g), the selected AGER1-tg (8 males, 9 females) and age- and sex-matched C57B6 mice (n = 13) were subjected to a femoral artery injury. The injury was performed as previously described.33,34,35 In brief, mice were anesthetized with Halothane and placed in the supine position with the lower extremities extended, bilateral groin incisions were made, and the segment of femoral artery between the epigastric and saphenous arteries was separated from the vein. A left femoral artery arteriotomy was performed inferior to the epigastric branch, through which a 0.25-mm-diameter angioplasty guide wire (Advanced Cardiovascular Systems; Temecula, CA) was introduced into the lumen. The wire was advanced and pulled back three times, each time reaching beyond the aortic bifurcation. The wire was then removed, and the arteriotomy site was ligated. The contralateral artery was sham-operated, by exposing the blood vessels, and used as an uninjured control. In this model, flow is maintained through the injured segment of femoral artery, because the epigastric artery and muscular branches superior to the ligation are preserved.
Evaluation of Femoral Artery Injury Repair
Mice were sacrificed 1 month after the femoral artery injury. The hind limbs and pelvis were excised en bloc, postfixed in 4% paraformaldehyde in PBS overnight, and decalcified in 10% formic acid for an additional 12 hours. The specimens, containing the femoral vessels, were cut transversely, dividing the common femoral artery into multiple ∼5-mm segments. Specimens underwent standard dehydration, paraffin embedding, sequential sectioning, and staining by Masson’s trichrome for light microscopy and for immunohistochemistry. Sequential sections were cut from each segment. Sections at the same distance from the site of the arteriectomy were used for morphometry. Adjacent sections were used for light microscopy and immunohistochemistry. Captured images (Leica DM 5000 B microscope, digitalized with a Leica DFC 300 FX camera and the Leica Application Suite software version 2.4.0R1, Leica Microsystems; Heerbrugg, Switzerland) were evaluated with the Image Pro Plus software (version 4.5.1.29, Media Cybernetics, Bethesda, MD). The intima/media ratio was calculated as the area defined by the internal elastic lamina (IEL) of the vessel, minus the lumen area, divided by the area defined by the external elastic lamina (EEL) minus the area defined by the IEL.33,34,35 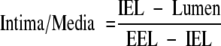 .
.
Immunohistochemistry
Paraffin sections from AGER1-tg and control mice were deparaffinized before staining for AGEs (MG-derived AGEs and CML), AGER1, macrophages (F4/80) and α-smooth muscle actin (α-SMA), as previously described.34,35,36 In brief, sections were heated for 2 hours at 58°C, soaked three times in xylene, serially passed through decreasing concentrations of alcohol, and washed three times with PBS. Antigen unmasking, when needed, was performed by heating the slides in a citrate buffer (Sodium Citrate 0.0008M, Citric Acid 0.002M, pH 6.1) for 15 minutes. Samples were then washed three times with PBS and incubated 20 minutes in methanol with 2% H2O2. Peroxidase in the sections was blocked by using a Vector Avidin/Biotin Blocking Kit and either a Vector VECTASTAIN Elite ABC Kit (Rat IgG) or a Vector M.O.M. Peroxidase Kit (Vector Laboratories; Burlingame, CA). Sections were incubated overnight at 4°C with the primary antibody (anti- methylglyoxal-derived AGEs 1:20 [3D11]; anti-Nε-CML epitopes 1:100 [4G9; Alteon]; anti-OST48 1:4 [Santa Cruz Biotechnologies]; anti-F4/80 1:25 [Caltag Laboratories, Burlingame, CA]; and anti-α-SMA 1:60 [Sigma]). After washing with PBS, slides were incubated with the appropriate secondary antibody using a Vector M.O.M. Peroxidase Kit or a Vector VECTASTAIN Elite ABC Kit (Rat IgG) according to the manufacturer’s instructions and stained with a Vector DAB Substrate Kit or an Alkaline Phosphatase Substrate Kit III (Vector Laboratories). Nuclei were stained with hematoxylin (Millipore, Billerica, MA) and mounted by using Permount (Fisher Scientific, Pittsburgh, PA).
Triglycerides and Cholesterol Levels
Blood triglyceride and total cholesterol concentrations were measured, at baseline and after exposure to the high-fat diet, with two different kits (BioVision, Mountain View, CA) according to the manufacturer’s instructions.
Statistics
All data are expressed as mean ± SEM. Differences of means between groups were analyzed by the unpaired, two-tailed Student’s t-test. Statistical significance was defined as a P value of <0.05. All data analyses were performed by using the GraphPad Prism statistical program (GraphPad Software, Inc., San Diego, CA).34,35
Results
Characterization of AGER1-tg Mice: Transgene Expression
AGER1 transgene expression was found significantly increased in multiple tissues of AGER1-tg mice including aorta and heart, as compared with wild-type mice (Figure 1B). AGER1 protein levels were also significantly increased in several highly vascular tissues of AGER1-tg mice, ie, heart, liver, spleen, and kidney (Figure 2, A and B).
Figure 2.

A: AGER1 protein expression in heart, liver, spleen, and kidney tissues from AGER1-tg mice based on Western analysis. B: Densitometric data from Western blots, shown as a ratio of AGER1 to β-actin (n = ∼3/group), (C) Serum CML levels. D: Plasma 8-isoprostane levels from the same mice as in A and B, data shown as mean ± SEM. E: Tissue associated radioactivity 2 hours after injection of 125I-AGE-BSA in protein extracts of kidney, liver, and spleen, shown as mean ± SEM. *P < 0.05 versus wild-type (WT) mice; **P < 0.01 versus WT mice.
AGER1-tg Mice Have Increased Serum and Tissue AGE Turnover and Decreased OS
Because AGER1 mediates AGE uptake in vitro,16,17 we tested the effect of overexpression of the AGER1 transgene on the levels of native AGEs in vivo. Serum CML levels were significantly decreased in serum of AGER1-tg mice at baseline (∼3 months of age, P < 0.05) compared with wild-type mice (C57B6) (Figure 2C). Basal tissue levels for two AGEs, CML and MG, did not differ between AGER1-tg and wild-type mice, and although without reaching significance, liver AGE levels were lower in the AGER1-tg mice than in wild-type mice (Table 2). A lower basal oxidant burden in the AGER1-tg mice was also reflected in the lower levels of 8-isoprostanes, endogenous lipid peroxidation products (Figure 2D). As a test of the ability of AGER1 transgene product to remove exogenous AGEs, tissue-associated 125I-AGE-BSA was measured in AGER1-tg mice within 2 hours of injection. The tissue levels of labeled peptides in AGER1-tg mice were decreased to ∼10 to 20% of that in wild-type controls (P < 0.05) (Figure 2E).
Table 2.
Epidemiologic and Biochemical Characteristics of AGER1-tg mice
| Baseline (BL)
|
After high-fat diet (HFD; administered for 8 weeks)
|
||||
|---|---|---|---|---|---|
| AGER1-tg | Wild-type | AGER1-tg | Wild-type | ||
| Weight, g | 22.72 ± 0.80 | 19.56 ± 1.29 | 25.76 ± 0.56* | 27.13 ± 1.27† | *P<0.01 vs. AGER1-tg BL |
| †P<0.01 vs. wild-type BL | |||||
| Fasting blood glucose, mg/dl | 111.3 ± 9.86 | 102.6 ± 5.25 | 111.9 ± 5.26 | 130.7 ± 4.69†‡ | †P<0.01 vs. wild-type BL |
| ‡P<0.05 vs. AGER1-tg HFD | |||||
| Fasting insulin, ng/ml | 0.287 ± 0.06 | 0.272 ± 0.03 | 0.363 ± 0.03 | 0.365 ± 0.04 | NS |
| Triglycerides, mg/dl | 91.70 ± 17.08 | 96.48 ± 20.06 | 203.6 ± 32.35§ | 194.0 ± 18.15¶ | §P<0.05 vs. AGER1-tg BL |
| ¶P<0.05 vs. wild-type BL | |||||
| Cholesterol, mg/dl | 106.4 ± 16.62 | 111.5 ± 7.65 | 190.8 ± 20.86§ | 170.6 ± 16.84† | §P<0.05 vs. AGER1-tg BL |
| †P<0.01 vs. wild-type BL | |||||
| Serum CML, U/ml | 15.51 ± 1.16 | 20.21 ± 0.25§ | 48.88 ± 3.63∥ | 51.87 ± 4.99¶ | §P<0.05 vs. AGER1-tg BL |
| ∥P<0.001 vs. AGER1-tg BL | |||||
| ¶P<0.05 vs. wild-type BL | |||||
| Serum MG, nmol/ml | 0.94 ± 0.21 | 1.02 ± 0.24 | 2.25 ± 0.16* | 2.24 ± 0.24¶ | *P<0.01 vs. AGER1-tg BL |
| ¶P<0.05 vs. wild-type BL | |||||
| Kidney CML, U/mg prot | 20.58 ± 2.20 | 21.05 ± 1.66 | 21.77 ± 1.04 | 27.39 ± 1.44** | **P<0.01 vs. AGER1-tg HFD |
| Liver CML, U/mg prot | 11.99 ± 2.51 | 20.02 ± 3.51 | 19.22 ± 1.55 | 33.47 ± 1.48†,†† | †P<0.01 vs. wild-type BL †† |
| ††P<0.001 vs. AGER1-tg HFD | |||||
| Kidney MG, nmol/mg prot | 1.07 ± 0.09 | 1.13 ± 0.14 | 0.96 ± 0.09 | 1.92 ± 0.09†,†† | †P<0.01 vs. wild-type BL |
| ††P<0.001 vs. AGER1-tg HFD | |||||
| Liver MG, nmol/mg prot | 0.91 ± 0.05 | 0.85 ± 0.02 | 1.13 ± 0.15 | 1.49 ± 0.18 | NS |
| Plasma 8-isoprostane, pg/ml | 61.18 ± 8.68 | 111.16 ± 3.53* | 100.29 ± 5.30* | 127.51 ± 8.89‡ | *P<0.01 vs. AGER1-tg BL |
| ‡P<0.05 vs. AGER1-tg HFD | |||||
| Liver GSH/GSSG ratio | 1.08 ± 0.05 | 0.81 ± 0.08§ | 0.89 ± 0.10 | 1.15 ± 0.13 | §P<0.05 vs. AGER1-tg BL |
| Kidney GSH/GSSG ratio | 2.35 ± 0.15 | 1.80 ± 0.04§ | 1.65 ± 0.28 | 1.02 ± 0.08†‡‡ | §P<0.05 vs. AGER1-tg BL |
| †P<0.05 vs. AGER1-tg HFD†† | |||||
| ‡‡P<0.001 vs. wild-type BL | |||||
All values are expressed as meanSEM. NS, not significant.
Tissue levels of both CML and MG were also assessed after the high-fat diet. While in wild-type mice they were found increased above the baseline after the high-fat diet, they were not increased in AGER1-tg mice (Table 2). The CML levels in kidney and liver tissue of AGER1-tg mice remained below those in wild-type mice after the high-fat diet (Figure 3A). Although MG levels were elevated in the kidneys of wild-type mice after the high-fat diet, the levels in AGER1-tg mice were not different from baseline values (Table 2). In addition, immunostaining for MG and CML in the vascular wall of AGER1-tg mice was lower than in wild-type controls, by immunohistochemical staining (Figure 3B). Antioxidant GSH status in different tissues was assessed at baseline and after the high-fat diet to assess intracellular OS. A higher basal GSH/GSSG ratio was found in AGER1-tg mice in both kidney and liver tissues, and was maintained at higher levels in the AGER1-tg kidneys after the fatty diet overload (Table 2). These results were consistent with a higher anti-oxidant capacity in the AGER1-tg mice.
Figure 3.

Tissue AGEs are lower in AGER1-tg mice compared with wild-type (WT) mice, after a high-fat diet. A: Kidney and liver CML immunoreactivity is shown as mean ± SEM, based on enzyme-linked immunosorbent assay. B: Arterial tissue CML- and MG-positive staining, based on specific monoclonal antibodies (4C7 and 3D11, respectively) (Original magnification, ×400).
AGER1-tg Mice Are Resistant to Diet-Induced Glucose Intolerance
Because increased AGEs and OS after a high-fat diet are known to contribute to impaired glucose tolerance and diabetes,30 we examined whether AGER1 overexpression would reduce these changes in AGER1-tg mice. Both AGER1-tg and wild-type mice had similar glucose and lipid levels at baseline. However, after 8 weeks of a high-fat diet, both groups of mice had significantly increased fasting circulating lipids, but only wild-type mice had increased blood glucose (Table 2, Figure 4D). Before the diet, there were no differences between the groups with respect to glucose tolerance (Figure 4A). However after 8 weeks on the high fat diet, fasting glucose was higher in wild-type than in AGER1-tg (Table 2). In addition, a glucose tolerance test after this period revealed that blood glucose levels returned more rapidly to baseline in AGER1-tg mice than in wild-type mice (Figure 4B). Furthermore, stable hyperglycemia, found in only 1/14 AGER1-tg mice (7%), was present in a significantly greater number of wild-type mice (7/13 or 53.8%) (P < 0.02) (Figure 4C). There were no significant differences in insulin tolerance between the two groups after the diet (Figure 4D).
Figure 4.

AGER1-tg mice are resistant to diet-induced glucose intolerance. Intravenous glucose tolerance tests were performed before (A), or after (B) 8 weeks of a high-fat diet in AGER1-tg mice (n = 14) and wild-type (WT) mice (n = 13), as described. Blood glucose levels were determined at the indicated intervals. Data are expressed as the mean SEM percentage of peak blood glucose value after infusion. *P < 0.05 versus wild-type mice; **P < 0.01 versus wild-type mice. C: Hyperglycemia in AGER1-tg mice (n = 14) (closed bars) and wild-type mice (n = 13) (shaded) after the high-fat diet (8 weeks). Data indicate the percentage of mice with stable fasting hyperglycemia (fasting blood glucose >130 mg/dl), on at least two measurements per mouse. D: Insulin tolerance test after the high-fat diet. Shown are blood glucose levels (*P < 0.05).
AGER1-tg Mice Have Markedly Reduced Neointimal Formation and Inflammatory Response after Femoral Artery Injury
Eight weeks after initiating the high-fat diet and 4 weeks after acute vascular injury, neointima hyperplasia was prominent and uniformly present in wild-type mice (Figure 5A). The thickened intima contained many nucleated cells and a large amount of extracellular matrix. The media was irregular in width, and where it was focally thickened there was an increased amount of connective tissue in association with a decreased number of nuclei. The thickened areas were bordered by inflammatory infiltrates in both the adventitia (Figure 5A, upper arrow) and the media (Figure 5A, lower arrow). The intima/media ratio was significantly higher in the wild-type mice compared with AGER1-tg mice (P < 0.01) (Figure 5C). A large number of macrophages were irregularly scattered throughout the media of wild-type vessels (Figure 5D, lower arrow), particularly in association with small mononuclear inflammatory cells. Similarly, macrophages and inflammatory cells were locally prominent in the adventitia (Figure 5, A and D, upper arrows). Although the cells that were most consistently stained for α-SMA were in the media, many of the cells in the thickened intima and some of the adventitial cells in wild-type mice were positively stained (Figure 5F).
Figure 5.

AGER1-tg mice have suppressed intimal hyperplasia and inflammatory responses to a high-fat diet and wire injury. Histological and morphometric analysis of injured femoral artery sections after a high-fat diet (8 weeks) and wire-induced injury (4 weeks) in AGER1-tg mice (n = 14) and wild-type (WT) mice (n = 13). Representative sections of injured vessels from wild-type mice (A, D, and F, n = 13) and AGER1-tg mice (B, E, and G, n = 14) after 8 weeks of a high-fat diet. A and B: Massons-Trichrome staining (original magnification, ×200). C: Intima/Media (I/M) ratio; AGER1-tg mice (*P < 0.01) versus wild-type mice. D and E: Anti-macrophage (F4/80) staining. E and F: α-SMA staining. A: Inflammatory cell infiltrates; upper arrow, adventitia; lower arrow, media. B: Upper arrow, intimal plaque; double arrows, area of medial fibrosis. C: I/M ratio. D: Upper arrow, macrophages in the adventitia; lower arrow, macrophages in the media. E: No macrophages visualized. F: α-SMA staining is present in all three layers of the vascular wall. G: α-SMA staining is limited to the media.
The femoral artery lumen in high-fat-fed AGER1-tg mice was widely patent and there were only focal, small areas in which neointima formation was noted (Figure 5B, upper arrow; Figure 6F, arrow). When present, the neointima was hypocellular and contained an increased amount of connective tissue by trichrome staining. In contrast to wild-type vessels, infiltration with inflammatory cells or macrophages was almost undetectable in any segment of the vessel wall in AGER1-tg mice (Figure 5, B and E). There were focal areas in the media of AGER1-tg mice in which there was an increased amount of connective tissue, and decreased numbers of cells (Figure 5B, double arrow). Such fibrotic areas contained extracellular CML deposits (Figure 6F, double arrow). Extracellular CML was also present in the localized intimal lesions of AGER1-tg mice (Figure 6F, single arrow). In contrast to wild-type mice, α-SMA-positive cells in the injured femoral arteries of AGER1-tg mice were limited to the media of AGER1-tg mice (Figure 5G). Note that the areas corresponding to the areas of increased connective tissue in the media contained fewer α-SMA-positive cells, and the cells were smaller.
Figure 6.

AGER1 expression and the location and amount of AGEs in AGER1-tg and wild-type (WT) mice. Analysis of femoral artery sections by immunohistochemistry after a high-fat diet (8 weeks) and wire-induced injury (4 weeks) in AGER1-tg mice (n = 14) and wild-type mice (n = 13). Representative sections of injured vessels from wild-type (A, C, and E) and AGER1-tg mice (B, D, and F), stained with anti-AGER1 (A and B), anti-MG (C and D), and anti-CML (E and F) antibodies, as described. Arrows indicate cellular localization of AGER1 (A and B), the thinned media, compared with thickened and cellular intima in wild-type mice (C) and to the normal intima of AGER1-tg mice (D); and an area of fibrosis (F). A: Many cells in the hyperplastic intima do not contain AGER1 (arrow). B: The media contains scattered areas of fibrosis (arrow). C: The media (arrows) underlying the hyperplastic intima is thinned; intracellular MG staining is present in all cell layers. D: Cells in the fibrotic areas of the media are smaller, but contain MG intracellularly. E: CML is present in the cytoplasm of cells of all three layers, and in the focally dense extracellular matrix of the media (arrow). F: CML is present in the extracellular matrix of the occasional plaques (arrow) and in the fibrotic areas of the media (double arrows).
AGER1 Expression, Location, and Amount of AGEs in AGER1-tg and Wild-Type Mice
AGER1 expression was significantly increased in the vascular cells of the transgenic mouse, especially in the tunica media in which the cells were larger compared with wild-type mice (Figure 6, A and B). In addition, endothelial cells and a variety of cells in the adventitia stained positively for AGER1 in the transgenic mice. The AGER1 staining appeared mostly cytoplasmic and largely co-localized with CML and MG staining in AGER1 mice. The focal areas of the media in transgenic mice that contained dense connective tissue contained fewer and smaller cells with reduced amounts of CML and MG (Figure 6D, arrow). However, some extracellular CML was also detected in the extracellular matrix (Figure 6F, double arrows). Interestingly, extracellular CML was also noted in areas with a subintimal lesion of transgenic mice (Figure 6F, arrow). The fact that increased AGER1 expression was associated with reduced or absent intracellular MG and CML staining in the media of the transgenic mice might be related to a higher AGE removal rate by AGER1.
The cells in the hyperplastic intima of the wild-type mice were smaller in size, and while 30 to 40% of cells did not stain positively for AGER1 (Figure 6A, arrow), most contained large amounts of MG and CML (Figure 6, C and E). This observation is consistent with the observed decrease in AGER1 levels in the presence of persistently high serum AGE levels in this group.26,27 The total number of cells in the vascular wall was much greater in the wild-type mice due to the hyperplastic intima, as was the intensity of intracellular CML and MG staining (Figure 6, C and E). Interestingly, while an increased amount of connective tissue was noted (by trichrome staining) in the hyperplastic intima, AGE staining was mostly intracellular in this area (Figure 6, C and E). This, coupled with the prominent α-SMA staining in most cells of the intima, suggests that there was a higher connective tissue turn-over rate, such that it likely exceeded the rate of extracellular AGE accumulation. However, the media did contain extracellular CML (Figure 6E, arrow). The tunica media in wild-type mice, as demarcated by the internal and external elastic laminae, was irregularly thinned (Figures 5A and 6C) compared with transgenic mice (Figures 5B and 6B). CML deposits in the adventitia of wild-type mice were also increased (Figure 6E), compared with AGER1-tg mice, and this correlated with the large number of macrophages seen in this area (Figure 5D).
Discussion
In this report, we show that AGER1-tg mice maintained significantly lower levels of systemic AGEs and OS and are more resistant to high-fat diet-induced glucose intolerance as compared with wild-type mice. Furthermore, after wire-induced femoral artery injury, the marked neointimal hyperplasia and inflammatory cell infiltration seen in wild-type mice were largely absent in AGER1-tg mice.
CVD is characterized by increased OS and inflammation, and progression is accelerated by conditions that further increase OS, ie, hyperlipidemia, hyperglycemia, and chronic kidney disease.1,37,38,39 These conditions are associated with elevated AGEs, whereas a lower AGE burden correlates with reduced OS and inflammation in patients with diabetes8,9,40 and in mice with chronic vascular34,35 or kidney disease.41
Cellular responses to AGEs are mediated by interactions with two major classes of cell surface receptors, which mediate distinct responses.40 RAGE contributes to the generation of ROS and enhances inflammatory responses to AGEs and other agents, primarily via NF-κB activation.19,20,42 In contrast, AGER1, a type I transmembrane protein, has at least two properties that reduce OS and inflammation. First, it mediates AGE uptake and degradation, thereby reducing the extracellular levels of these potent oxidants.17,43 Secondly, it acts as a potent anti-oxidant molecule, in part, via its inhibition of AGE-mediated ROS-dependent signaling promoted by RAGE17,18 as well as by epidermal growth factor receptor via Shc/Grb2/Ras and Erk1/2 pathways.18,22 Although RAGE and AGER1 are up-regulated by their ligands,40,42,44 their responses differ in the presence of persistently high OS. Namely, RAGE levels increase with rising OS, whereas AGER1 levels can be decreased with long-term elevated OS.13,26,27 Because AGER1 potentially has a potent anti-AGE and anti-inflammatory function in vivo, it is important to understand its regulation.
The present study demonstrates that the maintenance of high AGER1 levels provides effective protection against AGE accumulation, OS, and inflammation in high-fat fed mice subjected to acute vascular injury. AGER1-tg mice had a normal phenotype. They had two- to fourfold higher levels of AGER1 than wild-type controls, which may explain the observation that they had decreased baseline levels of circulating CML and of markers of OS. The tissue levels of two distinct AGEs, CML and MG, increased in wild-type mice as a function of exposure to the high-fat, high-AGE diet.30 However, neither AGE compound increased in tissues from AGER1-tg mice, despite an identical dietary burden. This fact, together with lower levels of AGEs after a bolus injection of labeled AGEs, suggested that reduced tissue levels of AGEs may be related to an internalization function of AGE-R1, as well as to other mechanisms.
We previously found that a large proportion (∼70%) of AGEs absorbed from the diet were deposited in tissues of naive mice.32 In the current study, we found that the large influx of AGE-rich lipids from the high-fat diet led to a parallel increase in serum AGE levels in wild-type and AGER1-tg mice, but that serum and tissue levels of AGEs were not increased in AGER1-tg mice. Taken together these findings suggest that although the ingested AGEs were partly deposited in the tissues in wild-type mice, high AGER1 expression in AGER1-tg mice facilitated the clearance of the dietary load AGEs from tissues. This may explain the decreased levels of OS and inflammation in the AGER1-tg mice.
AGEs, such as the relatively inert terminal product CML, or the highly reactive oxidant AGE precursor, MG, and its derivatives form intracellularly during normal metabolism.6,9 They are also present in the diet, conjugated with proteins and lipids.8,9,30,31 Prolonged consumption of a high-fat diet, which is also AGE-enriched by way of pre-exposure to heat,30 increases the levels of circulating oxidants, such as 8-isoprostanes, which promote further OS and AGE formation.8,30 If this “vicious cycle” leads to the reduction of AGER1 levels, the native intracellular anti-oxidants may also be suppressed. This possibility is supported by the observed loss in intracellular anti-oxidant GSH potential in wild-type mice, which is associated with lower levels of AGER1 and increased levels of AGEs and OS.28 Further support for such an effect is that MG, an active oxidant, was present in most cells of the intima in wild-type mice, whereas AGER1 was detectable in a much smaller fraction. This contrasts with the uniform co-localization of AGER1 and MG in most vascular cells of AGER1-tg mice. These data suggest that if AGER1 levels are maintained, despite increased stress, they can effectively enhance AGE removal, even during excessive influx from exogenous sources. Thus, the maintenance or enhancement of AGER1 expression in vivo may help preserve normal cellular redox status, during periods of systemic oxidant overload.
The effect of high-level AGER1 expression on vascular injury responses was examined in a well-known model of wire-induced acute femoral arterial injury in fat-fed mice.33 This model represents a complex pathological process, involving endothelial cell denudation, vascular smooth muscle cell migration and proliferation, infiltration by inflammatory cells, oxidant overload, and procoagulant responses.33,34,35 We found that AGER1 was highly expressed in the cytoplasm of cells in all layers of the injured femoral artery of AGER1-tg mice. In contrast, AGER1 staining was markedly attenuated or not detectable in 30 to 40% of cells contained in the massively thickened intima in wild-type mice. Although the injured arteries in AGER1-tg displayed only a minimal intimal response, the intima in wild-type mice was thickened, multilayered, and contained α-SMA-positive cells surrounded by a dense layer of connective tissue. Of note, in the intima of wild-type mice AGEs were mostly intracellular relative to those AGEs detected in the connective tissue, suggesting that an increased number of cells in this region were actively involved in extracellular matrix turnover. Intimal lesions in AGER1-tg mice, while also present, were small and few in number. These were largely composed of connective tissue, which was largely CML-positive, suggesting that the repaired connective tissue slowly accumulated stable AGEs. AGEs have been implicated in the inflammatory response, increased proliferation of vascular smooth muscle cells, and senescence of endothelial cells.34,41,45,46 The current study, showing that cells in the hyperplastic neointima of wild-type controls contained prominent α-SMA staining, is consistent with the suggestion that these were AGE-activated smooth muscle cells derived from the media.46,47
The media in AGER1-tg of injured femoral arteries mice was generally of normal width, and although multifocal areas resembled healed scars, cells with abundant AGER1 positive staining material suggested that the vascular injury in the AGER1-tg mice resolved by fibrosis, rather than by increased smooth muscle cell proliferation and/or migration. This contrasted to the thinned media in wild-type mice, which contained many hypocellular, fibrotic areas that contained CML-positive connective tissue. The significant inflammatory infiltrate present in the media and adventitia of wild-type controls was not seen in AGER1-tg mice, consistent with the anti-inflammatory properties previously attributed to AGER1.3,18
Although the present findings are the first in vivo evidence of the ability of AGER1 to control AGE levels and AGE-induced cellular responses, the beneficial effects of efficient AGE removal are well established. For instance, studies in ApoE-deficient mice crossed with mice transgenic for soluble AGE-binding molecules thought to aid in their clearance, such as lysozyme,48 or mice treated with soluble RAGE,20 have linked low AGEs to attenuated responses to injury and to exogenous oxidant burden, despite hyperlipidemia. Furthermore, prevention of the age-dependent loss in AGER1 expression and efficacy, by restriction of dietary AGEs, or calories, preserved anti-oxidant defenses, delayed cardiovascular and renal changes, and prolonged lifespan in aging mice.28 Thus, both the absolute AGER1 levels and its responsiveness to increased levels of AGEs may be important.
A link between high AGER1 levels and improved glucose metabolism, previously found in aging mice kept for life on reduced AGE intake,30,49,50 was confirmed in the present study. We found that AGER1-tg mice had increased resistance to the metabolic effects of the high-fat diet, whereas the majority of wild-type mice became glucose-intolerant and/or stably hyperglycemic. The changes seen in wild-type mice, but not in AGER1-tg mice were related to the higher oxidant and/or AGE burden found in wild-type mice compared with AGER1-tg mice. These involved impaired peripheral glucose uptake and utilization in wild-type mice, because neither plasma insulin nor lipid levels differed significantly from those in AGER1-tg mice. Two recent articles suggest that high levels of AGEs may have direct effects on glucose metabolism, and could explain the higher glucose levels and the impaired responses to glucose and insulin we found in wild-type mice after the high-fat diet. One study showed that the injection of AGEs reduced insulin secretion in mice, presumably by inhibiting ATP production via inhibition of cytochrome c oxidase, which resulted in an impairment of glucose-stimulated insulin secretion through inducible nitric oxide synthase-dependent nitric oxide production.51 A second study showed that increased levels of AGEs contribute to peripheral insulin resistance in mice by impairing insulin action via the formation of a multimolecular complex that includes insulin receptor substrate 1, RAGE, and SRC in striated muscle cells.52 In both of these studies, high levels of AGEs were shown to result in hyperglycemia. Given that pro-oxidants such as AGEs are toxic to pancreatic islets53,54,55 and that anti-AGE agents and diets protect against islet and β-cell injury and dysfunction,30,53 it is possible that AGER1 overexpression could protect against β-cell injury as a matter of course. Further studies are required to elucidate the mechanisms involved in these effects. However, in an elegant study on bone marrow-derived vascular wall progenitors in a mouse model of diabetes and obesity, both insulin resistance and vascular function were restored toward normal by either decreasing OS with a selenorganic antioxidant or the introduction of normal progenitors.4
In conclusion, the current study confirms in vitro data and correlations in animal and clinical studies, indicating that AGER1 is an important inhibitor of the systemic toxicity of AGEs and OS. While focusing on vascular injury, this study provides the first direct evidence of a beneficial relationship between AGER1 expression, systemic anti-AGE actions, and vascular responses to injury. The mechanisms by which these occur in vivo remain to be established, but may converge on the timely neutralization of pro-inflammatory effects of AGEs and ROS.
Footnotes
Address reprint requests to Helen Vlassara, Division of Experimental Diabetes and Aging, Mount Sinai School of Medicine, Box 1640, One Gustave Levy Place, New York, NY 10029. E-mail: helen.vlassara@mssm.edu.
Supported by AG00943 and HL73417 to H.V.
Current address of H.L.: Cornell University Medical Center, New York, NY.
References
- Ross R. Atherosclerosis: an inflammatory disease. N Engl J Med. 1999;340:115–126. doi: 10.1056/NEJM199901143400207. [DOI] [PubMed] [Google Scholar]
- Madamanchi NR, Runge MS. Mitochondrial dysfunction in atherosclerosis. Circ Res. 2007;100:460–473. doi: 10.1161/01.RES.0000258450.44413.96. [DOI] [PubMed] [Google Scholar]
- Liu SX, Hou FF, Guo ZJ, Nagai R, Zhang WR, Liu ZQ, Zhou ZM, Zhou M, Xie D, Wang GB, Zhang X. Advanced oxidation protein products accelerate atherosclerosis through promoting oxidative stress and inflammation. Arterioscler Thromb Vasc Biol. 2006;26:1156–1162. doi: 10.1161/01.ATV.0000214960.85469.68. [DOI] [PubMed] [Google Scholar]
- Chen J, Li H, Addabbo F, Zhang F, Pelger E, Patschan D, Park HC, Kuo MC, Ni J, Gobe G, Chander PN, Nasjletti A, Goligorsky MS. Adoptive transfer of syngeneic bone marrow-derived cells in mice with obesity-induced diabetes: selenoorganic antioxidant ebselen restores stem cell competence. Am J Pathol. 2009;174:701–711. doi: 10.2353/ajpath.2009.080606. [DOI] [PMC free article] [PubMed] [Google Scholar]
- Chen J, Park HC, Addabbo F, Ni J, Pelger E, Li H, Plotkin M, Goligorsky MS. Kidney-derived mesenchymal stem cells contribute to vasculogenesis, angiogenesis and endothelial repair. Kidney Int. 2008;74:879–889. doi: 10.1038/ki.2008.304. [DOI] [PMC free article] [PubMed] [Google Scholar]
- Brownlee M. Biochemistry and molecular cell biology of diabetic complications. Nature. 2001;414:813–820. doi: 10.1038/414813a. [DOI] [PubMed] [Google Scholar]
- Stadtman ER. Protein oxidation and aging. Science. 1992;257:1220–1224. doi: 10.1126/science.1355616. [DOI] [PubMed] [Google Scholar]
- Vlassara H, Cai W, Crandall J, Goldberg T, Oberstein R, Dardaine V, Peppa M, Rayfield EJ. Inflammatory mediators are induced by dietary glycotoxins, a major risk factor for diabetic angiopathy. Proc Natl Acad Sci USA. 2002;99:15596–15601. doi: 10.1073/pnas.242407999. [DOI] [PMC free article] [PubMed] [Google Scholar]
- Huebschmann AG, Regensteiner JG, Vlassara H, Reusch JE. Diabetes and advanced glycoxidation end products. Diabetes Care. 2006;29:1420–1432. doi: 10.2337/dc05-2096. [DOI] [PubMed] [Google Scholar]
- Schleicher E, Friess U. Oxidative stress AGE, and atherosclerosis. Kidney Int Suppl. 2007;106:S17–S26. doi: 10.1038/sj.ki.5002382. [DOI] [PubMed] [Google Scholar]
- Uribarri J, Cai W, Peppa M, Goodman S, Ferrucci L, Striker G, Vlassara H. Circulating glycotoxins and dietary advanced glycation endproducts: two links to inflammatory response, oxidative stress, and aging. J Gerontol A Biol Sci Med Sci. 2007;62:427–433. doi: 10.1093/gerona/62.4.427. [DOI] [PMC free article] [PubMed] [Google Scholar]
- Uribarri J, Stirban A, Sander D, Cai W, Negrean M, Buenting CE, Koschinsky T, Vlassara H. Single oral challenge by advanced glycation end products acutely impairs endothelial function in diabetic and nondiabetic subjects. Diabetes Care. 2007;30:2579–2582. doi: 10.2337/dc07-0320. [DOI] [PubMed] [Google Scholar]
- Vlassara H, Cai W, Goodman S, Pyzik R, Yong A, Chen X, Zhu L, Neade T, Beeri M, Silverman JM, Ferrucci L, Tansman L, Striker GE, Uribarri J: Protection against loss of innate defenses in adulthood by low AGE intake; role of an anti-inflammatory Age-receptor-1. J Clin Endo Met 2009 (in press) [DOI] [PMC free article] [PubMed] [Google Scholar]
- Uribarri J, Peppa M, Cai W, Goldberg T, Lu M, He C, Vlassara H. Restriction of dietary glycotoxins reduces excessive advanced glycation end products in renal failure patients. J Am Soc Nephrol. 2003;14:728–731. doi: 10.1097/01.asn.0000051593.41395.b9. [DOI] [PubMed] [Google Scholar]
- Linden E, Cai W, He JC, Xue C, Li Z, Winston J, Vlassara H, Uribarri J. Endothelial dysfunction in patients with chronic kidney disease results from advanced glycation end products (AGE)-mediated inhibition of endothelial nitric oxide synthase through RAGE activation. Clin J Am Soc Nephrol. 2008;3:691–698. doi: 10.2215/CJN.04291007. [DOI] [PMC free article] [PubMed] [Google Scholar]
- Yang Z, Makita Z, Horii Y, Brunelle S, Cerami A, Sehajpal P, Suthanthiran M, Vlassara H. Two novel rat liver membrane proteins that bind advanced glycosylation endproducts: relationship to macrophage receptor for glucose-modified proteins. J Exp Med. 1991;174:515–524. doi: 10.1084/jem.174.3.515. [DOI] [PMC free article] [PubMed] [Google Scholar]
- Lu C, He JC, Cai W, Liu H, Zhu L, Vlassara H. Advanced glycation endproduct (AGE) receptor 1 is a negative regulator of the inflammatory response to AGE in mesangial cells. Proc Natl Acad Sci USA. 2004;101:11767–11772. doi: 10.1073/pnas.0401588101. [DOI] [PMC free article] [PubMed] [Google Scholar]
- Cai W, He JC, Zhu L, Lu C, Vlassara H. Advanced glycation end product (AGE) receptor 1 suppresses cell oxidant stress and activation signaling via EGF receptor. Proc Natl Acad Sci USA. 2006;103:13801–13806. doi: 10.1073/pnas.0600362103. [DOI] [PMC free article] [PubMed] [Google Scholar]
- Sakaguchi T, Yan SF, Yan SD, Belov D, Rong LL, Sousa M, Andrassy M, Marso SP, Duda S, Arnold B, Liliensiek B, Nawroth PP, Stern DM, Schmidt AM, Naka Y. Central role of RAGE-dependent neointimal expansion in arterial restenosis. J Clin Invest. 2003;111:959–972. doi: 10.1172/JCI17115. [DOI] [PMC free article] [PubMed] [Google Scholar]
- Harja E, Bu DX, Hudson BI, Chang JS, Shen X, Hallam K, Kalea AZ, Lu Y, Rosario RH, Oruganti S, Nikolla Z, Belov D, Lalla E, Ramasamy R, Yan SF, Schmidt AM. Vascular and inflammatory stresses mediate atherosclerosis via RAGE and its ligands in apoE−/− mice. J Clin Invest. 2008;118:183–194. doi: 10.1172/JCI32703. [DOI] [PMC free article] [PubMed] [Google Scholar]
- Kelleher DJ, Kreibich G, Gilmore R. Oligosaccharyltransferase activity is associated with a protein complex composed of ribophorins I and II and a 48 kd protein. Cell. 1992;69:55–65. doi: 10.1016/0092-8674(92)90118-v. [DOI] [PubMed] [Google Scholar]
- Cai W, He JC, Zhu L, Chen X, Striker GE, Vlassara H. AGE-receptor-1 counteracts cellular oxidant stress induced by AGEs via negative regulation of p66shc-dependent FKHRL1 phosphorylation. Am J Physiol Cell Physiol. 2008;294:C145–C152. doi: 10.1152/ajpcell.00350.2007. [DOI] [PubMed] [Google Scholar]
- Migliaccio E, Giorgio M, Mele S, Pelicci G, Reboldi P, Pandolfi PP, Lanfrancone L, Pelicci PG. The p66shc adaptor protein controls oxidative stress response and life span in mammals. Nature. 1999;402:309–313. doi: 10.1038/46311. [DOI] [PubMed] [Google Scholar]
- Napoli C, Martin-Padura I, de Nigris F, Giorgio M, Mansueto G, Somma P, Condorelli M, Sica G, De Rosa G, Pelicci P. Deletion of the p66Shc longevity gene reduces systemic and tissue oxidative stress, vascular cell apoptosis, and early atherogenesis in mice fed a high-fat diet. Proc Natl Acad Sci USA. 2003;100:2112–2116. doi: 10.1073/pnas.0336359100. [DOI] [PMC free article] [PubMed] [Google Scholar]
- Camici GG, Schiavoni M, Francia P, Bachschmid M, Martin-Padura I, Hersberger M, Tanner FC, Pelicci P, Volpe M, Anversa P, Luscher TF, Cosentino F. Genetic deletion of p66(Shc) adaptor protein prevents hyperglycemia-induced endothelial dysfunction and oxidative stress. Proc Natl Acad Sci USA. 2007;104:5217–5222. doi: 10.1073/pnas.0609656104. [DOI] [PMC free article] [PubMed] [Google Scholar]
- He C, Zheng F, Sabol J, Stitt A, Striker L, Hattori M, Vlassara H. Differential expression of renal AGE-receptor genes in NOD mouse kidneys: possible role in non-obese diabetic renal disease. Kidney Int. 2000;58:1931–1940. doi: 10.1111/j.1523-1755.2000.00365.x. [DOI] [PubMed] [Google Scholar]
- He CJ, Koschinsky T, Buenting C, Vlassara H. Presence of diabetic complications in type 1 diabetic patients correlates with low expression of mononuclear cell AGE-receptor-1 and elevated serum AGE. Mol Med. 2001;7:159–168. [PMC free article] [PubMed] [Google Scholar]
- Cai W, He JC, Zhu L, Chen X, Wallenstein S, Striker GE, Vlassara H. Reduced oxidant stress and extended lifespan in mice exposed to a low glycotoxin diet: association with increased AGER1 expression. Am J Pathol. 2007;170:1893–1902. doi: 10.2353/ajpath.2007.061281. [DOI] [PMC free article] [PubMed] [Google Scholar]
- Cai W, He JC, Zhu L, Chen X, Zheng F, Striker GE, Vlassara H. Oral glycotoxins determine the effects of calorie restriction on oxidant stress, age-related diseases, and lifespan. Am J Pathol. 2008;173:327–336. doi: 10.2353/ajpath.2008.080152. [DOI] [PMC free article] [PubMed] [Google Scholar]
- Sandu O, Song K, Cai W, Zheng F, Uribarri J, Vlassara H. Insulin resistance and type 2 diabetes in high-fat-fed mice are linked to high glycotoxin intake. Diabetes. 2005;54:2314–2319. doi: 10.2337/diabetes.54.8.2314. [DOI] [PubMed] [Google Scholar]
- Cai W, Gao QD, Zhu L, Peppa M, He C, Vlassara H. Oxidative stress-inducing carbonyl compounds from common foods: novel mediators of cellular dysfunction. Mol Med. 2002;8:337–346. [PMC free article] [PubMed] [Google Scholar]
- He C, Sabol J, Mitsuhashi T, Vlassara H. Dietary glycotoxins: inhibition of reactive products by aminoguanidine facilitates renal clearance and reduces tissue sequestration. Diabetes. 1999;48:1308–1315. doi: 10.2337/diabetes.48.6.1308. [DOI] [PubMed] [Google Scholar]
- Roque M, Fallon JT, Badimon JJ, Zhang WX, Taubman MB, Reis ED. Mouse model of femoral artery denudation injury associated with the rapid accumulation of adhesion molecules on the luminal surface and recruitment of neutrophils. Arterioscler Thromb Vasc Biol. 2000;20:335–342. doi: 10.1161/01.atv.20.2.335. [DOI] [PubMed] [Google Scholar]
- Lin RY, Choudhury RP, Cai W, Lu M, Fallon JT, Fisher EA, Vlassara H. Dietary glycotoxins promote diabetic atherosclerosis in apolipoprotein E-deficient mice. Atherosclerosis. 2003;168:213–220. doi: 10.1016/s0021-9150(03)00050-9. [DOI] [PubMed] [Google Scholar]
- Lin RY, Reis ED, Dore AT, Lu M, Ghodsi N, Fallon JT, Fisher EA, Vlassara H. Lowering of dietary advanced glycation endproducts (AGE) reduces neointimal formation after arterial injury in genetically hypercholesterolemic mice. Atherosclerosis. 2002;163:303–311. doi: 10.1016/s0021-9150(02)00008-4. [DOI] [PubMed] [Google Scholar]
- Liu H, Zheng F, Li Z, Uribarri J, Ren B, Hutter R, Tunstead JR, Badimon J, Striker GE, Vlassara H. Reduced acute vascular injury and atherosclerosis in hyperlipidemic mice transgenic for lysozyme. Am J Pathol. 2006;169:303–313. doi: 10.2353/ajpath.2006.050885. [DOI] [PMC free article] [PubMed] [Google Scholar]
- Madamanchi NR, Vendrov A, Runge MS. Oxidative stress and vascular disease. Arterioscler Thromb Vasc Biol. 2005;25:29–38. doi: 10.1161/01.ATV.0000150649.39934.13. [DOI] [PubMed] [Google Scholar]
- Fox CS, Coady S, Sorlie PD, D'Agostino RB, Sr, Pencina MJ, Vasan RS, Meigs JB, Levy D, Savage PJ. Increasing cardiovascular disease burden due to diabetes mellitus: the Framingham Heart Study. Circulation. 2007;115:1544–1550. doi: 10.1161/CIRCULATIONAHA.106.658948. [DOI] [PubMed] [Google Scholar]
- Lewington S, Whitlock G, Clarke R, Sherliker P, Emberson J, Halsey J, Qizilbash N, Peto R, Collins R. Blood cholesterol and vascular mortality by age, sex, and blood pressure: a meta-analysis of individual data from 61 prospective studies with 55,000 vascular deaths. Lancet. 2007;370:1829–1839. doi: 10.1016/S0140-6736(07)61778-4. [DOI] [PubMed] [Google Scholar]
- Vlassara H. The AG: E-receptor in the pathogenesis of diabetic complications. Diabetes Metab Res Rev. 2001;17:436–443. doi: 10.1002/dmrr.233. [DOI] [PubMed] [Google Scholar]
- Zheng F, He C, Cai W, Hattori M, Steffes M, Vlassara H. Prevention of diabetic nephropathy in mice by a diet low in glycoxidation products. Diabetes Metab Res Rev. 2002;18:224–237. doi: 10.1002/dmrr.283. [DOI] [PubMed] [Google Scholar]
- Bierhaus A, Humpert PM, Morcos M, Wendt T, Chavakis T, Arnold B, Stern DM, Nawroth PP. Understanding RAGE, the receptor for advanced glycation end products. J Mol Med. 2005;83:876–886. doi: 10.1007/s00109-005-0688-7. [DOI] [PubMed] [Google Scholar]
- Stitt AW, Burke GA, Chen F, McMullen CB, Vlassara H. Advanced glycation end-product receptor interactions on microvascular cells occur within caveolin-rich membrane domains. FASEB J. 2000;14:2390–2392. doi: 10.1096/fj.00-0289fje. [DOI] [PubMed] [Google Scholar]
- Vlassara H, Moldawer L, Chan B. Macrophage/monocyte receptor for nonenzymatically glycosylated protein is upregulated by cachectin/tumor necrosis factor. J Clin Invest. 1989;84:1813–1820. doi: 10.1172/JCI114366. [DOI] [PMC free article] [PubMed] [Google Scholar]
- Chen J, Brodsky SV, Goligorsky DM, Hampel DJ, Li H, Gross SS, Goligorsky MS. Glycated collagen I induces premature senescence-like phenotypic changes in endothelial cells. Circ Res. 2002;90:1290–1298. doi: 10.1161/01.res.0000022161.42655.98. [DOI] [PubMed] [Google Scholar]
- Satoh H, Togo M, Hara M, Miyata T, Han K, Maekawa H, Ohno M, Hashimoto Y, Kurokawa K, Watanabe T. Advanced glycation endproducts stimulate mitogen-activated protein kinase and proliferation in rabbit vascular smooth muscle cells. Biochem Biophys Res Commun. 1997;239:111–115. doi: 10.1006/bbrc.1997.7424. [DOI] [PubMed] [Google Scholar]
- Sata M, Maejima Y, Adachi F, Fukino K, Saiura A, Sugiura S, Aoyagi T, Imai Y, Kurihara H, Kimura K, Omata M, Makuuchi M, Hirata Y, Nagai R. A mouse model of vascular injury that induces rapid onset of medial cell apoptosis followed by reproducible neointimal hyperplasia. J Mol Cell Cardiol. 2000;32:2097–2104. doi: 10.1006/jmcc.2000.1238. [DOI] [PubMed] [Google Scholar]
- Liu H, Zheng F, Cao Q, Ren B, Zhu L, Striker G, Vlassara H. Amelioration of oxidant stress by the defensin lysozyme. Am J Physiol Endocrinol Metab. 2006;290:E824–E832. doi: 10.1152/ajpendo.00349.2005. [DOI] [PubMed] [Google Scholar]
- Hofmann SM, Dong HJ, Li Z, Cai W, Altomonte J, Thung SN, Zeng F, Fisher EA, Vlassara H. Improved insulin sensitivity is associated with restricted intake of dietary glycoxidation products in the db/db mouse. Diabetes. 2002;51:2082–2089. doi: 10.2337/diabetes.51.7.2082. [DOI] [PubMed] [Google Scholar]
- Peppa M, He C, Hattori M, McEvoy R, Zheng F, Vlassara H. Fetal or neonatal low-glycotoxin environment prevents autoimmune diabetes in NOD mice. Diabetes. 2003;52:1441–1448. doi: 10.2337/diabetes.52.6.1441. [DOI] [PubMed] [Google Scholar]
- Zhao Z, Zhao C, Zhang XH, Zheng F, Cai W, Vlassara H, Ma ZA. Advanced glycation end products inhibit glucose-stimulated insulin secretion through nitric oxide-dependent inhibition of cytochrome c oxidase and ATP synthesis. Endocrinology. 2009;150:2569–2576. doi: 10.1210/en.2008-1342. [DOI] [PMC free article] [PubMed] [Google Scholar]
- Cassese A, Esposito I, Fiory F, Barbagallo AP, Paturzo F, Mirra P, Ulianich L, Giacco F, Iadicicco C, Lombardi A, Oriente F, Van Obberghen E, Beguinot F, Formisano P, Miele C. In skeletal muscle advanced glycation end products (AGEs) inhibit insulin action and induce the formation of multimolecular complexes including the receptor for AGEs. J Biol Chem. 2008;283:36088–36099. doi: 10.1074/jbc.M801698200. [DOI] [PMC free article] [PubMed] [Google Scholar]
- Takatori A, Ishii Y, Itagaki S, Kyuwa S, Yoshikawa Y. Amelioration of the beta-cell dysfunction in diabetic APA hamsters by antioxidants and AGE inhibitor treatments. Diabetes Metab Res Rev. 2004;20:211–218. doi: 10.1002/dmrr.428. [DOI] [PubMed] [Google Scholar]
- Sanz J, Fayad ZA. Imaging of atherosclerotic cardiovascular disease. Nature. 2008;451:953–957. doi: 10.1038/nature06803. [DOI] [PubMed] [Google Scholar]
- Lim M, Park L, Shin G, Hong H, Kang I, Park Y. Induction of apoptosis of Beta cells of the pancreas by advanced glycation end-products, important mediators of chronic complications of diabetes mellitus. Ann NY Acad Sci. 2008;1150:311–315. doi: 10.1196/annals.1447.011. [DOI] [PubMed] [Google Scholar]