Abstract
As part of our systematic exploration of chemical determinants for the olfactory potency of vapors towards humans, we measured concentration-detection functions for the odor of the homologous n-alkylbenzenes toluene, ethylbenzene, butylbenzene, hexylbenzene, and octylbenzene. A vapor delivery device based on dynamic olfactometry and calibrated by gas chromatography, served to test groups of 16 to 17 participants. Subjects were young adults from both genders, normosmics, and nonsmokers. Odor functions were tightly modeled by a sigmoid (logistic) function, both at the group and the individual level. Odor detection thresholds (ODTs), defined as the concentration producing a detectability half-way between chance and perfect detection, decreased with alkyl chain length from toluene (79 ppb) to butylbenzene (2.5 ppb), and then increased form butyl to octylbenzene (89 ppb). The “U”-shaped trend of ODTs as a function of alkyl chain length indicated a loss of odor potency beyond a certain molecular size, a phenomenon recently described for chemosensory irritation (chemesthesis) and that will need consideration in structure-activity models of chemosensory potency. Interindividual ODTs variability for any single odorant amounted to one order of magnitude, in agreement with recent studies of other homologous series but quite smaller than commonly depicted.
Keywords: Psychometric odor functions, Odor detection thresholds, n-Alkylbenzenes, Olfactory structure-activity relationships, Interindividual odor sensitivity
A key aspect in studies of the sense of smell relates to establishing structure-activity relationships between odorants (i.e., chemical vapors) and olfactory responses at the successive levels and stages within the pathway, culminating in the “in vivo” behavioral response. To achieve this goal, given the enormous variety of chemical structures depicted by odorants, it is important to find some chemical feature(s) that can serve as “unit of chemical change”. Carbon chain length, chemical functional group, and aromatic vs. aliphatic structures are three such possible metrics. In this study, we will focus on the odor detection by humans of aromatic hydrocarbons sharing a phenyl ring and differing in the length of their side carbon-chain, in other words, homologous alkylbenzenes.
The available data indicates that each olfactory sensory neuron (OSN) in the olfactory epithelium expresses one type (Nguyen et al., 2007; Serizawa et al., 2003) of about 380 possible intact human olfactory receptors (ORs) (Go and Niimura, 2008). In rodents, OSNs expressing the same receptor send their axons to two glomeruli in the olfactory bulb (Vassar et al., 1994) producing a ratio glomeruli to OR 2:1. In humans this ratio has recently been found to be considerable higher: 16:1, due to a much larger number of glomeruli and a smaller number of intact ORs (Maresh et al., 2008). The convergence, for example in rodents (Hellman and Chess, 2002), makes the bulb a revealing target for exploring the molecular receptive range of ORs (Mori et al., 2006). A few studies have tested olfactory bulb responses to aromatic odorants, including alkylbenzenes. Some of these used techniques mapping activity of large sections of the bulb (Farahbod et al., 2006; Johnson et al., 2005; Takahashi et al., 2004) whereas others probed single mitral/tufted bulb cells (Katoh et al., 1993). The outcome of all studies found significant topographic relationships (i.e., chemotopic representations) between the measured bulbar output and the chemical structure of alkylbenzenes and other aromatics, particularly in terms of length of the carbon chain, position of substituents, presence of functional groups and position of such groups (Johnson and Leon, 2007).
At the level of the olfactory epithelium, it has long been noted that the distribution of electroolfatogram (EOG) responses in rats for aromatic hydrocarbons is relatively uniform, i.e., responses of similar size are evoked across the epithelium, whereas, for other odorants, responses become progressively larger toward the ventral epithelium (Scott et al., 2000). Recently, it has also been shown that rat EOG responses from nonpolar odorants (as alkylbenzenes) are effective via both orthonasal (i.e., flow entering the external nares) and retronasal (i.e., flow entering the internal nares) presentations, whereas those from polar odorants are only effective via orthonasal presentations (Scott et al., 2007).
To the best of our knowledge, alkylbenzenes have not yet been linked to specific olfactory receptors (Skoufos et al., 2000) (http://senselab.med.yale.edu/OdorDB/). Nevertheless, occupational and environmental studies have often employed n-alkylbenzenes to test their chemosensory (odor and irritation) and neurological effects in the general population, (e.g., Mergler and Beauvais, 1992; van Thriel et al., 2003), in “chemically sensitive” individuals, (e.g., Osterberg et al., 2003; Seeber et al., 2002; van Thriel et al., 2002), and in the context of work/indoor exposures, (e.g., Nielsen and Alarie, 1982; Orbaek et al., 1998; Panev et al., 1998; Ryan et al., 2002; Yu et al., 2004). Alkylbenzenes were found to be important pollutants inside vehicles and buses (Parra et al., 2008).
In the present work, we continue our systematic measurement of human odor detection thresholds for members of homologous series. Here we test the following nalkylbenzenes: toluene, ethyl benzene, butyl benzene, hexyl benzene, and octyl benzene. As done in recent studies of other series (Cometto-Muñiz and Abraham, 2008b; 2009; Cometto-Muñiz et al., 2008) our methodology aims to achieve a tightly-controlled delivery of odorant vapors, allows subjects for a natural sampling (i.e., sniffing) of odorants without depleting the vapor-source, and follows a forced-choice procedure that minimizes olfactory adaptation and individual biases. Quantification of vapors is performed before and during actual testing via gas chromatography. Repetitive testing separated by ample resting (i.e., unexposed) time is used to obtain group and individual data. Odor detection is quantified as concentration-detection, i.e., psychometric, functions rather than just as single values of odor thresholds.
Experimental Procedures
An institutional review board at the University of California, San Diego, approved the protocol for all experiments described here. All participants provided written informed consent.
Stimuli
We tested the following odorants (purity in parenthesis): toluene (99.8%), ethyl benzene (≥99%), butyl benzene (99+%), hexyl benzene (98%), and octyl benzene (98%).
Subjects
A group of 36 subjects (18 female) participated in the study. Their age averaged (±standard deviation) 24 (±5) years, ranging from 18 to 36 years. They were all normosmics, as determined by a clinical olfactory test (Cain, 1989), and nonsmokers. Not all subjects were available to be tested on every chemical, but a subgroup of 4 subjects (2 female) was tested in common across all five alkylbenzenes. The characteristics of this subgroup and of those tested with each stimulus are shown in Table 1.
Table 1.
Characteristics of the subgroups of participants tested with each alkylbenzene and of the subgroup tested in common across all five alkylbenzenes.
| Subject subgroups |
Number of subjects |
Average Age (±SD) (years) |
Age range (years) |
Number of males |
Number of females |
|---|---|---|---|---|---|
| Toluene | 16 | 23 (±6) | 18–36 | 7 | 9 |
| Ethyl benzene | 17 | 25 (±5) | 20–36 | 9 | 8 |
| Butyl benzene | 16 | 24 (±5) | 18–36 | 9 | 7 |
| Hexyl benzene | 16 | 24 (±5) | 19–36 | 8 | 8 |
| Octyl benzene | 17 | 24 (±5) | 18–36 | 8 | 9 |
| Common subjects | 4 | 30 (±4) | 26–36 | 2 | 2 |
Apparatus
Odorant vapors were generated and delivered by dynamic olfactometry, see (Cain et al., 1992), using an 8-channel vapor delivery device (VDD-8). This system has been described in detail in recent studies (Cain et al., 2007a; Cain et al., 2007b; Cometto-Muñiz and Abraham, 2008b; Cometto-Muñiz et al., 2008). Briefly, it consists of 8 stations, each one comprising 3 sniffing cones, forming an array of 24 cones. One of the three cones per station delivers the stimulus (active cone) whereas the other two deliver carbon-filtered air (blanks). One toggle switch per station controls which of the three cones will be the active one on any given trial. The stimulus concentration increases by a fixed factor, here a factor of 2, on going from one station to the next, starting with station 8 (lowest concentration) and ending with station 1 (highest concentration). Each cone delivers a total flow (stimulus + air) of 40 L/min, and is engineered to do so without producing a sensation of draft since the achieved linear air speed is similar to that found in mechanically ventilated rooms (Knudsen et al., 1997; Knudsen et al., 1998). The flow value was chosen to provide sufficient stimulus volume to accommodate human sniffs (Laing, 1982; 1983). Local extraction of air above the cones, and an air extraction rate of 17 ach (air changes per hour) in the whole testing room containing the VDD-8, maintain an environment with minimal odor background.
Procedure
The order in which alkylbenzenes were tested was randomized. On a given day (i.e., session), up to six subjects were tested simultaneously with one odorant and, as a rule, completed all testing with it. Sessions with the same odorant continued until at least 16 subjects were run. Using an ascending concentration approach, testing at each VDD-8 station entailed a three-alternative forced-choice procedure as explained next. Subjects lined-up in the VDD-8 room. Paced by a speaker system, the first participant in line approached station 8 and sniffed in 5-sec windows from cones 1, 2, and 3. Then, the subject had to step back from the cones, choose the cone smelling differently (guessing if necessary), and assign a confidence number to the decision, using a scale from “1”: not confident at all (just guessing), to “5”: extremely confident. The participant recorded the responses in a scoresheet. After a 15 sec interval, the first subject repeated the procedure at station 7, while a second subject began testing at station 8. In this way, participants moved one station at a time from station 8 to 1, and stepped out of the room when completing all stations. This was called a “round”. When all subjects finished, the experimenter set a new random order of active cones across the 8 stations and waited a minimum of 5 min before calling the participants again to start a new “round”. To complete testing with an alkylbenzene, each participant needed to perform at least 35 rounds (a few performed 36 to 41 rounds).
Gas chromatography
Quantification of the stimulus delivered to each station was achieved by gas chromatography (flame ionization detector). Measurements were repeatedly taken from the stimulus(odor)-line of the VDD-8 before subjects started the day session, and one or two times per hour thereafter, during testing. The average coefficient of variation of these vapor concentrations across testing sessions (days) equaled 7% for toluene, 13% for ethyl benzene, 18% for butyl benzene, 20% for hexyl benzene, and 22% for octyl benzene. The following range of concentrations, in seven binary steps, was tested for each alkylbenzene: 3.5 to 445 ppb by volume for toluene, 0.20 to 25 ppb for ethyl benzene, 0.21 to 27 ppb for butyl benzene, 0.30 to 39 ppb for hexyl benzene, and 3.3 to 427 ppb for octyl benzene.
Data Analysis and Modeling
Results were summarized as concentration-detection (i.e., psychometric) odor functions, at both the group and the individual level, and as plots of confidence rating vs. concentration. Probability of detection corrected for chance (P), that is, detectability, was quantified as a number between 0.0 (chance detection) and 1.0 (perfect detection) according to (Macmillan and Creelman, 1991):
| equation (1) |
where P = detection probability corrected for chance, m = number of choices per trial (here, three), and p(c) = proportion correct (i.e., number of correct trials / total number of trials).
Group and individual psychometric odor functions were modeled by a sigmoid (logistic) equation of the form:
| equation (2) |
where P = detection probability (0 ≤ P ≤ 1), Pmax = 1.0, x = vapor concentration (in log ppb by volume), and C and D are constants. C is the value of x when P=0.5, that is, when detection probability is half-way (P=0.5) between chance (P=0.0) and perfect (P=1.0) detection. This value was taken as the odor detection threshold (ODT) expressed in log ppb. In turn, the constant D defines the steepness of the function.
Results
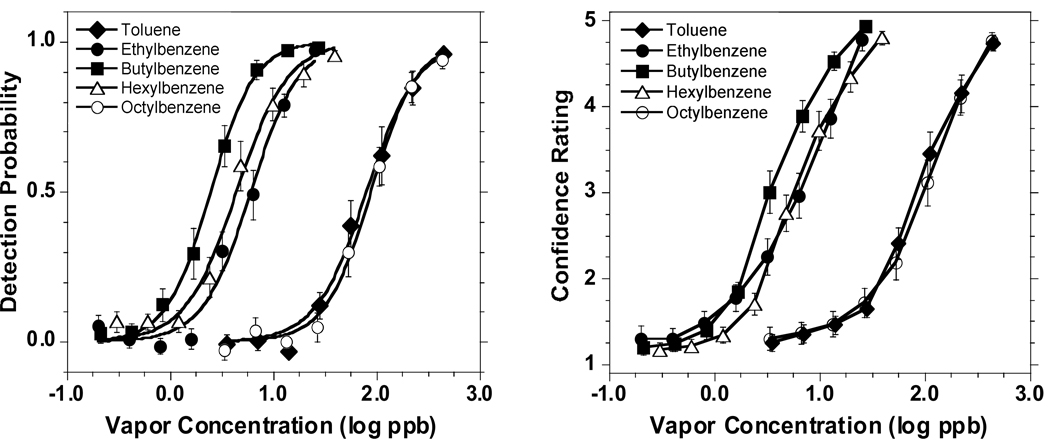
Figure 1 presents group psychometric odor functions and average confidence ratings as a function of concentration for each alkylbenzene. As expected, confidence ratings closely followed the trends in detectability. Table 2 quantifies the odor function for each stimulus in terms of ODT, constants C and D with their respective standard errors (SE), and two measurements of goodness of fit: R2 and Chi square. This quantification was done for the entire group tested with each odorant and for the common group of 4 subjects tested with all five odorants. The similarity between both sets of data provides support to the comparability across odorants within the study. The figure and the table show that the sigmoid equation (2) provides a very adequate fit to the odor detectability data.
Figure 1.
Plots of group psychometric odor detection functions (left graph) and confidence ratings as a function of concentration (right graph) for each alkylbenzene. For toluene, butyl benzene, and hexyl benzene, each point represents the outcome of 560 trials provided by 16 subjects. For ethyl and octyl benzene, each point represents the outcome of 595 trials provided by 17 subjects. Bars indicate standard error (SE). Detectability functions (left graph) were fitted by the sigmoid equation (2).
Table 2.
Upper section. Parameters of the group psychometric odor function modeled by equation (2) for each alkylbenzene, including odor detection threshold (ODT) in ppb, constants C (ODT in log ppb) and D with their respective standard errors (SE), and two estimates of goodness of fit: R2 and Chi square. Lower section. Same parameters as above but for the odor functions from the common group of 4 subjects tested with all five alkylbenzenes.
| All subjects | ||||||||
|---|---|---|---|---|---|---|---|---|
| n | ODT (ppb) | C (log ppb) | SE (C) | D | SE (D) | R2 | Chi square | |
| Toluene | 16 | 79 | 1.90 | ±0.025 | 0.24 | ±0.022 | 0.992 | 0.0086 |
| Ethylbenzene | 17 | 6.0 | 0.78 | ±0.034 | 0.23 | ±0.030 | 0.985 | 0.0162 |
| Butylbenzene | 16 | 2.5 | 0.39 | ±0.012 | 0.21 | ±0.010 | 0.998 | 0.0021 |
| Hexylbenzene | 16 | 4.4 | 0.64 | ±0.030 | 0.25 | ±0.026 | 0.989 | 0.0116 |
| Octylbenzene | 17 | 89 | 1.95 | ±0.018 | 0.22 | ±0.016 | 0.996 | 0.0049 |
| Common Subjects | ||||||||
| n | ODT (ppb) | C (log ppb) | SE (C) | D | SE (D) | R2 | Chi square | |
| Toluene | 4 | 87 | 1.94 | ±0.064 | 0.26 | ±0.057 | 0.957 | 0.0526 |
| Ethylbenzene | 4 | 4.7 | 0.67 | ±0.059 | 0.26 | ±0.053 | 0.961 | 0.0447 |
| Butylbenzene | 4 | 2.2 | 0.35 | ±0.012 | 0.16 | ±0.010 | 0.998 | 0.0029 |
| Hexylbenzene | 4 | 4.5 | 0.65 | ±0.053 | 0.24 | ±0.047 | 0.964 | 0.0381 |
| Octylbenzene | 4 | 46 | 1.66 | ±0.034 | 0.19 | ±0.030 | 0.987 | 0.0194 |
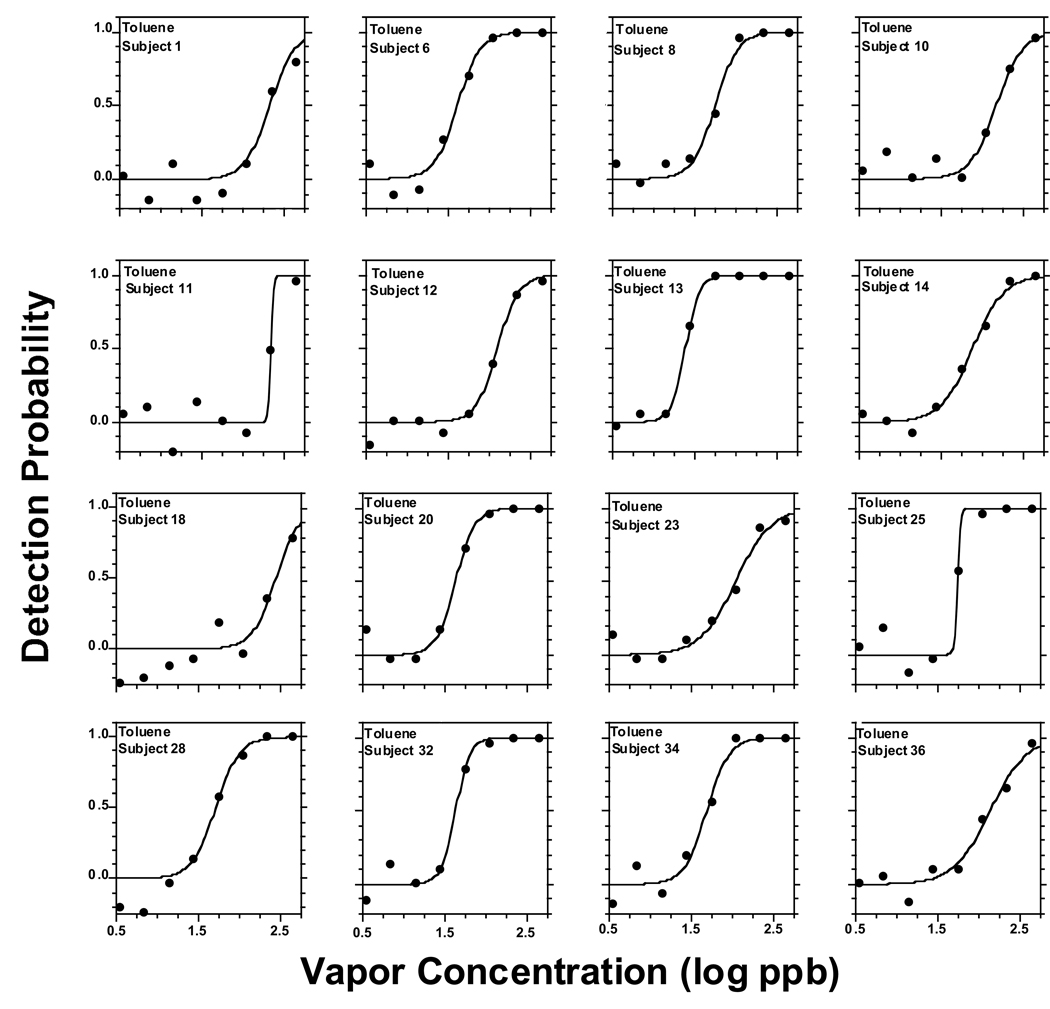
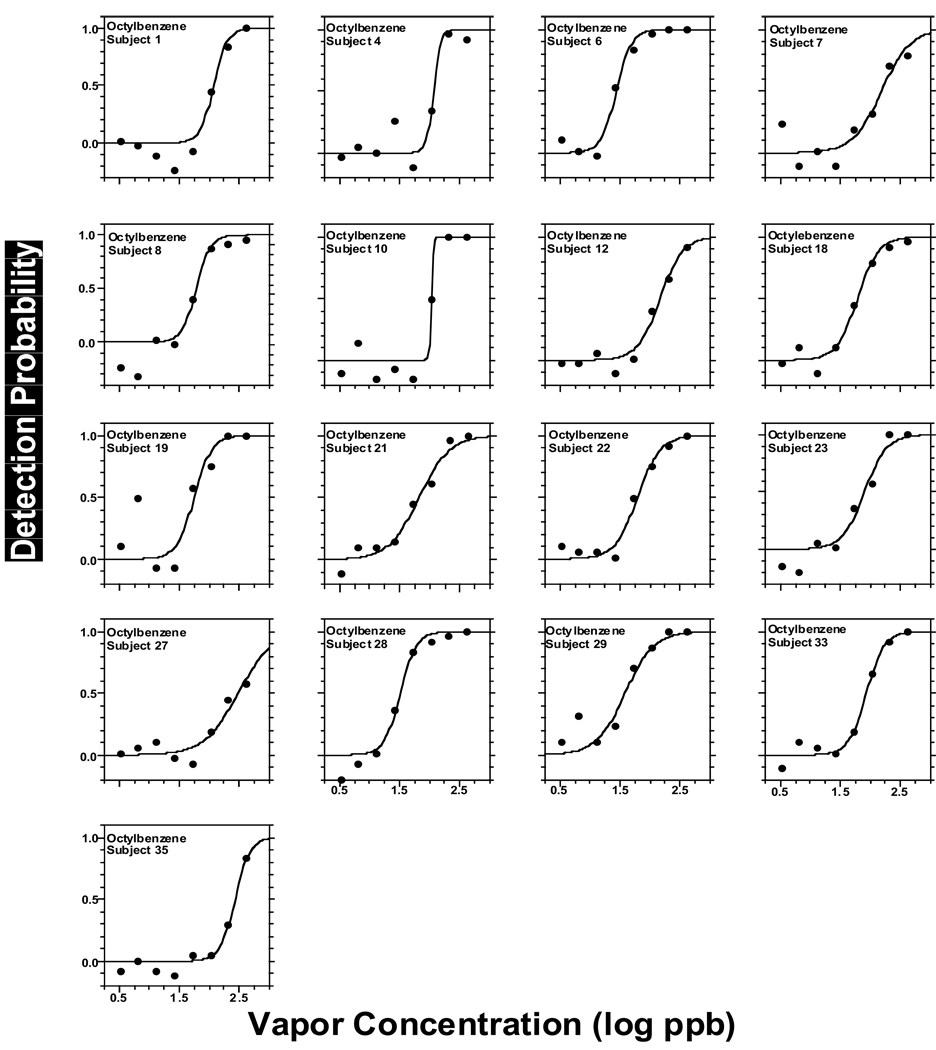
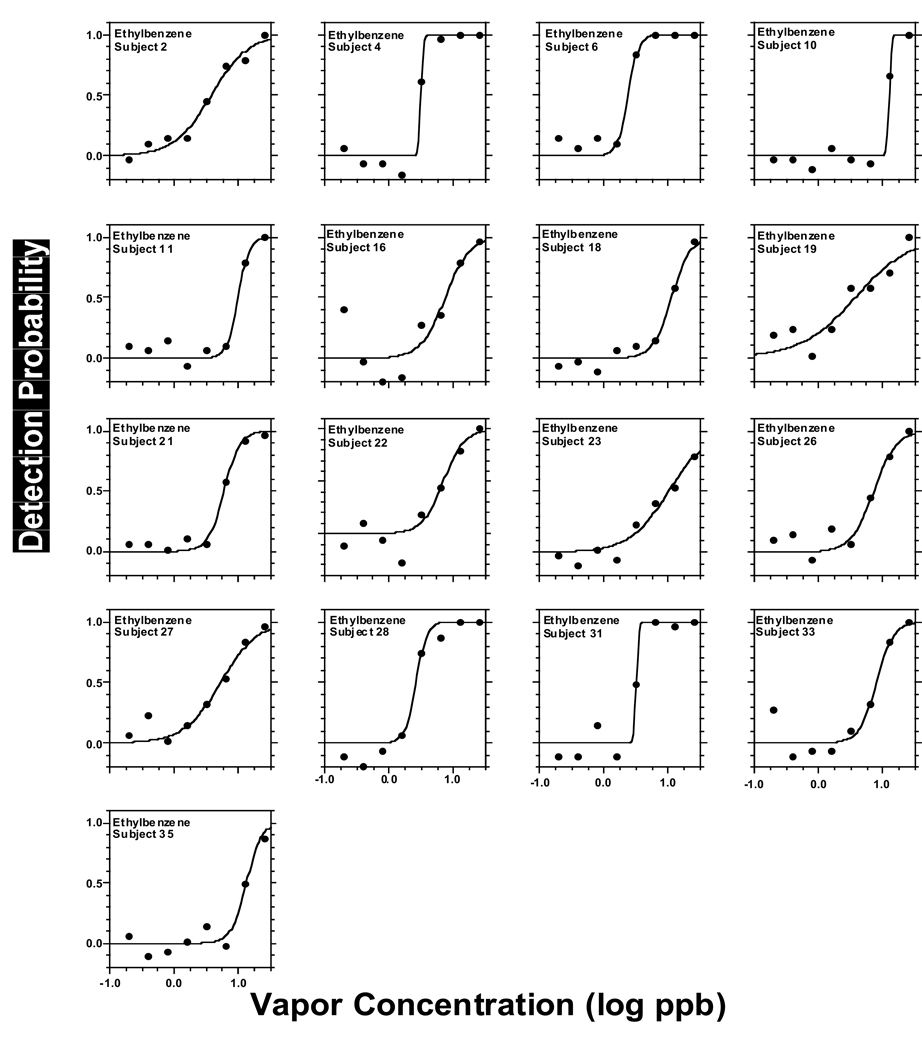
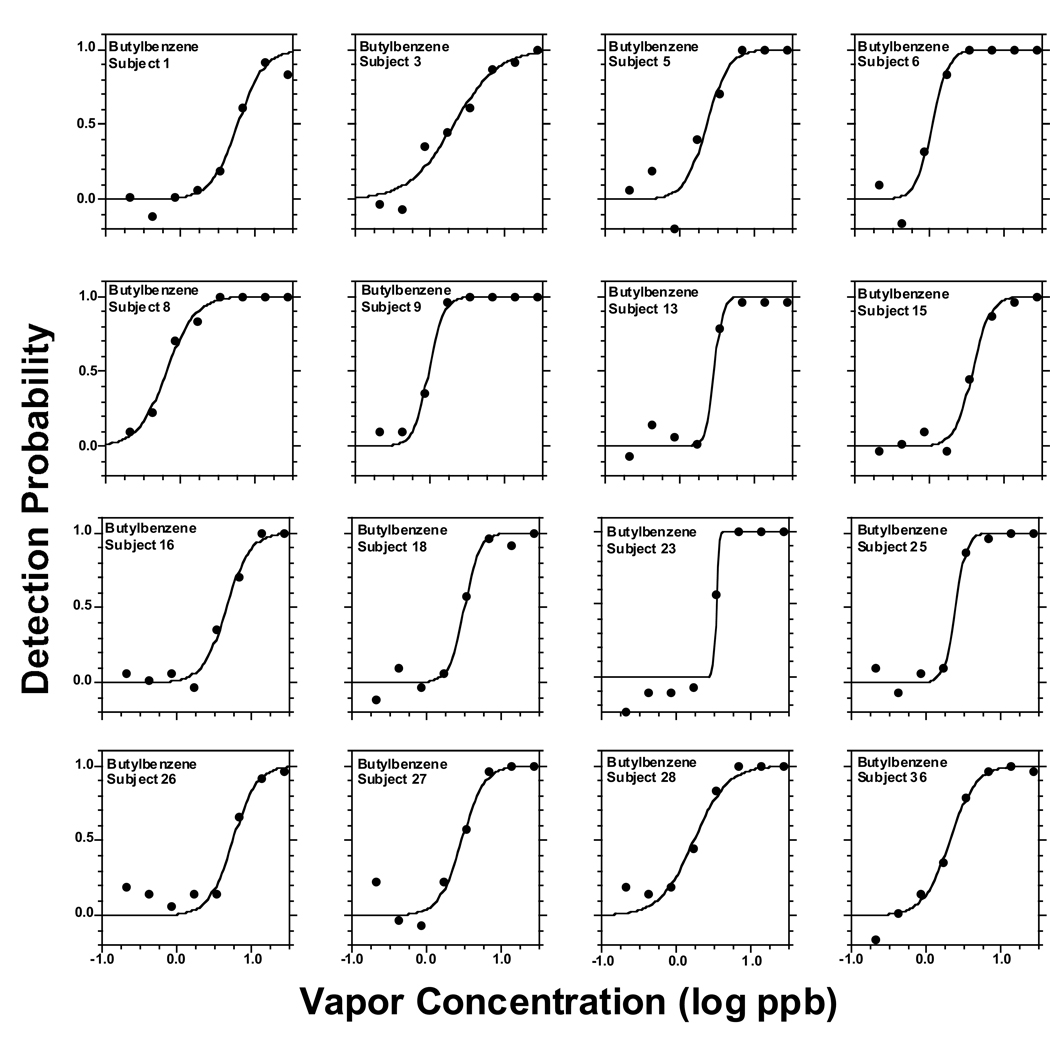
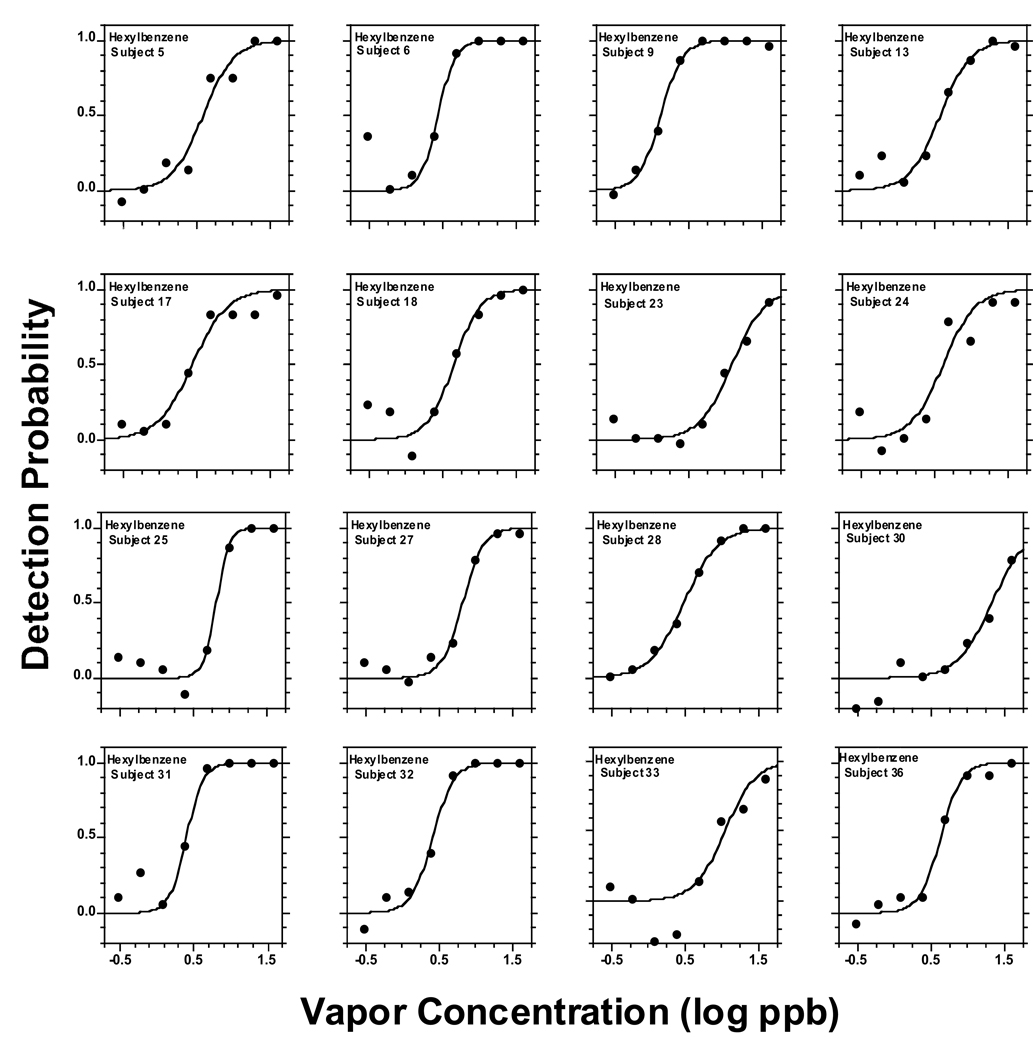
Figure 2 to Figure 6 present individual odor functions for the alkylbenzenes. Each subject was given a unique number so the performance of participants tested with more than one odorant can be followed. Table 3 shows the values of C, D, and R2 for each of these individual functions. As with the group, the sigmoid model provided a very adequate fit to individual odor functions. Table 3 also shows the group value of C and D calculated as the average of the individual data with the corresponding SE. Not surprisingly, the average of individual C-values for each alkylbenzene (Table 3) was almost identical to the value of C calculated from the sigmoid fit to the group as a whole in Table 2 (upper section, all subjects). In turn, the average of individual D-values for each alkylbenzene (Table 3) ranged from 0.13 to 0.18 and was in every case slightly lower than the value of D calculated form the sigmoid fit to the group (Table 2, upper section) which ranged form 0.21 to 0.25. Both ranges of D-values were quite narrow and did not show a pattern or trend across homologs. We note that a lower value of D corresponds to a steeper function.
Figure 2.
Plots of individual psychometric odor functions for toluene, fitted by the sigmoid equation (2). Each point in a graph represents the outcome of 35 trials provided for that concentration by that subject. Each subject was given a unique number, so one can follow the performance of participants tested on more than one alkylbenzene.
Figure 6.
Same as in Fig. 2 but for octyl benzene.
Table 3.
Quantification of individual odor functions for each alkylbenzene in terms of C (i.e., ODT in log ppb), D, and R2, as fitted by the sigmoid equation (2).
| Toluene (n=16) | Ethylbenzene (n=17) | Butylbenzene (n=16) | Hexylbenzene (n=16) | Octylbenzene (n=17) | |||||||||||||||
|---|---|---|---|---|---|---|---|---|---|---|---|---|---|---|---|---|---|---|---|
| Subject | C (log ppb) |
D | R2 | Subject | C (log ppb) |
D | R2 | Subject | C (log ppb) |
D | R2 | Subject | C (log ppb) |
D | R2 | Subject | C (log ppb) |
D | R2 |
| 1 | 2.33 | 0.15 | 0.91 | 2 | 0.57 | 0.29 | 0.97 | 1 | 0.76 | 0.18 | 0.97 | 5 | 0.59 | 0.21 | 0.95 | 1 | 2.08 | 0.11 | 0.94 |
| 6 | 1.61 | 0.14 | 0.98 | 4 | 0.50 | 0.02 | 0.98 | 3 | 0.31 | 0.30 | 0.95 | 6 | 0.44 | 0.12 | 0.90 | 4 | 2.07 | 0.06 | 0.93 |
| 8 | 1.75 | 0.14 | 0.98 | 6 | 0.37 | 0.08 | 0.97 | 5 | 0.35 | 0.15 | 0.93 | 9 | 0.12 | 0.15 | 0.99 | 6 | 1.44 | 0.13 | 0.98 |
| 10 | 2.18 | 0.16 | 0.93 | 10 | 1.10 | 0.02 | 0.98 | 6 | 0.03 | 0.11 | 0.97 | 13 | 0.58 | 0.21 | 0.95 | 7 | 2.19 | 0.24 | 0.87 |
| 11 | 2.35 | 0.02 | 0.92 | 11 | 0.99 | 0.09 | 0.96 | 8 | −0.19 | 0.19 | 0.99 | 17 | 0.44 | 0.24 | 0.95 | 8 | 1.79 | 0.12 | 0.91 |
| 12 | 2.10 | 0.13 | 0.98 | 16 | 0.87 | 0.19 | 0.79 | 9 | −0.02 | 0.10 | 0.99 | 18 | 0.65 | 0.18 | 0.91 | 10 | 2.03 | 0.02 | 0.95 |
| 13 | 1.39 | 0.09 | 1.00 | 18 | 1.05 | 0.14 | 0.97 | 13 | 0.45 | 0.06 | 0.98 | 23 | 1.09 | 0.22 | 0.96 | 12 | 2.17 | 0.19 | 0.96 |
| 14 | 1.88 | 0.19 | 0.99 | 19 | 0.58 | 0.43 | 0.86 | 15 | 0.57 | 0.12 | 0.99 | 24 | 0.62 | 0.22 | 0.88 | 18 | 1.79 | 0.18 | 0.98 |
| 18 | 2.45 | 0.14 | 0.81 | 21 | 0.78 | 0.12 | 0.98 | 16 | 0.66 | 0.16 | 0.98 | 25 | 0.81 | 0.09 | 0.97 | 19 | 1.75 | 0.14 | 0.77 |
| 20 | 1.63 | 0.12 | 0.98 | 22 | 0.85 | 0.16 | 0.91 | 18 | 0.50 | 0.10 | 0.98 | 27 | 0.82 | 0.14 | 0.98 | 21 | 1.82 | 0.25 | 0.97 |
| 23 | 2.04 | 0.22 | 0.97 | 23 | 1.01 | 0.30 | 0.94 | 23 | 0.52 | 0.01 | 0.96 | 28 | 0.48 | 0.23 | 1.00 | 22 | 1.79 | 0.19 | 0.97 |
| 25 | 1.74 | 0.02 | 0.97 | 26 | 0.86 | 0.18 | 0.93 | 25 | 0.39 | 0.07 | 0.99 | 30 | 1.33 | 0.23 | 0.89 | 23 | 1.90 | 0.18 | 0.94 |
| 28 | 1.71 | 0.14 | 0.95 | 27 | 0.72 | 0.28 | 0.94 | 26 | 0.74 | 0.16 | 0.93 | 31 | 0.40 | 0.11 | 0.94 | 27 | 2.49 | 0.28 | 0.89 |
| 32 | 1.63 | 0.09 | 0.98 | 28 | 0.42 | 0.08 | 0.96 | 27 | 0.46 | 0.15 | 0.95 | 32 | 0.41 | 0.14 | 0.98 | 28 | 1.52 | 0.13 | 0.97 |
| 34 | 1.69 | 0.14 | 0.97 | 31 | 0.50 | 0.02 | 0.97 | 28 | 0.23 | 0.23 | 0.96 | 33 | 1.04 | 0.21 | 0.83 | 29 | 1.59 | 0.24 | 0.91 |
| 36 | 2.14 | 0.22 | 0.97 | 33 | 0.90 | 0.13 | 0.92 | 36 | 0.31 | 0.17 | 0.98 | 36 | 0.63 | 0.14 | 0.98 | 33 | 1.94 | 0.15 | 0.98 |
| 35 | 1.13 | 0.12 | 0.94 | 35 | 2.44 | 0.12 | 0.96 | ||||||||||||
| Average | 1.91 | 0.13 | 0.78 | 0.16 | 0.38 | 0.14 | 0.65 | 0.18 | 1.93 | 0.16 | |||||||||
| SE | 0.08 | 0.01 | 0.06 | 0.03 | 0.07 | 0.02 | 0.08 | 0.01 | 0.07 | 0.02 | |||||||||
Discussion
Group odor detection data
Psychometric odor functions across n-alkylbenzenes showed a difference compared with those recently obtained, under identical apparatus and methodology, across homologous n-alcohols (Cometto-Muñiz and Abraham, 2008b) and 2-ketones (Cometto-Muñiz and Abraham, 2009). For these series, the functions across increasing homologs tended to shift towards the left (i.e., lower concentrations) often clustering together for the higher homologs. In contrast, for the alkylbenzenes, the functions shifted left up to butyl benzene and then began to shift right (i.e., towards higher concentrations) such that the functions for the shortest (toluene) and the longest (octyl benzene) alkylbenzene were now clustering together (Figure 1). This somewhat resembles the behavior of homologs in the series of acetate esters (Cometto-Muñiz et al., 2008), as discussed next.
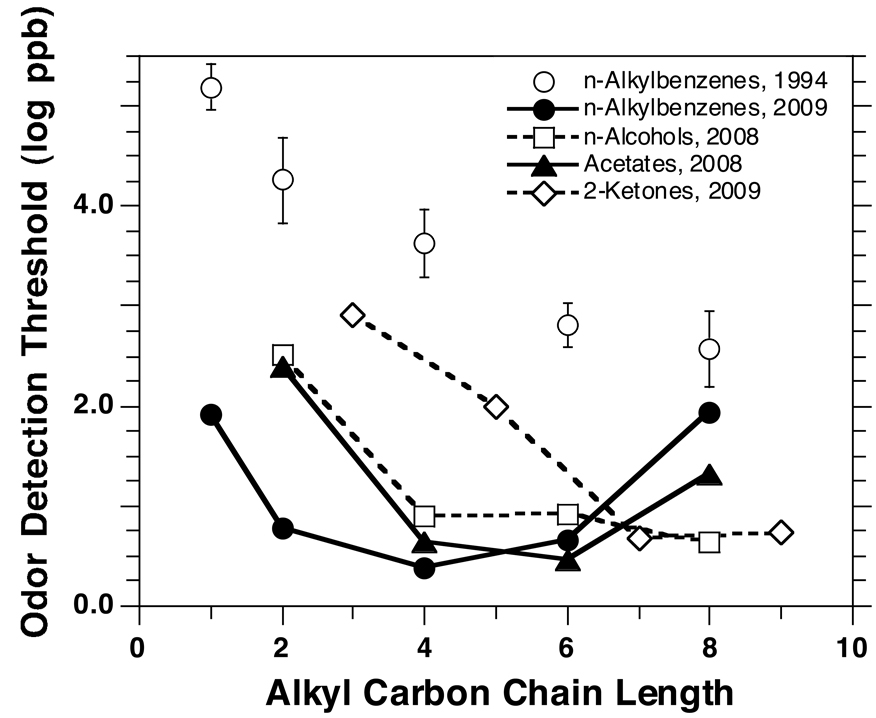
In terms of ODTs, the above effect for alcohols and ketones translated into odor thresholds that declined with carbon chain length until reaching a plateau at the level of 1-butanol and 2-heptanone, respectively (Figure 7). Nevertheless, among the acetates, an upward rebound in ODT was observed for octyl acetate (the largest homolog tested) whose ODT was higher than those for hexyl and butyl acetate (Figure 7). In the case of the alkylbenzenes, ODTs decreased with carbon chain length from toluene to butyl benzene, and, then, they increased from butyl to octyl benzene. This generated a clear U-shaped trend such that the ODTs for toluene and octyl benzene were similar (79 and 89 ppb, respectively) and much higher than those for the intermediate homologs (Figure 1, left; Table 2, upper section). The effect is illustrated in Figure 7. Results from nonhuman primates have suggested that detectability of odorants may also be affected by their behavioral relevance and/or environmental frequency of occurrence, sometimes leading to U-shaped functions along homologous VOCs (Hernandez Salazar et al., 2003).
Figure 7.
Comparison of ODTs along homologous alkylbenzenes obtained in this study (2009) with those obtained in a previous study (1994) that delivered vapors via static olfactometry (squeeze bottles) and employed a conservative, fixed-performance criterion (i.e., five out of five correct in an ascending concentration approach) (Cometto-Muñiz and Cain, 1994). Bars indicate standard error (SE) (they are covered by the symbol in the case of the present data). Also shown are the trends in ODTs along homologous n-alcohols (Cometto-Muñiz and Abraham, 2008b), 2-ketones (Cometto-Muñiz and Abraham, 2009), and acetate esters (Cometto-Muñiz et al., 2008) (see text).
As discussed in detail in recent papers, e.g., (Cometto-Muñiz et al., 2008), Figure 7 also shows that the improved apparatus and methodology employed here renders substantially lower thresholds that those obtained previously for the same alkylbenzenes delivered via squeeze bottles under a conservative fixed-performance criterion (Cometto-Muñiz and Cain, 1994). A similar gap in odor thresholds between the new and old methodology has been reported for alcohols, acetates, and ketones, but, for these series, the relative trend in ODTs as a function of carbon chain length remained similar across the two methodologies (Cometto-Muñiz and Abraham, 2008b; 2009; Cometto-Muñiz et al., 2008). In contrast, the present results with alkylbenzenes reveal a clear Ushape trend of ODTs as a function of carbon chain length, an effect not captured with the old methodology.
In line with previous findings (Abraham et al., 2002), we suggest that the loss in odor potency (i.e., a rebound to higher thresholds) insinuated previously with octyl acetate (Cometto-Muñiz et al., 2008) and clearly manifested here from butyl benzene onwards, reflects the start of a hampering effect of molecular size on olfactory detection. In other words, successive larger homologs along a series reach a critical dimension such that their ODTs stop to decrease with carbon chain length and, instead, begin to increase with it. The phenomenon is not new in chemosensory perception. An even more abrupt hampering effect of molecular dimension on human chemosensory detection of homologous vapors has been described for trigeminal chemesthesis, i.e., chemical sensory irritation of nose and eyes (Cain et al., 2006; Cometto-Muñiz and Abraham, 2008a; Cometto-Muñiz et al., 2005; Cometto-Muñiz et al., 2007a; b). In this case, a cut-off is produced in the series such that upon reaching a homolog of a certain size, trigeminal chemesthetic detection fails to be elicited altogether.
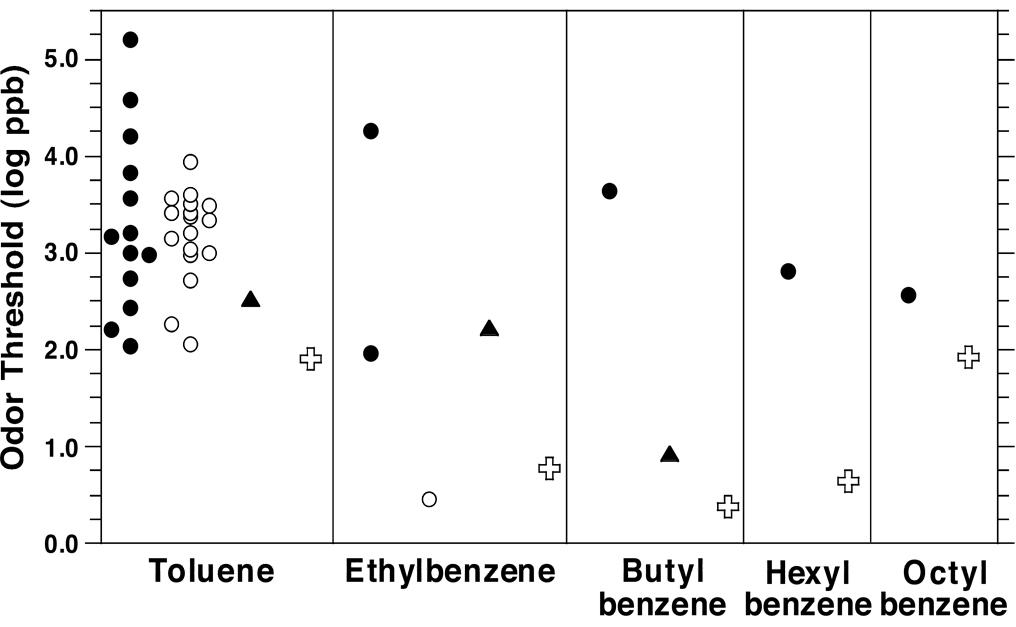
The present odor thresholds for n-alkylbenzenes fall among the lowest values previously reported, as shown in a comparison with ODTs in the literature compiled by van Gemert (van Gemert, 2003) and those compiled and standardized by Devos et al. (Devos et al., 1990) (Figure 8). The figure also shows that the ODTs measured here fall close or lower than those measured by Nagata (Nagata, 2003) using a triangle odor bag method (Iwasaki, 2003). (The method is also described in considerable detail at: http://www.env.go.jp/en/air/odor/olfactory_mm/01method_2-2-2.pdf.) We have argued (Cometto-Muñiz et al., 2008) that by attempting to optimize both the chemico-analytical and the psychophysical procedures, the resulting odor thresholds, devoid of many common sources of “noise”, would end up falling at the low end of the reported values, an expectation confirmed here again.
Figure 8.
Illustration of the range of ODTs for n-alkylbenzenes in air reported in the literature, as compiled by van Gemert (filled circles) (van Gemert, 2003) and as compiled and standardized by Devos et al. (empty circles) (Devos et al., 1990). (Values from the studies listed in each compilation are spread out along the x-axis for clarity.) We also show ODTs obtained by Nagata (triangles) (Nagata, 2003), and those obtained in the present study (crosses).
Individual odor detection data
Psychometric functions were also obtained at the individual level. The sigmoid equation (2) provided a very adequate description of the data at this level too (Table 3 and Figure 2 to Figure 6). Interindividual variability, calculated as the ratio of ODTs (in ppb) between the least and the most sensitive subject for each odorant, equaled 12 for toluene, 5.6 for ethylbenzene, 8.9 for butylbenzene, 16 for hexylbenzene, and 11 for octylbenzene. Alternatively, calculated as the interquartile range of individual ODTs (in log ppb), interindividual variability equaled 0.48 for toluene, 0.42 for ethylbenzene, 0.25 for butylbenzene, 0.37 for hexylbenzene, and 0.29 for octylbenzene. These results agree well with those recently obtained for homologous alcohols, acetates, and ketones (Cometto-Muñiz and Abraham, 2008b; 2009; Cometto-Muñiz et al., 2008) and point to an interindividual variability of about one order of magnitude between the least and the most sensitive participant among a group of normosmic, nonsmoker, young adults of both genders. Such relatively small variability in olfactory detection has been observed before (Rabin and Cain, 1986; Walker et al., 2003) but is considerably lower than the 3 to 5, or even higher, orders of magnitude frequently reported (Brown et al., 1968; Jones, 1957; Punter, 1983; Stevens et al., 1988; Yoshida, 1984).
A quantitative structure-activity relationship (QSAR) for ODTs in humans
Previously, using ODTs measured via the squeeze bottle system and the fixed-performance criterion mentioned above, we have developed a QSAR for odor potency from up to 60 volatile organic compounds (VOCs), including alcohols, esters (acetates), ketones, alkylbenzenes, terpenes, carboxylic acids, aliphatic aldehydes, and a few miscellaneous compounds (Abraham et al., 2002; Abraham et al., 2007). The QSAR is based on the solvation equation of Abraham (Abraham, 1993; Abraham et al., 2005; 2006; 2008) and has been described in detail in the cited publications. The outcome revealed that “selective” processes accounted for 77% of the variation in odor potency among the VOCs tested. By selective, we mean effects that rest on the successive transfer of the odorant from the gas phase, when it enters the nose, to the final receptor(s) phase(s). In transfer-driven processes, small structural changes in the VOC evoke predictable, and rather small, changes in biological activity. The remaining variation in odor potency involved a “specific” effect due to molecular size, that might involve OR–odorant interactions and/or odorant-binding proteins, and a specific effect for aldehydes and carboxylic acids, that might rest on the chemical reactivity of these series. In these kind of effects, small structural changes in the VOC evoke less predictable, and often large, changes in biological activity. The specific molecular size effect has been clearly manifested again here with the alkylbenzenes (Table 2, Figure 1, and Figure 7).
As discussed above, the present approach and methodology, by measuring psychometric functions, goes well beyond just gathering single odor thresholds. It also provides ODTs that reflect closely the absolute sensitivity of human olfaction, both at the group and at the individual level. Given these advantages, and within the context of the relative comparability between the previous and present odor potency values, we aim to develop another QSAR based on the solvation model but with the ability to describe and predict psychometric odor detection functions, as obtained here and in the recent studies. The initial viability of this endeavor has been shown (Cometto-Muñiz et al., 2008), although additional VOCs still need to be tested. The present results with n-alkylbenzenes (Figure 7) highlight the need to include in such QSAR a novel term or “descriptor” accounting for VOCs exceeding a certain molecular size. Studies at the molecular level have explored the structural determinants of odorant ligands (e.g., molecular size, chemical functionality) for very few of the approximately 380 human ORs (Schmiedeberg et al., 2007). In contrast, the behavioral approach, as exemplified here, probes simultaneously the entire array of ORs integrated within the intact olfactory pathway. This complementary strategy to establish QSARs has considerable merit given the combinatorial characteristics of ORs (Firestein, 2004), their high number and relative broad chemical selectivity (Katada et al., 2005), and the modulation of the olfactory signal at higher neural levels (Lledo et al., 2005).
Figure 3.
Same as in Fig. 2 but for ethyl benzene.
Figure 4.
Same as in Fig. 2 but for butyl benzene.
Figure 5.
Same as in Fig. 2 but for hexyl benzene.
Acknowledgements
The work described in this article was funded by grant number R01 DC 002741 from the National Institute on Deafness and Other Communication Disorders (NIDCD), National Institutes of Health (NIH). Thanks are due to E. Moreno-Davis for excellent technical assistance. Thanks are also due to J. Choy, S. Lee and M. Bahramzi for their help in processing and plotting data.
List of Abbreviations
- EOG
Electroolfatogram
- ODT
Odor detection threshold
- OR
Olfactory receptor
- OSN
Olfactory sensory neuron
- QSAR
Quantitative structure-activity relationship
- SE
Standard error
- VDD-8
8-Channel vapor delivery device
- VOC
Volatile organic compound
Footnotes
Publisher's Disclaimer: This is a PDF file of an unedited manuscript that has been accepted for publication. As a service to our customers we are providing this early version of the manuscript. The manuscript will undergo copyediting, typesetting, and review of the resulting proof before it is published in its final citable form. Please note that during the production process errors may be discovered which could affect the content, and all legal disclaimers that apply to the journal pertain.
References
- Abraham MH. Scales of solute hydrogen-bonding: Their construction and application to physicochemical and biochemical processes. Chem Soc Rev. 1993;22:73–83. [Google Scholar]
- Abraham MH, Gola JMR, Cometto-Muñiz JE, Cain WS. A model for odour thresholds. Chem Senses. 2002;27:95–104. doi: 10.1093/chemse/27.2.95. [DOI] [PubMed] [Google Scholar]
- Abraham MH, Ibrahim A, Acree WE., Jr Air to blood distribution of volatile organic compounds: a linear free energy analysis. Chem Res Toxicol. 2005;18:904–911. doi: 10.1021/tx050066d. [DOI] [PubMed] [Google Scholar]
- Abraham MH, Ibrahim A, Acree WE., Jr Air to brain, blood to brain and plasma to brain distribution of volatile organic compounds: linear free energy analyses. Eur J Med Chem. 2006;41:494–502. doi: 10.1016/j.ejmech.2006.01.004. [DOI] [PubMed] [Google Scholar]
- Abraham MH, Ibrahim A, Acree WE., Jr Air to lung partition coefficients for volatile organic compounds and blood to lung partition coefficients for volatile organic compounds and drugs. Eur J Med Chem. 2008;43:478–485. doi: 10.1016/j.ejmech.2007.04.002. [DOI] [PubMed] [Google Scholar]
- Abraham MH, Sanchez-Moreno R, Cometto-Muñiz JE, Cain WS. A quantitative structure-activity analysis on the relative sensitivity of the olfactory and the nasal trigeminal chemosensory systems. Chem Senses. 2007;32:711–719. doi: 10.1093/chemse/bjm038. [DOI] [PubMed] [Google Scholar]
- Brown KS, Maclean CM, Robinette RR. The distribution of the sensitivity to chemical odors in man. Hum Biol. 1968;40:456–472. [PubMed] [Google Scholar]
- Cain WS. Testing olfaction in a clinical setting. Ear Nose Throat J. 1989;68:316–328. [PubMed] [Google Scholar]
- Cain WS, Cometto-Muñiz JE, de Wijk RA. Techniques in the quantitative study of human olfaction. In: Serby M, Chobor K, editors. The Science of Olfaction. New York: Springer-Verlag; 1992. pp. 279–308. [Google Scholar]
- Cain WS, Lee NS, Wise PM, Schmidt R, Ahn BH, Cometto-Muñiz JE, Abraham MH. Chemesthesis from volatile organic compounds: Psychophysical and neural responses. Physiol Behav. 2006;88:317–324. doi: 10.1016/j.physbeh.2006.03.035. [DOI] [PubMed] [Google Scholar]
- Cain WS, Schmidt R, Jalowayski AA. Odor and chemesthesis from exposures to glutaraldehyde vapor. Int Arch Occup Environ Health. 2007a;80:721–731. doi: 10.1007/s00420-007-0185-0. [DOI] [PubMed] [Google Scholar]
- Cain WS, Schmidt R, Wolkoff P. Olfactory detection of ozone and D-limonene: reactants in indoor spaces. Indoor Air. 2007b;17:337–347. doi: 10.1111/j.1600-0668.2007.00476.x. [DOI] [PubMed] [Google Scholar]
- Cometto-Muñiz JE, Abraham MH. A cut-off in ocular chemesthesis from vapors of homologous alkylbenzenes and 2-ketones as revealed by concentration-detection functions. Toxicol Appl Pharmacol. 2008a;230:298–303. doi: 10.1016/j.taap.2008.03.011. [DOI] [PMC free article] [PubMed] [Google Scholar]
- Cometto-Muñiz JE, Abraham MH. Human olfactory detection of homologous n-alcohols measured via concentration-response functions. Pharmacol Biochem Behav. 2008b;89:279–291. doi: 10.1016/j.pbb.2007.12.023. [DOI] [PMC free article] [PubMed] [Google Scholar]
- Cometto-Muñiz JE, Abraham MH. Olfactory psychometric functions for homologous 2-ketones. Behav Brain Res. 2009 doi: 10.1016/j.bbr.2009.02.014. (in press) [DOI] [PMC free article] [PubMed] [Google Scholar]
- Cometto-Muñiz JE, Cain WS. Sensory reactions of nasal pungency and odor to volatile organic compounds: The alkylbenzenes. Am Ind Hyg Assoc J. 1994;55:811–817. doi: 10.1080/15428119491018529. [DOI] [PubMed] [Google Scholar]
- Cometto-Muñiz JE, Cain WS, Abraham MH. Determinants for nasal trigeminal detection of volatile organic compounds. Chem Senses. 2005;30:627–642. doi: 10.1093/chemse/bji056. [DOI] [PubMed] [Google Scholar]
- Cometto-Muñiz JE, Cain WS, Abraham MH, Gil-Lostes J. Concentration-detection functions for the odor of homologous n-acetate esters. Physiol Behav. 2008;95:658–667. doi: 10.1016/j.physbeh.2008.09.021. [DOI] [PMC free article] [PubMed] [Google Scholar]
- Cometto-Muñiz JE, Cain WS, Abraham MH, Sánchez-Moreno R. Concentration-detection functions for eye irritation evoked by homologous n-alcohols and acetates approaching a cut-off point. Exp Brain Res. 2007a;182:71–79. doi: 10.1007/s00221-007-0966-4. [DOI] [PubMed] [Google Scholar]
- Cometto-Muñiz JE, Cain WS, Abraham MH, Sánchez-Moreno R. Cutoff in detection of eye irritation from vapors of homologous carboxylic acids and aliphatic aldehydes. Neuroscience. 2007b;145:1130–1137. doi: 10.1016/j.neuroscience.2006.12.032. [DOI] [PMC free article] [PubMed] [Google Scholar]
- Devos M, Patte F, Rouault J, Laffort P, van Gemert LJ. Standardized Human Olfactory Thresholds. Oxford: IRL Press; 1990. [Google Scholar]
- Farahbod H, Johnson BA, Minami SS, Leon M. Chemotopic representations of aromatic odorants in the rat olfactory bulb. J Comp Neurol. 2006;497:350–366. doi: 10.1002/cne.20982. [DOI] [PMC free article] [PubMed] [Google Scholar]
- Firestein S. A code in the nose. Sci STKE 2004. 2004 doi: 10.1126/stke.2272004pe15. pe15. [DOI] [PubMed] [Google Scholar]
- Go Y, Niimura Y. Similar numbers but different repertoires of olfactory receptor genes in humans and chimpanzees. Mol Biol Evol. 2008;25:1897–1907. doi: 10.1093/molbev/msn135. [DOI] [PubMed] [Google Scholar]
- Hellman A, Chess A. Olfactory axons: a remarkable convergence. Curr Biol. 2002;12:R849–R851. doi: 10.1016/s0960-9822(02)01351-9. [DOI] [PubMed] [Google Scholar]
- Hernandez Salazar LT, Laska M, Rodriguez Luna E. Olfactory sensitivity for aliphatic esters in spider monkeys (Ateles geoffroyi) Behav Neurosci. 2003;117:1142–1149. doi: 10.1037/0735-7044.117.6.1142. [DOI] [PubMed] [Google Scholar]
- Iwasaki Y. Odor measurement review. Tokyo: Office of Odor, Noise and Vibration Environmental Management Bureau, Ministry of Environment, Tokyo; 2003. Measurement of odor threshold by triangle odor bag method; pp. 37–47. [Google Scholar]
- Johnson BA, Farahbod H, Leon M. Interactions between odorant functional group and hydrocarbon structure influence activity in glomerular response modules in the rat olfactory bulb. J Comp Neurol. 2005;483:205–216. doi: 10.1002/cne.20409. [DOI] [PMC free article] [PubMed] [Google Scholar]
- Johnson BA, Leon M. Chemotopic odorant coding in a mammalian olfactory system. J Comp Neurol. 2007;503:1–34. doi: 10.1002/cne.21396. [DOI] [PMC free article] [PubMed] [Google Scholar]
- Jones FN. An analysis of individual differences in olfactory thresholds. Am J Psychol. 1957;70:227–232. [PubMed] [Google Scholar]
- Katada S, Hirokawa T, Oka Y, Suwa M, Touhara K. Structural basis for a broad but selective ligand spectrum of a mouse olfactory receptor: mapping the odorant-binding site. J Neurosci. 2005;25:1806–1815. doi: 10.1523/JNEUROSCI.4723-04.2005. [DOI] [PMC free article] [PubMed] [Google Scholar]
- Katoh K, Koshimoto H, Tani A, Mori K. Coding of odor molecules by mitral/tufted cells in rabbit olfactory bulb. II. Aromatic compounds. J Neurophysiol. 1993;70:2161–2175. doi: 10.1152/jn.1993.70.5.2161. [DOI] [PubMed] [Google Scholar]
- Knudsen HN, Clausen G, Fanger PO. Sensory characterization of emissions from materials. Indoor Air. 1997;7:107–115. [Google Scholar]
- Knudsen HN, Valbjørn O, Nielsen PA. Determination of exposure-response relationships for emissions from building products. Indoor Air. 1998;8:264–275. [Google Scholar]
- Laing DG. Characterisation of human behaviour during odour perception. Perception. 1982;11:221–230. doi: 10.1068/p110221. [DOI] [PubMed] [Google Scholar]
- Laing DG. Natural sniffing gives optimum odour perception for humans. Perception. 1983;12:99–117. doi: 10.1068/p120099. [DOI] [PubMed] [Google Scholar]
- Lledo PM, Gheusi G, Vincent JD. Information processing in the mammalian olfactory system. Physiol Rev. 2005;85:281–317. doi: 10.1152/physrev.00008.2004. [DOI] [PubMed] [Google Scholar]
- Macmillan NA, Creelman CD. Cambridge: Cambridge University Press; 1991. Detection theory: A user's guide. [Google Scholar]
- Maresh A, Rodriguez Gil D, Whitman MC, Greer CA. Principles of glomerular organization in the human olfactory bulb--implications for odor processing. PLoS ONE. 2008;3:e2640. doi: 10.1371/journal.pone.0002640. [DOI] [PMC free article] [PubMed] [Google Scholar]
- Mergler D, Beauvais B. Olfactory threshold shift following controlled 7-hour exposure to toluene and/or xylene. Neurotoxicology. 1992;13:211–215. [PubMed] [Google Scholar]
- Mori K, Takahashi YK, Igarashi KM, Yamaguchi M. Maps of odorant molecular features in the Mammalian olfactory bulb. Physiol Rev. 2006;86:409–433. doi: 10.1152/physrev.00021.2005. [DOI] [PubMed] [Google Scholar]
- Nagata Y. Odor measurement review. Tokyo: Office of Odor, Noise and Vibration. Environmental Management Bureau, Ministry of Environment, Tokyo; 2003. Measurement of odor threshold by triangle odor bag method; pp. 118–127. [Google Scholar]
- Nguyen MQ, Zhou Z, Marks CA, Ryba NJ, Belluscio L. Prominent roles for odorant receptor coding sequences in allelic exclusion. Cell. 2007;131:1009–1017. doi: 10.1016/j.cell.2007.10.050. [DOI] [PMC free article] [PubMed] [Google Scholar]
- Nielsen GD, Alarie Y. Sensory irritation, pulmonary irritation, and respiratory stimulation by airborne benzene and alkylbenzenes: prediction of safe industrial exposure levels and correlation with their thermodynamic properties. Toxicol Appl Pharmacol. 1982;65:459–477. doi: 10.1016/0041-008x(82)90391-x. [DOI] [PubMed] [Google Scholar]
- Orbaek P, Osterberg K, Akesson B, Bergendorf U, Karlson B, Seger L. Suprathreshold intensity and annoyance reactions in experimental challenge to toluene and n-butyl acetate among subjects with long-term solvent exposure. Scand J Work Environ Health. 1998;24:432–438. [PubMed] [Google Scholar]
- Osterberg K, Orbaek P, Karlson B, Akesson B, Bergendorf U. Annoyance and performance during the experimental chemical challenge of subjects with multiple chemical sensitivity. Scand J Work Environ Health. 2003;29:40–50. [PubMed] [Google Scholar]
- Panev T, Pavlova M, Tzoneva M. An assessment of the exposure of technicians working in a chemical laboratory for aromatic hydrocarbons at Neftochim, Burgas. Int Arch Occup Environ Health. 1998;71(Suppl):S60–S63. [PubMed] [Google Scholar]
- Parra MA, Elustondo D, Bermejo R, Santamaria JM. Exposure to volatile organic compounds (VOC) in public buses of Pamplona, Northern Spain. Sci Total Environ. 2008;404:18–25. doi: 10.1016/j.scitotenv.2008.05.028. [DOI] [PubMed] [Google Scholar]
- Punter PH. Measurement of human olfactory thresholds for several groups of structurally related compounds. Chem Senses. 1983;7:215–235. [Google Scholar]
- Rabin MD, Cain WS. Determinants of measured olfactory sensitivity. Percept Psychophys. 1986;39:281–286. doi: 10.3758/bf03204936. [DOI] [PubMed] [Google Scholar]
- Ryan TJ, Hart EM, Kappler LL. VOC exposures in a mixed-use university art building. AIHA J (Fairfax, Va) 2002;63:703–708. doi: 10.1080/15428110208984758. [DOI] [PubMed] [Google Scholar]
- Schmiedeberg K, Shirokova E, Weber HP, Schilling B, Meyerhof W, Krautwurst D. Structural determinants of odorant recognition by the human olfactory receptors OR1A1 and OR1A2. J Struct Biol. 2007;159:400–412. doi: 10.1016/j.jsb.2007.04.013. [DOI] [PubMed] [Google Scholar]
- Scott JW, Acevedo HP, Sherrill L, Phan M. Responses of the rat olfactory epithelium to retronasal air flow. J Neurophysiol. 2007;97:1941–1950. doi: 10.1152/jn.01305.2006. [DOI] [PMC free article] [PubMed] [Google Scholar]
- Scott JW, Brierley T, Schmidt FH. Chemical determinants of the rat electroolfactogram. J Neurosci. 2000;20:4721–4731. doi: 10.1523/JNEUROSCI.20-12-04721.2000. [DOI] [PMC free article] [PubMed] [Google Scholar]
- Seeber A, van Thriel C, Haumann K, Kiesswetter E, Blaszkewicz M, Golka K. Psychological reactions related to chemosensory irritation. Int Arch Occup Environ Health. 2002;75:314–325. doi: 10.1007/s00420-002-0316-6. [DOI] [PubMed] [Google Scholar]
- Serizawa S, Miyamichi K, Nakatani H, Suzuki M, Saito M, Yoshihara Y, Sakano H. Negative feedback regulation ensures the one receptor-one olfactory neuron rule in mouse. Science. 2003;302:2088–2094. doi: 10.1126/science.1089122. [DOI] [PubMed] [Google Scholar]
- Skoufos E, Marenco L, Nadkarni PM, Miller PL, Shepherd GM. Olfactory receptor database: a sensory chemoreceptor resource. Nucleic Acids Res. 2000;28:341–343. doi: 10.1093/nar/28.1.341. [DOI] [PMC free article] [PubMed] [Google Scholar]
- Stevens JC, Cain WS, Burke RJ. Variability of olfactory thresholds. Chem Senses. 1988;13:643–653. [Google Scholar]
- Takahashi YK, Kurosaki M, Hirono S, Mori K. Topographic representation of odorant molecular features in the rat olfactory bulb. J Neurophysiol. 2004;92:2413–2427. doi: 10.1152/jn.00236.2004. [DOI] [PubMed] [Google Scholar]
- van Gemert LJ. Compilations of odour threshold values in air, water and other media. Utrech: Oliemans, Punter & Partners BV; 2003. Odour Thresholds. [Google Scholar]
- van Thriel C, Haumann K, Kiesswetter E, Blaszkewicz M, Seeber A. Time courses of sensory irritations due to 2-butanone and ethyl benzene exposure: influences of self-reported multiple chemical sensitivity (sMCS) Int J Hyg Environ Health. 2002;204:367–369. doi: 10.1078/1438-4639-00112. [DOI] [PubMed] [Google Scholar]
- van Thriel C, Seeber A, Kiesswetter E, Blaszkewicz M, Golka K, Wiesmuller GA. Physiological and psychological approaches to chemosensory effects of solvents. Toxicol Lett. 2003:140–141. 261–271. doi: 10.1016/s0378-4274(03)00022-5. [DOI] [PubMed] [Google Scholar]
- Vassar R, Chao SK, Sitcheran R, Nunez JM, Vosshall LB, Axel R. Topographic organization of sensory projections to the olfactory bulb. Cell. 1994;79:981–991. doi: 10.1016/0092-8674(94)90029-9. [DOI] [PubMed] [Google Scholar]
- Walker JC, Hall SB, Walker DB, Kendal-Reed MS, Hood AF, Niu XF. Human odor detectability: New methodology used to determine threshold and variation. Chem Senses. 2003;28:817–826. doi: 10.1093/chemse/bjg075. [DOI] [PubMed] [Google Scholar]
- Yoshida M. Correlation analysis of detection threshold data for 'standard test' odors. Bull Fac Sci Eng Chuo Univ. 1984;27:343–353. [Google Scholar]
- Yu IT, Lee NL, Zhang XH, Chen WQ, Lam YT, Wong TW. Occupational exposure to mixtures of organic solvents increases the risk of neurological symptoms among printing workers in Hong Kong. J Occup Environ Med. 2004;46:323–330. doi: 10.1097/01.jom.0000121367.69269.07. [DOI] [PubMed] [Google Scholar]


